2.1.1 Getting started
Author |
Version |
Date |
Yu Geunmo |
v1.1 |
2023-05-24 |
Before we get to the
This user guide provides an introduction to OPENMARU Cloud APM and its main features, and is intended for users who want to monitor web application servers (WAS) using OPENMARU Cloud APM. It is also a guide for identifying and analyzing failure causes through monitoring of web applications.
OPENMARU Cloud APM ?
OPENMARU Cloud APM is an application performance monitoring (APM) tool that provides real-time monitoring of Java-based web applications, which can be used to proactively prevent failures and continuously improve performance.
In addition to real-time behavioral monitoring, OPENMARU Cloud APM provides the ability to apply real-time statistical analysis techniques to proactively determine problems.
Main features
OPENMARU Cloud APM is a product for monitoring web application servers and provides the following features.
-
Provides service satisfaction index (APDEX)
It expresses the user’s satisfaction with the provided web application in a single number, and you can understand the service situation at a glance through an index ranging from 0 to 100.
-
‘T-Map’ Transaction Distribution
For intuitive analysis of the overall response time of the service, transactions are represented as a heat map, and detailed profiling including SQL queries for selected cells is provided.
-
Real-time Forecast(Forecast)
Real-time statistical analysis alerts you to predictive events that will reach thresholds set by administrators in the next few minutes.
-
WAS Failure Analysis Tool
Provides JVM Thread Dump analysis tool, which is the most used tool for failure analysis of WAS, and provides various data required for WAS Troubleshooting.
-
Anomaly Monitoring
When anomalous values are detected through statistical analysis, it notifies you through events.
-
OS resource and web server monitoring
Monitor various values such as OS CPU, Memory, Disk usage, Load Average, Network usage, Socket status, Web server traffic, RPS, etc.
-
Sophisticated event handling
Threshold values are calculated based on the statistical values of the collected values for the monitored indicators, so monitoring events are only triggered when absolutely necessary.
-
HTML 5-based User Interface
It provides an intuitive user interface based on HTML 5 for use on various devices, including mobile.
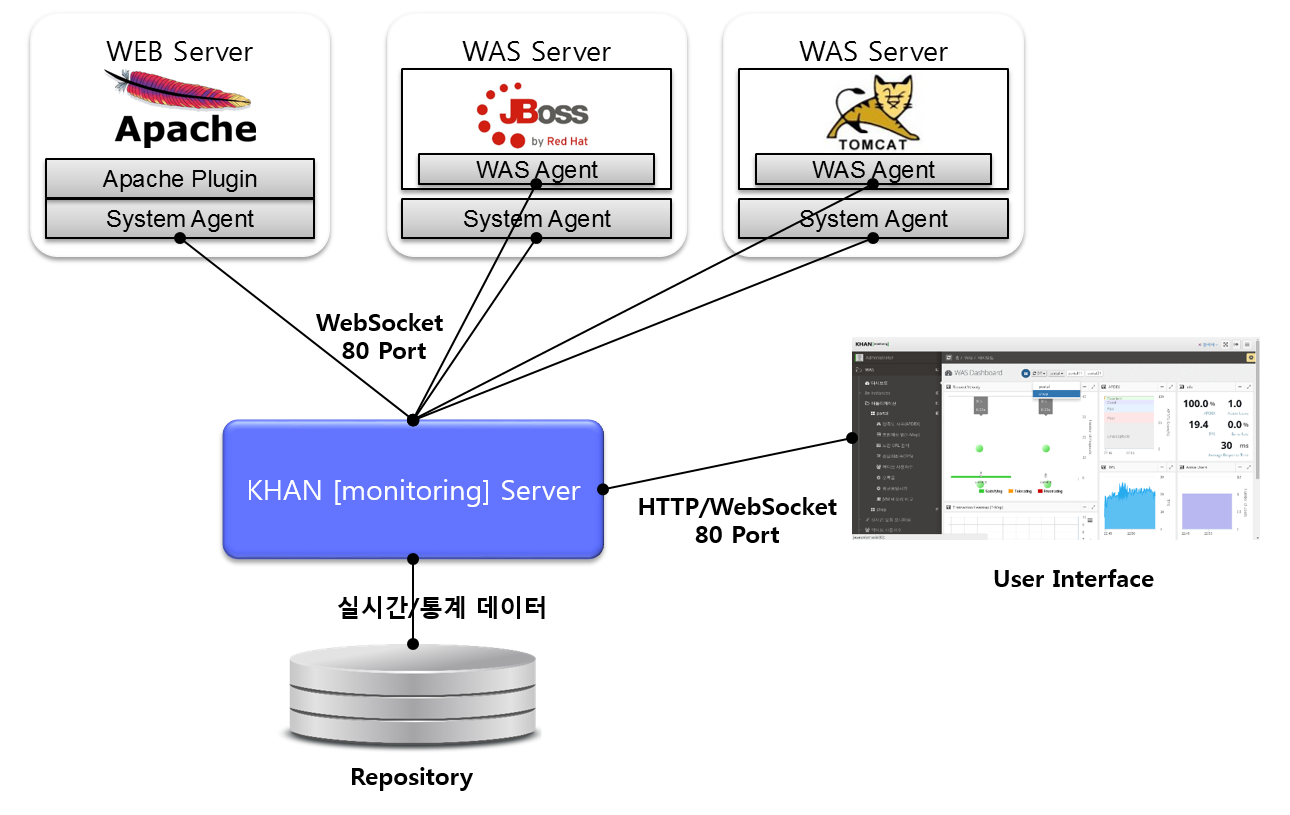
System Configuration
APM consists of WAS Agent to monitor Web Application Server (WAS) server and SYS Agent to monitor system status and web server status, APM Server to collect and process/store data, and HTML 5-based user interface (UI).
The web server includes the SYS Agent and the SYS Agent’s Apache web server plugin to monitor system information and web server status.
The WAS server installs the System agent for collecting system information and the WAS agent for monitoring WAS. Both the agent and the connection to the server use the WebSocket protocol.