2.2.2 Application by WAS Instance
User Satisfaction Index (APDEX).
-
Problems.
-
TPS, Response Time, Sessions There are so many numbers to look at, it’s hard to know what to look at.
-
Response Time numbers alone are meaningless without context.
-
Communication between IT and business is difficult.
-
User satisfaction with the system is unknown.
-
-
Solution.
-
Apdex can provide a numerical representation of user satisfaction with the application.
-
Multiple metrics can be expressed in a single number.
-
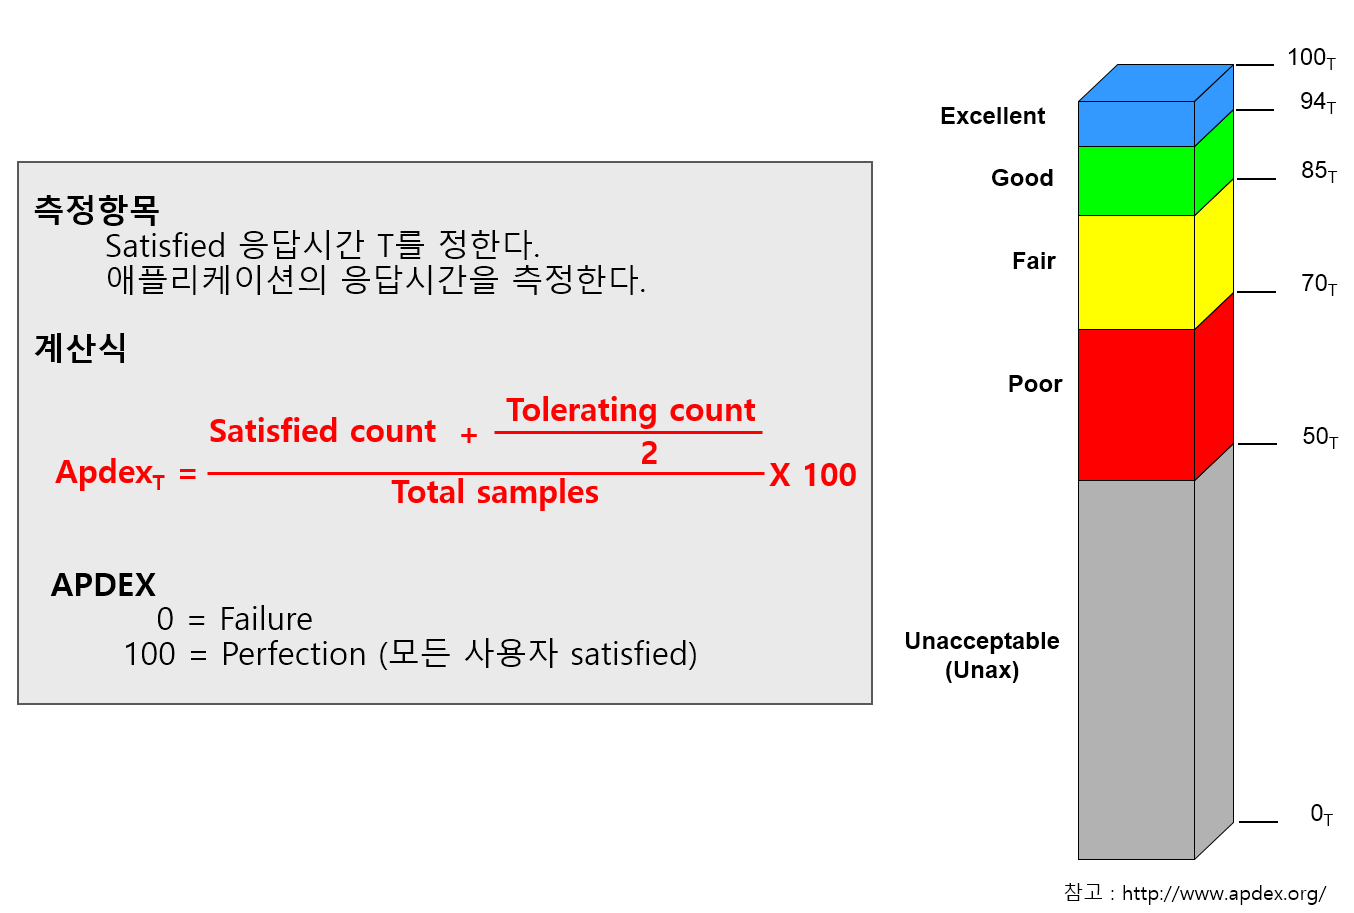
Application performance index can be expressed as a number from 0 to 100 for easy viewing.
-
OPENMARU APM calculates and displays the user satisfaction index (APDEX) by task and the user satisfaction index by instance.
It also displays pending requests according to the level of the user satisfaction index.
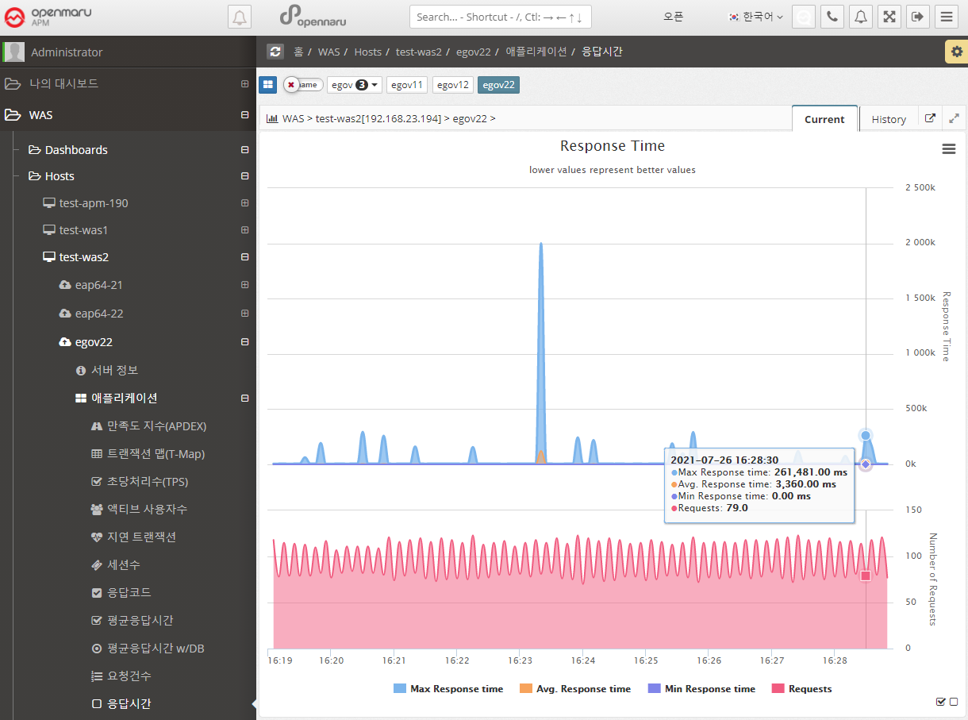
The response time to satisfy a user varies depending on the type and nature of the business system. You can specify the response time that satisfies the user in the WAS Agent’s configuration file.
Application > Satisfaction Index (APDEX)
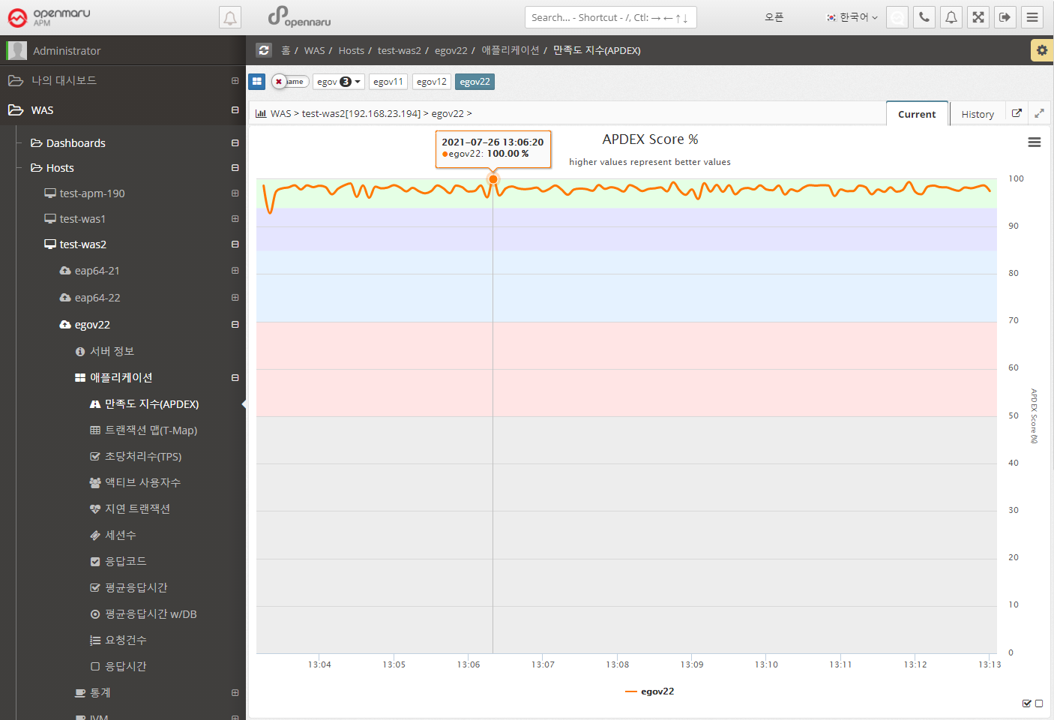
Displays the instance-specific user satisfaction index (APDEX). For the calculation method, see "3.4 What is APDEX?".
Application > Transaction Map (T-Map)
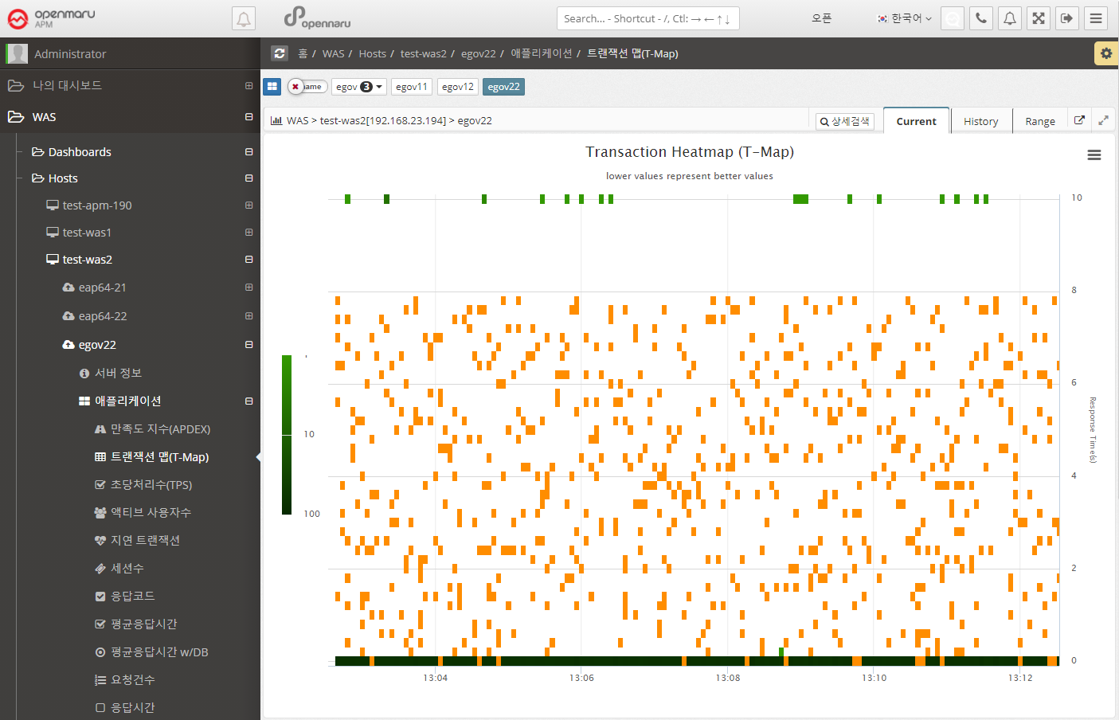
A chart that displays a scatter plot of user requests by response time per instance. Similar to the Transaction Map (T-Map) in the dashboard, you can drag the mouse to pop up the transactions that were executed at that time and analyze the detailed execution time.
For more information, see "APM Dashboard Screen Configuration - Transaction Heatmap (T-Map)".
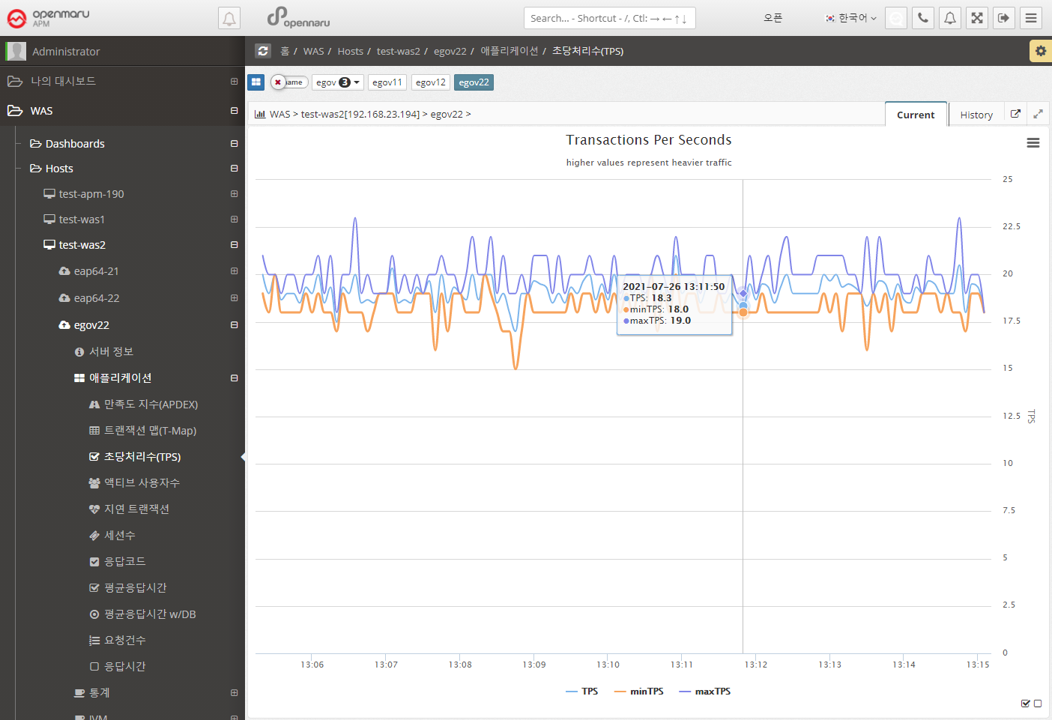
Applications > Transactions Per Second (TPS)
Displays a graph of the number of transactions per second per instance.
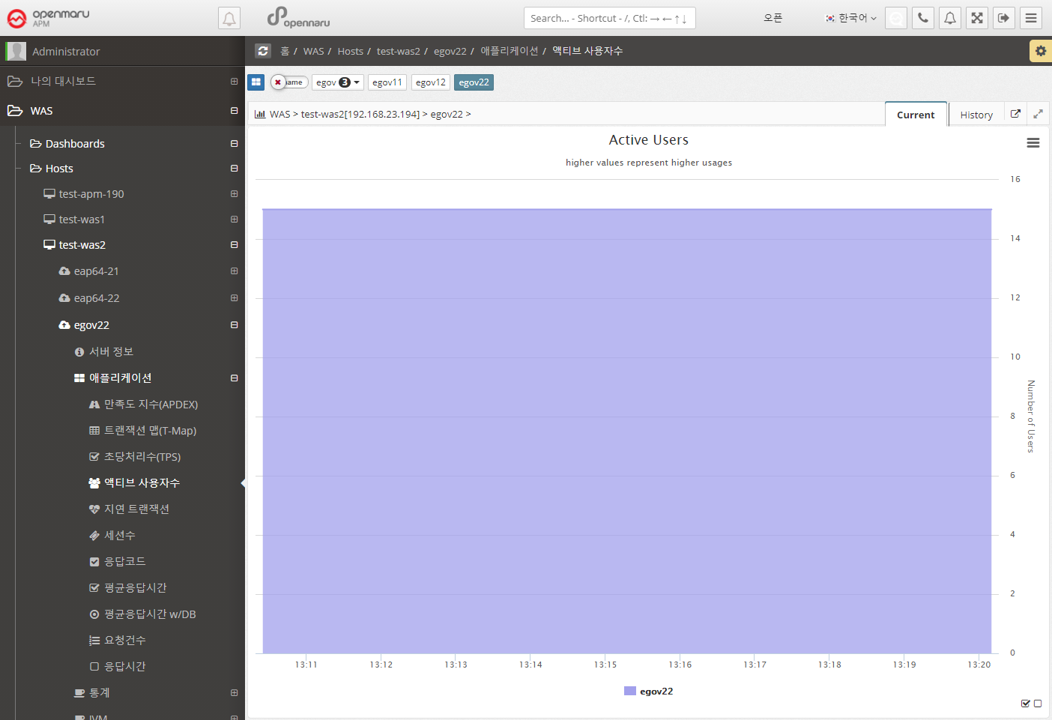
Application > Active Users
Displays the number of active users per instance in a graph. The number of active users uses cookies to identify unique users and is calculated by summing the number of users with unique cookie values who have sent requests within 5 minutes.
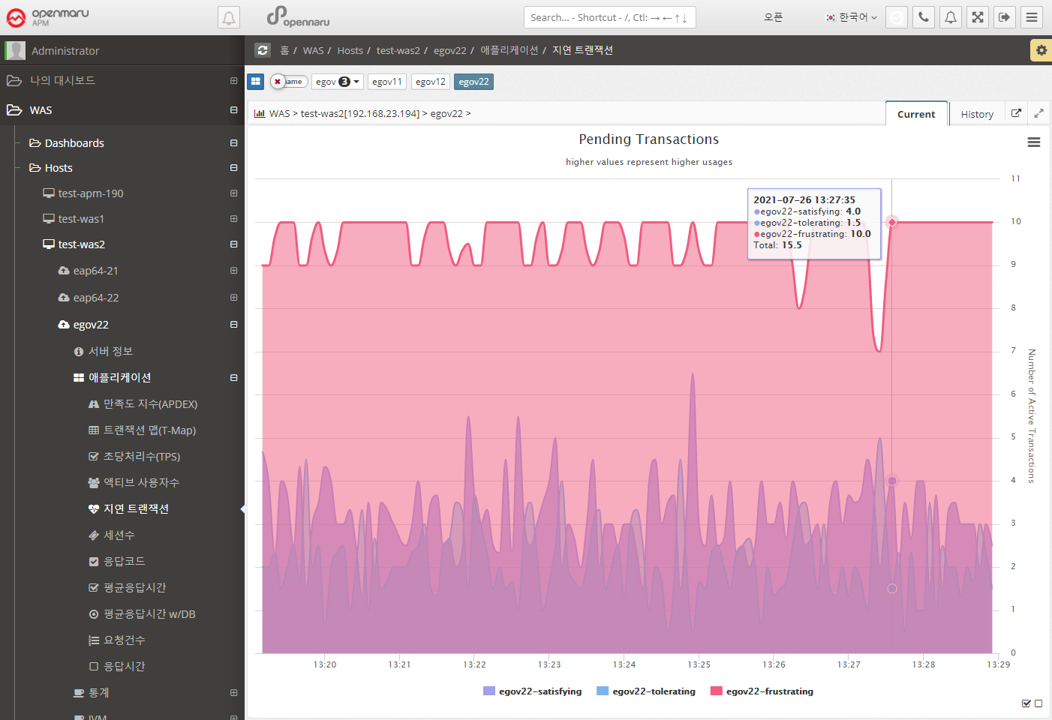
Applications > Lazy Transactions
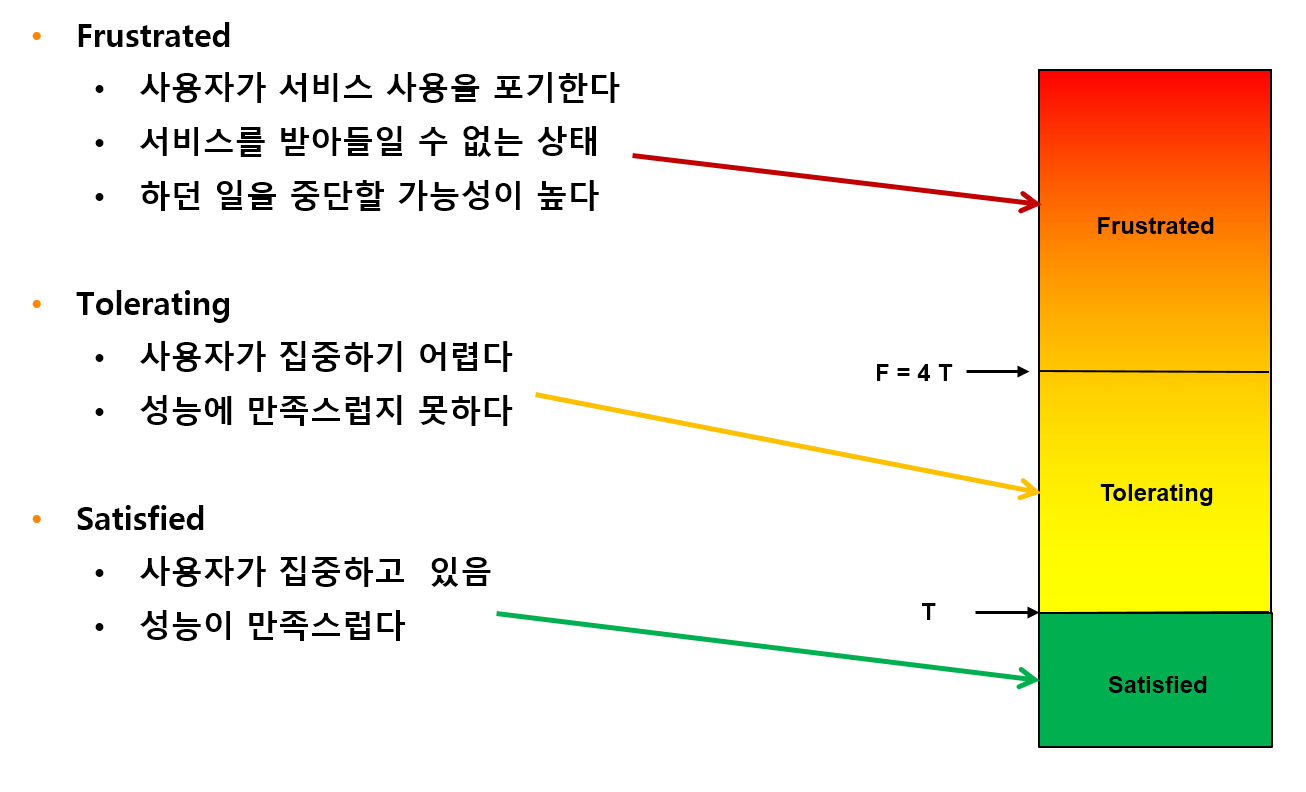
Displays the latency information of all WAS instances in the business system in the form of Satisfying, Tolerating, and Frustrating statistics.
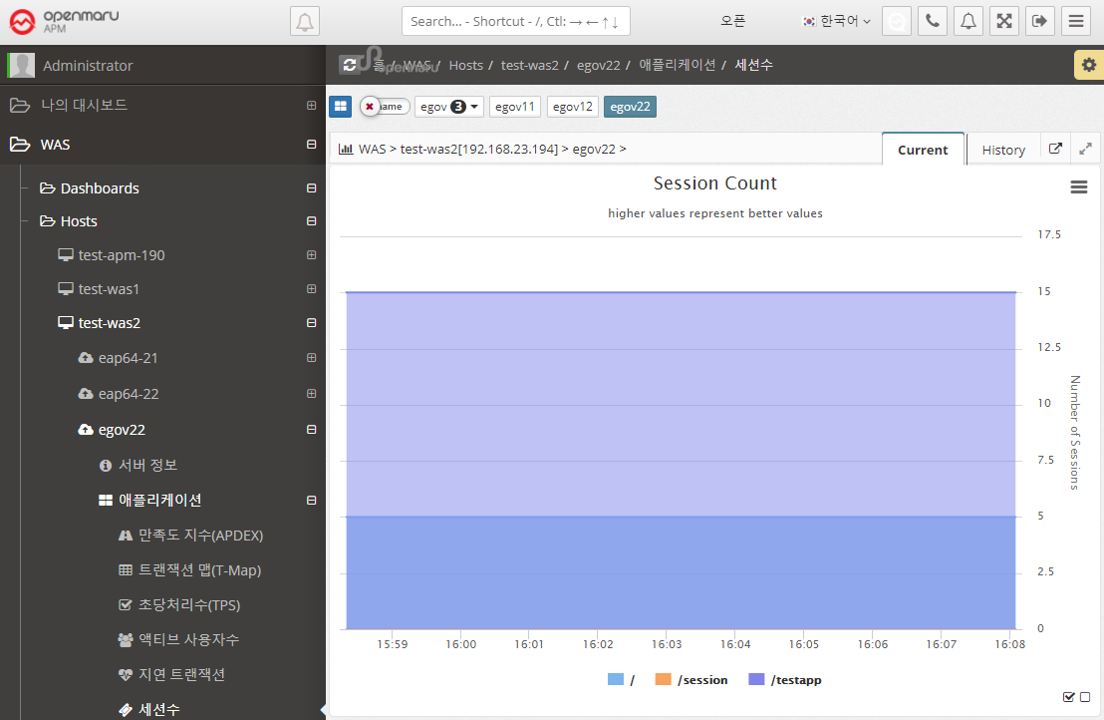
Application > Sessions
Graphically displays the number of sessions created in WAS per WAS instance, by web application context. Sessions in WAS are set by the session-timeout value in the application web.xml configuration file, as follows. The time unit is minutes.
<session-config>
    <session-timeout>30</session-timeout>
</session-config>
In the Sessions graph, you can see which applications are deployed in WAS.
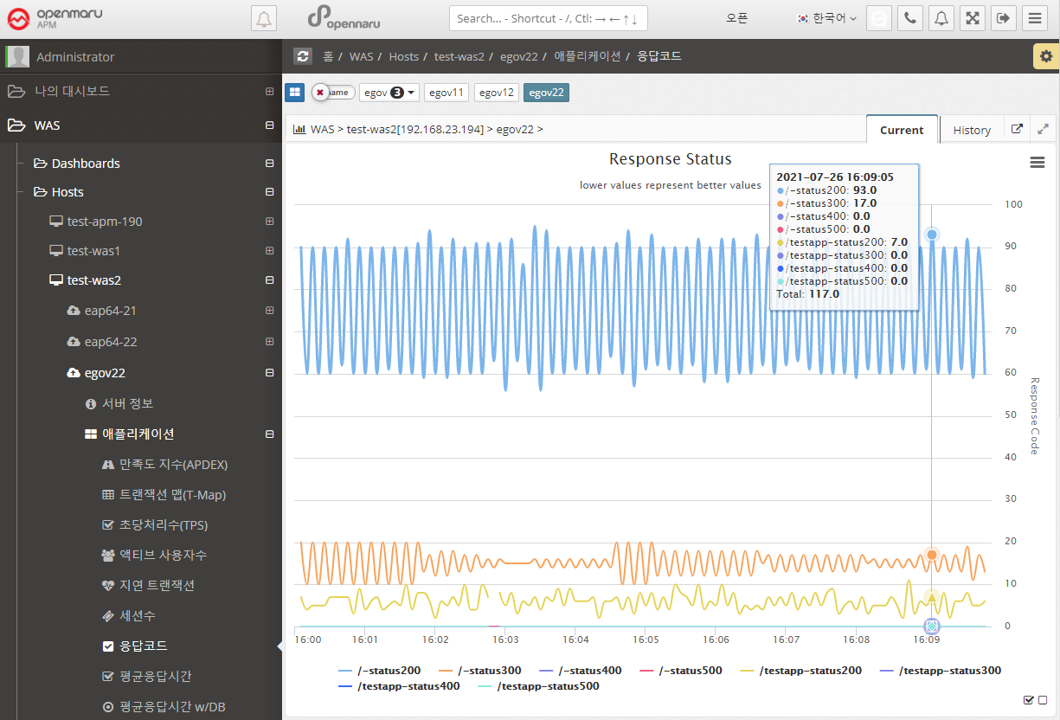
Applications > Response Codes
Summarize the number of HTTP Status response codes by WAS instance and application context by 20x, 30x, 40x, and 50x numbers and display the number in a graph.