2.4.2 DBMS Dashboard
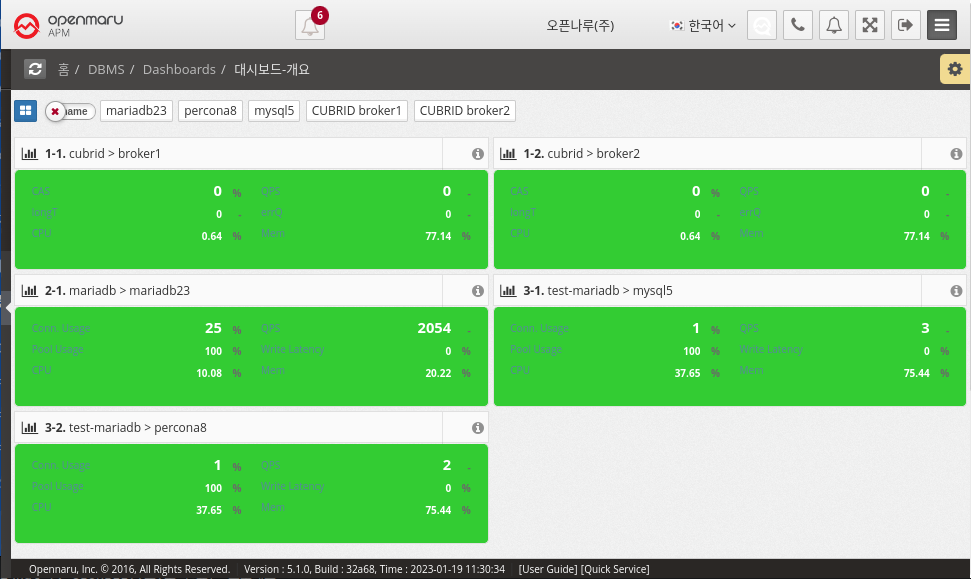
Dashboard - Overview
It collects information through MySQL (mysql, mariadb, percona) and CUBRID Plugin in System Agent on the machine where the database is installed or on an external machine. + MySQL How to Install System Agent MySQL
MySQL displays Connection Usage, QPS, Pool Usage, and Write Latency information, and CUBRID displays CAS, QPS, Long Transaction, and Error Queries on the dashboard screen. In the case of OS CPU and Memory, it is information of the machine where System Agent is installed, so it cannot be collected when monitoring a database in a remote location.
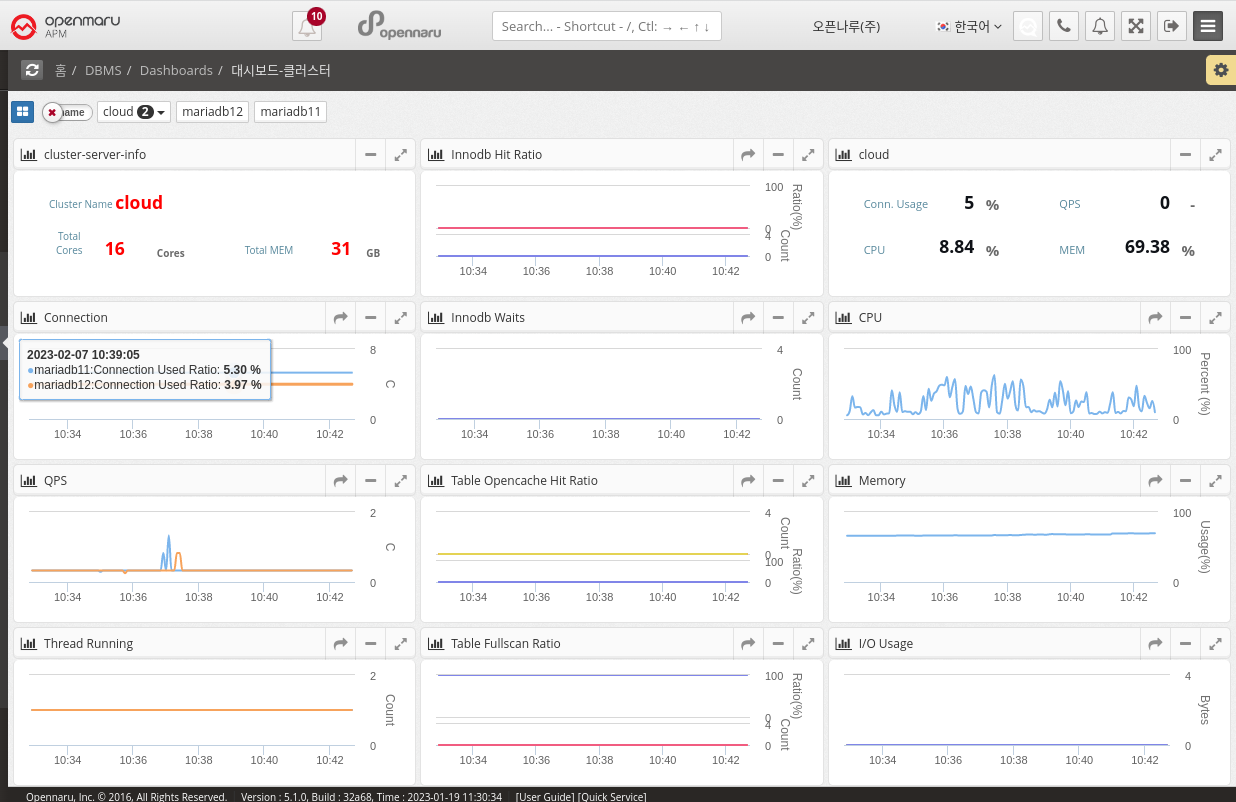
Dashboard - Clusters
This dashboard displays the monitoring items of a MySQL (mysql, mariadb, percona) Database cluster. Clusters can be grouped in the System Agent Mysql Plugin settings or customized in Application Group Management. Displays database cluster information and various metrics such as total resources and QPS on one screen. How to set up a user cluster