2.4.8 DBMS Monitoring : Table
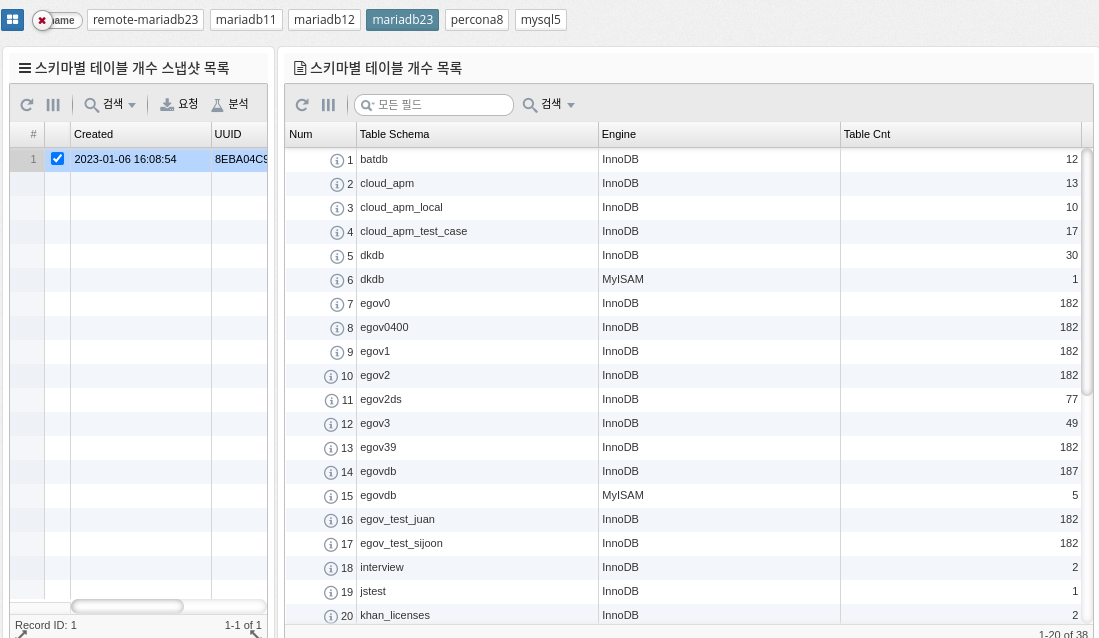
Fullscan ratio
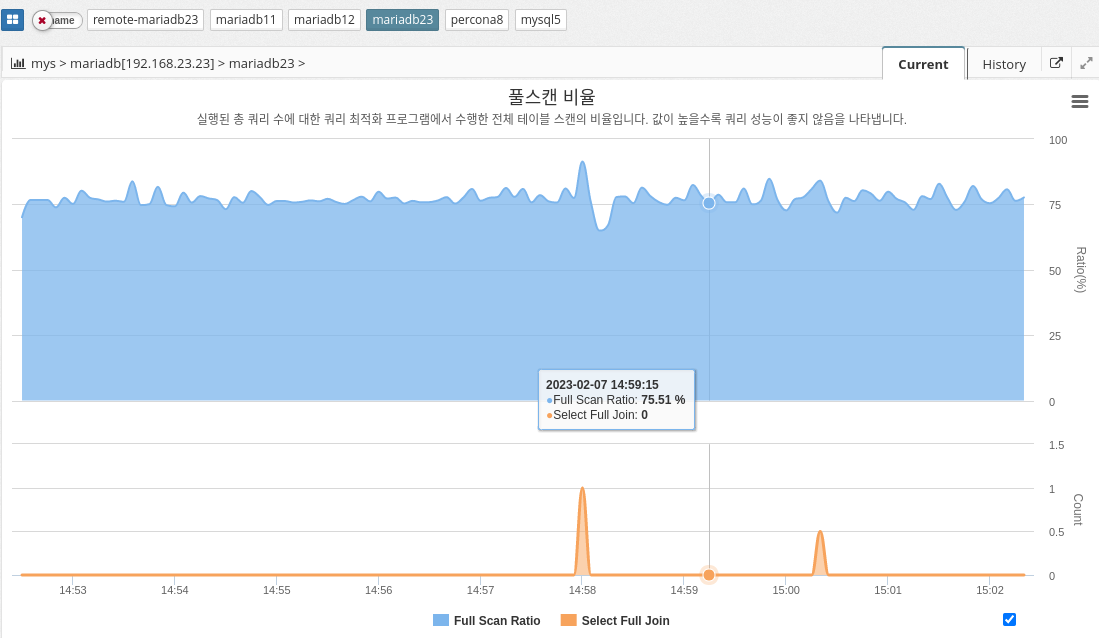
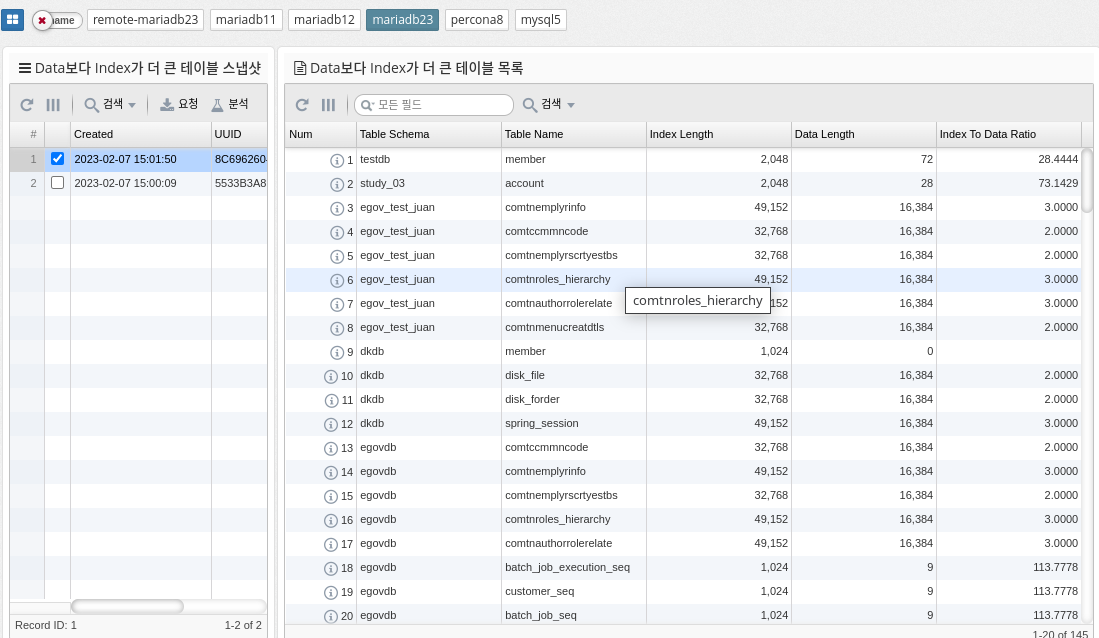
MySQL’s full-scan ratio indicates the percentage of times the database server scans the entire table instead of using indexes to retrieve data. A high full scan ratio indicates that the database is not using indexes efficiently, resulting in slow query performance.
To minimize the overall scan ratio, we recommend creating indexes on frequently used columns and building queries using the indexes. Optimizing indexes can significantly improve query performance because the database server can quickly find the desired data in the index instead of searching the entire table.
The parameter information used is shown below.
-
SELECT_FULL_JOIN
-
Calculation
(HANDLER_READ_RND_NEXT + HANDLER_READ_RND) / (HANDLER_READ_RND_NEXT + HANDLER_READ_RND + HANDLER_READ_FIRST + HANDLER_READ_NEXT + HANDLER_READ_KEY + HANDLER_READ_PREV) * 100.0");
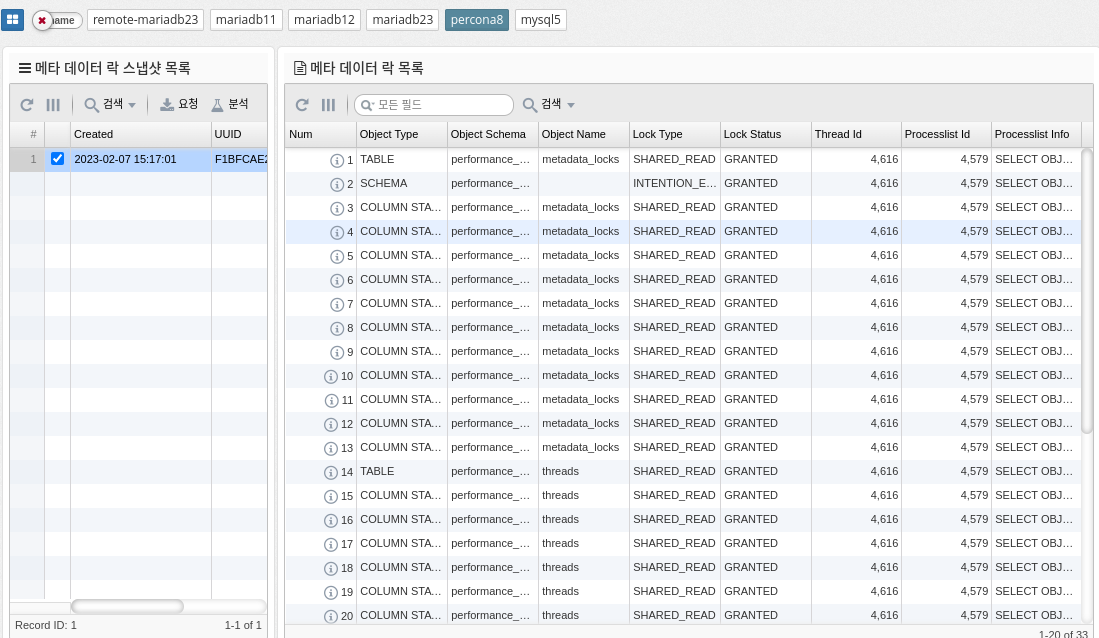
Lock wait count
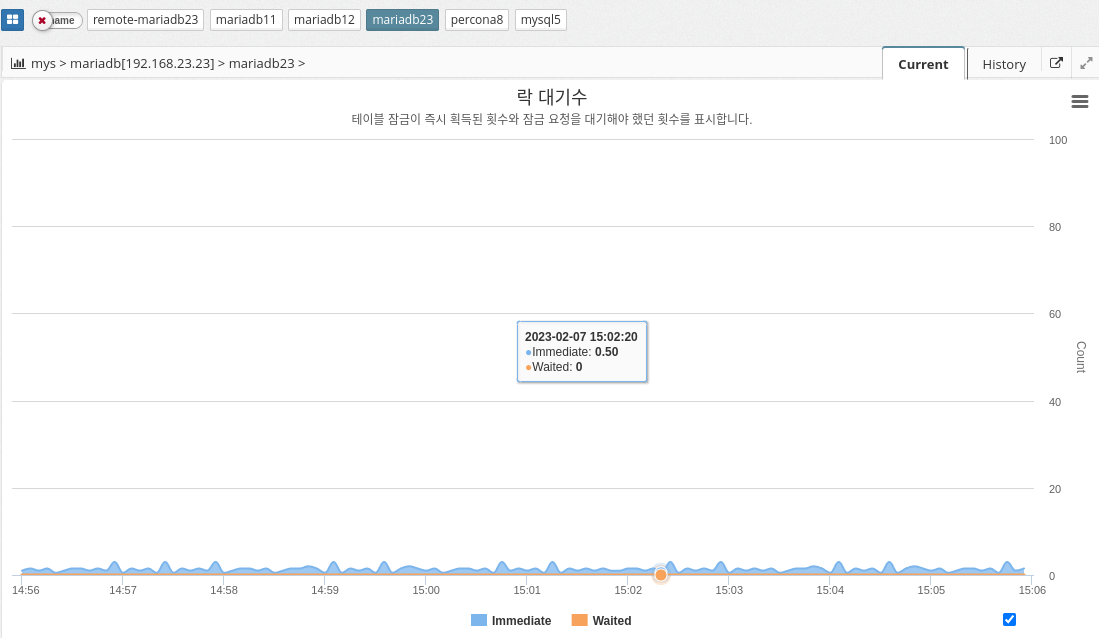
Immediate and waited are two performance metrics in the MySQL performance schema that show the number of table lock requests that are immediately authorized and the number of table lock requests that must wait to be unlocked, respectively.
IMMEDIATE reflects the number of lock requests that were immediately granted because the table was not locked or the lock was immediately available. This metric indicates the performance of the locking mechanism and the overall load on the server. A large number of immediate lock grants can indicate a well-tuned server that handles a large number of requests.
On the other hand, waited reflects the number of lock requests that have to wait for a lock to be released. This metric can indicate the presence of lock contention, where multiple queries are trying to access the same table at the same time and one must wait for the others to complete. A high value of waited can be an indicator of poor performance and may indicate that the database is not optimized for high concurrent usage.
In summary, these two metrics provide important information about the performance of MySQL’s locking mechanism and can be used to identify potential bottlenecks or problems in the system.
The parameter information used is shown below.
-
TABLE_LOCKS_IMMEDIATE: Number of table locks acquired immediately.
-
TABLE_LOCKS_WAITED: Number of table locks waited for.
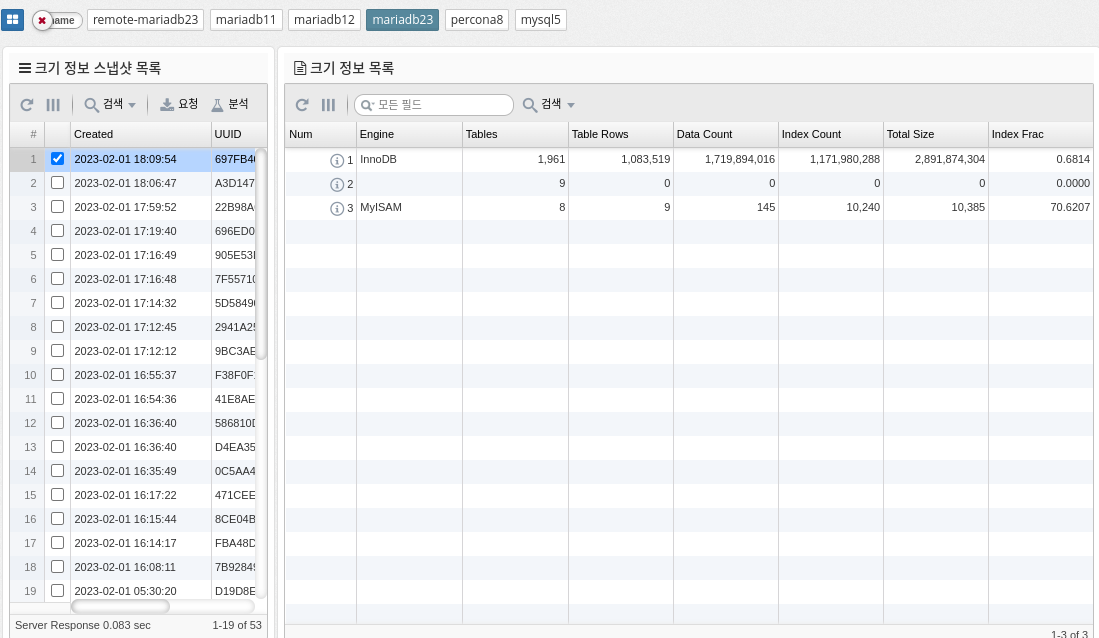
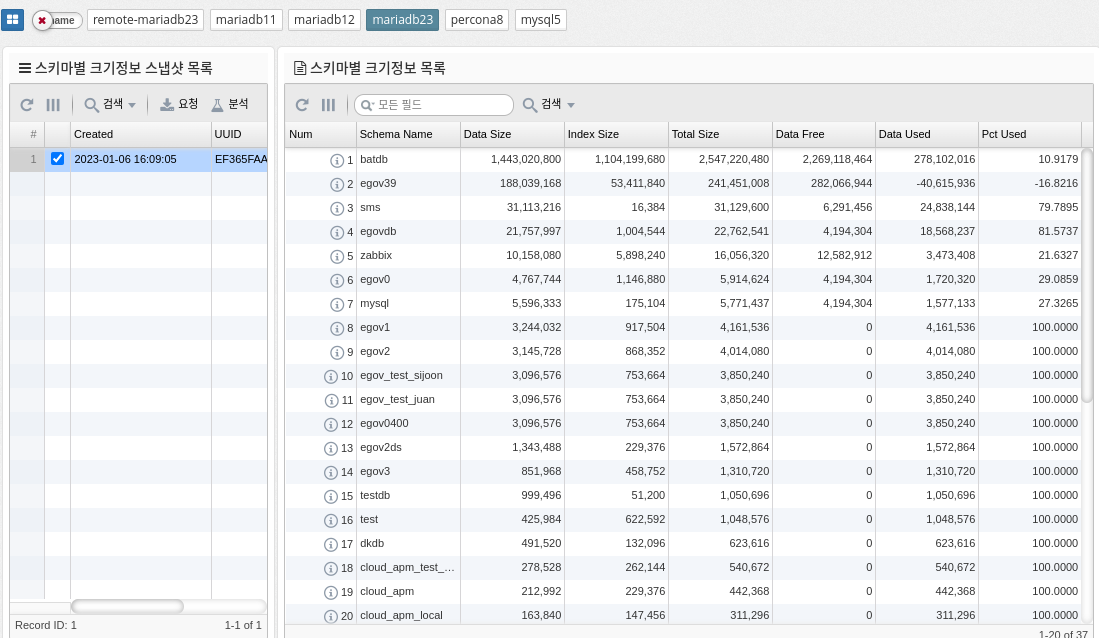
Tmp Disk Utilization
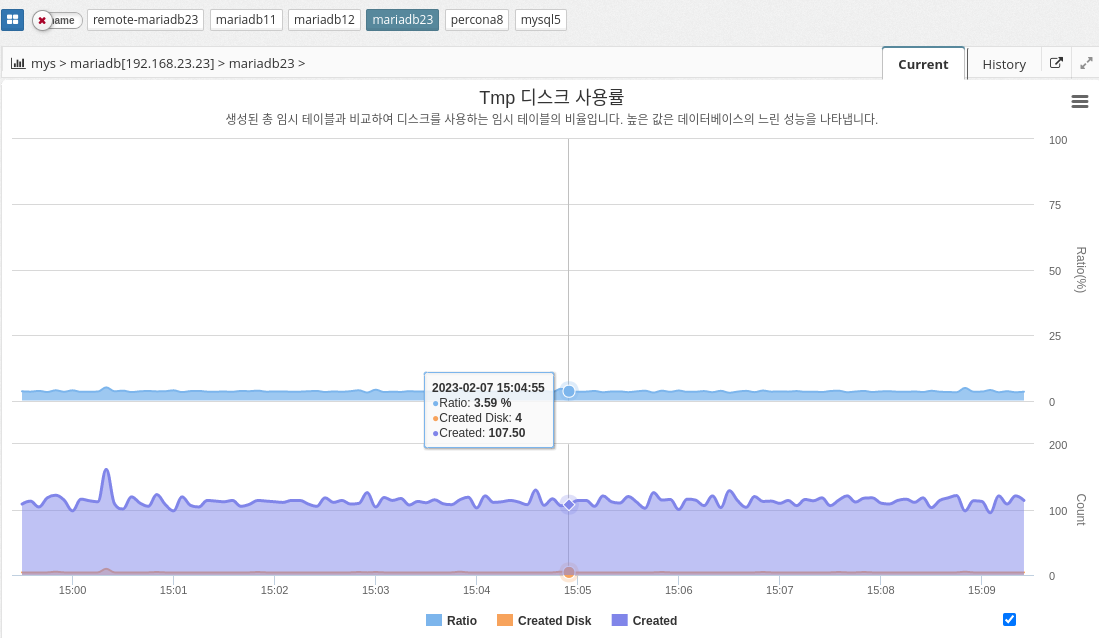
The tmp disk percentage in MySQL indicates the percentage of disk space used for temporary storage compared to the total disk space available to the database server. This temporary storage is used to store intermediate results during complex queries and is also used to sort and group data.
CREATED_TMP_TABLES is a performance metric in MySQL that indicates the number of temporary tables created on disk rather than in memory. The value of this metric is an indicator of how much temporary disk space the MySQL server is using. A high value for CREATED_TMP_TABLES indicates that the MySQL server is running out of memory and needs to use temporary disk space to store temporary tables.
The parameter information used is shown below.
-
CREATED_TMP_TABLES: The number of temporary tables created in memory.
-
Calculation
CREATED_TMP_TABLES / QUERIES * 100