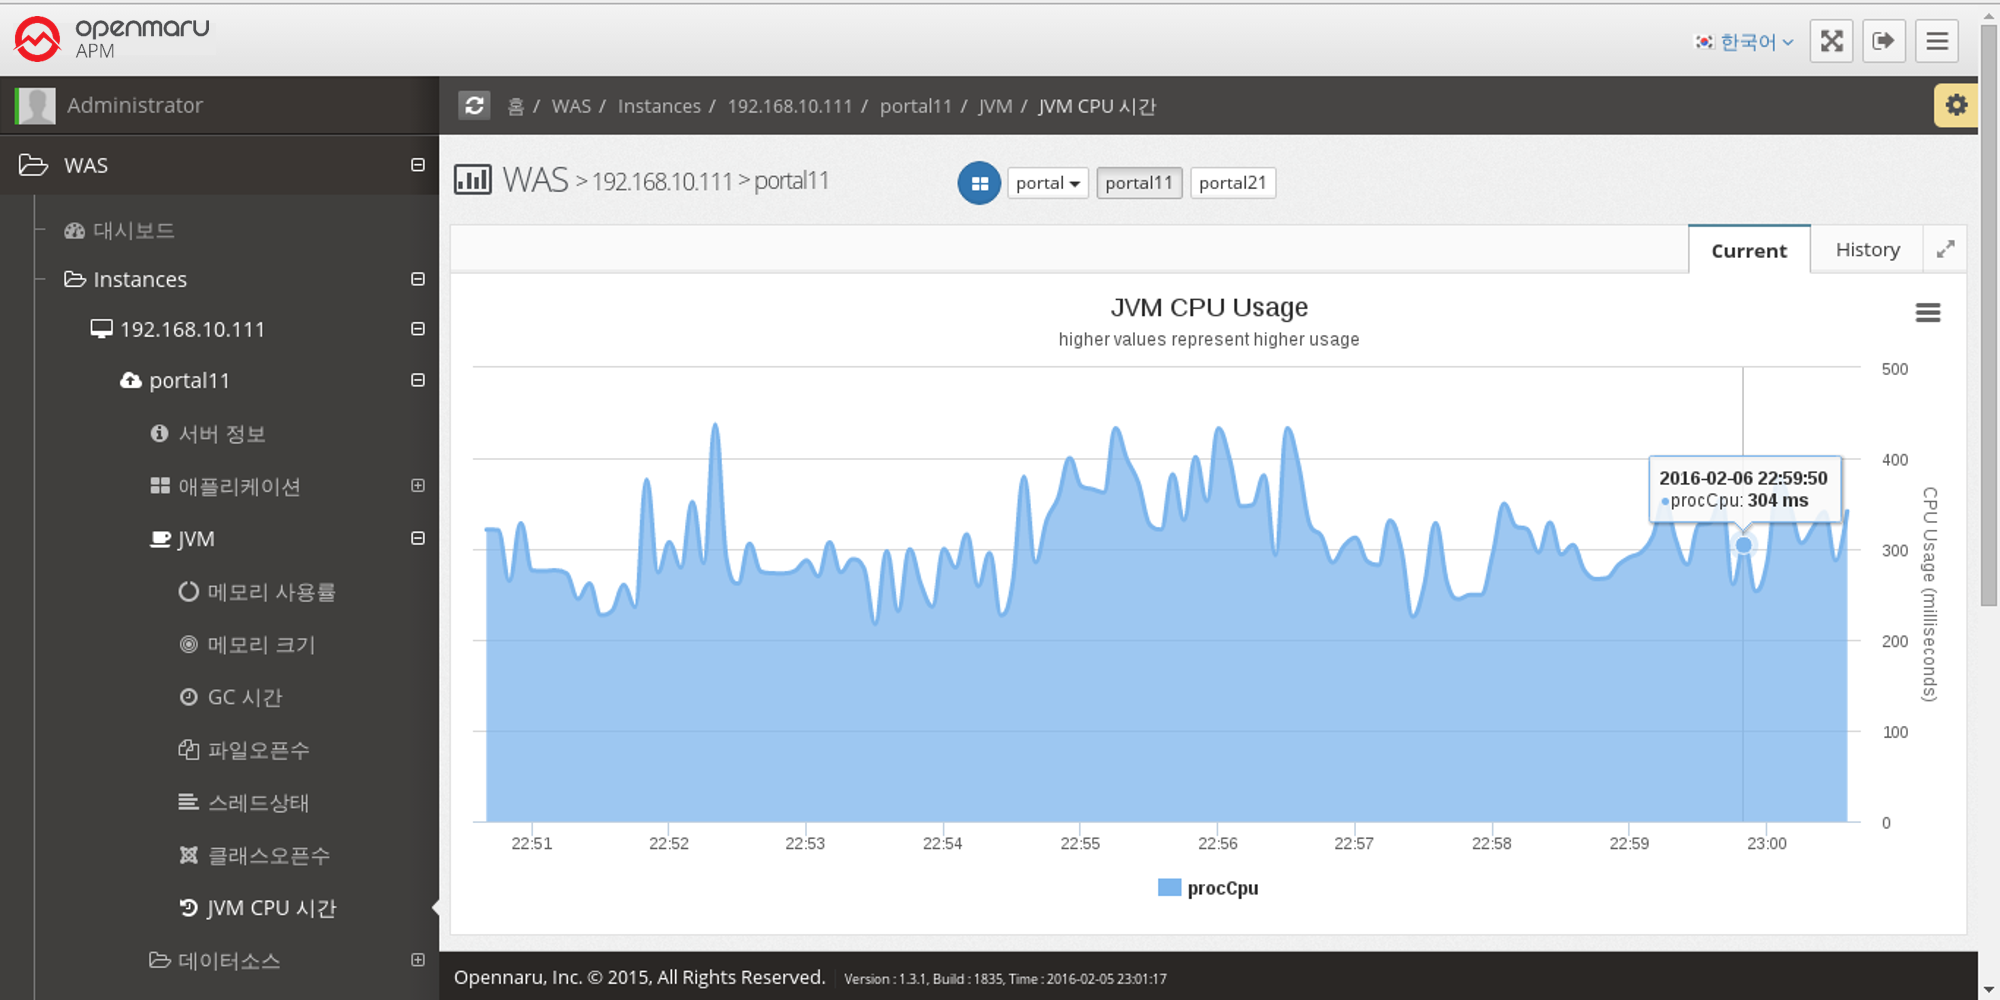
2.2.4 JVM by WAS Instance
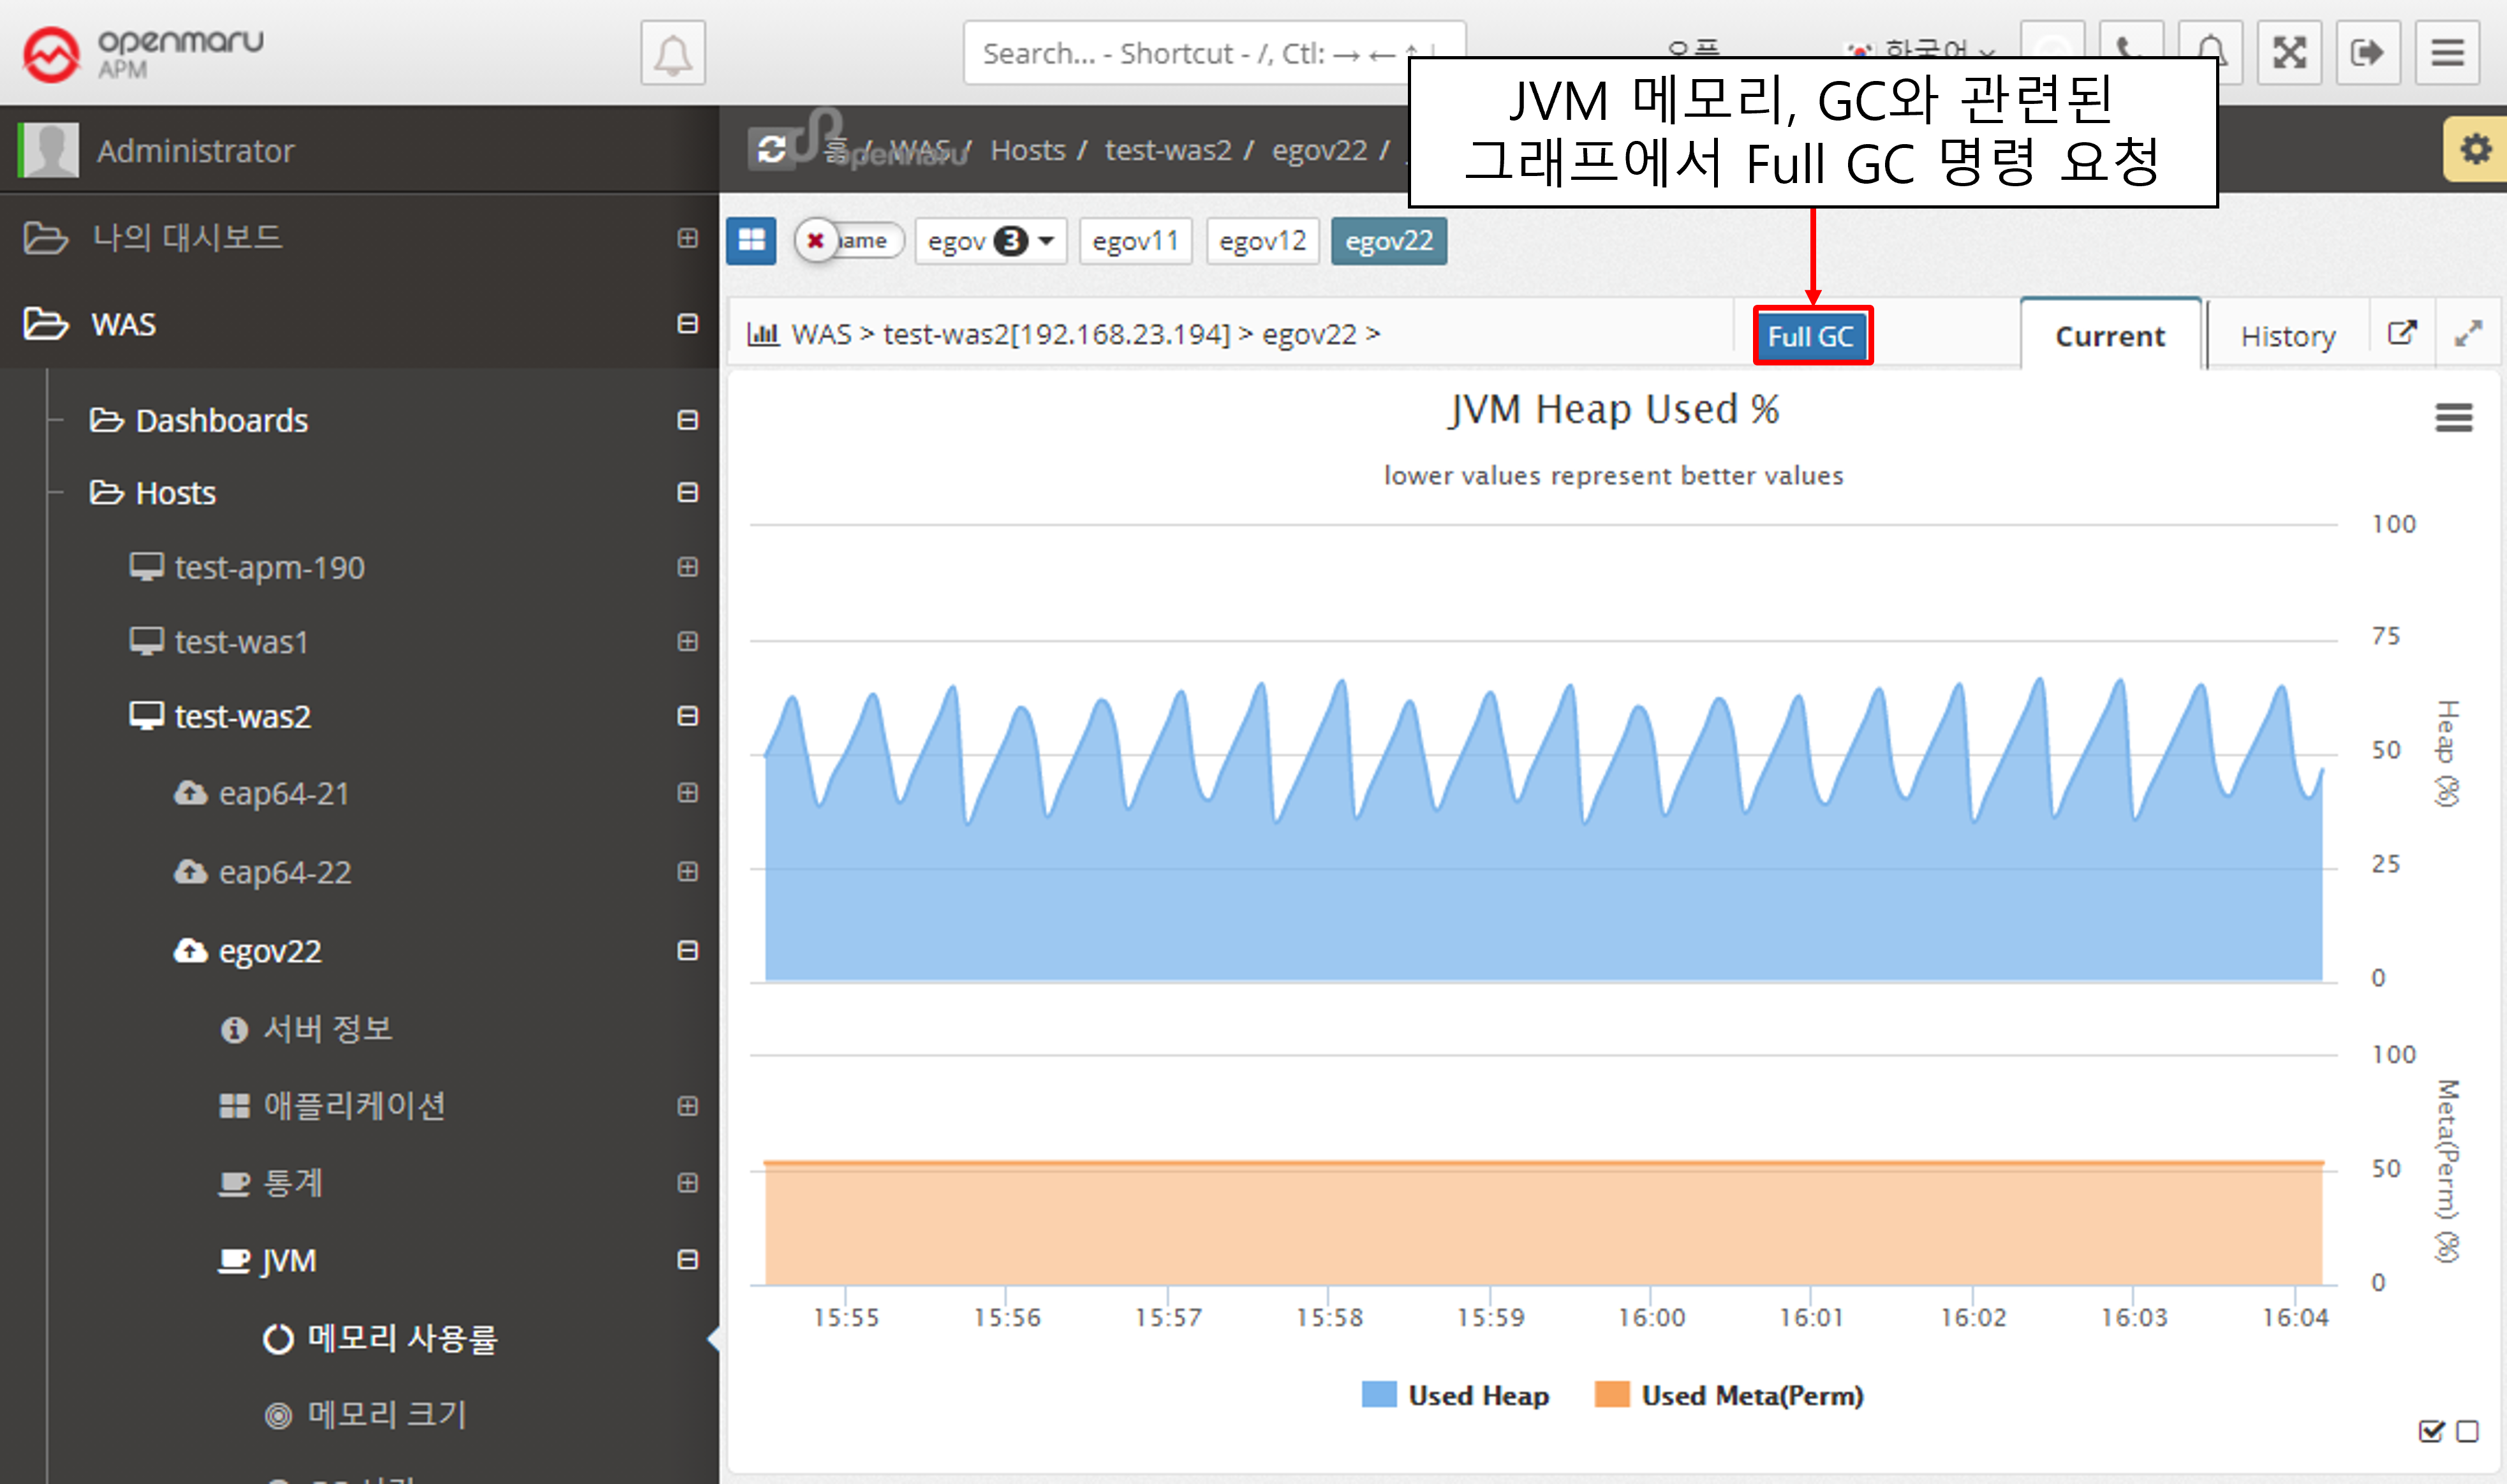
JVM > Memory Utilization
Displays the WAS instance memory utilization (%). The top graph shows the Heap utilization of the JVM, and the bottom graph shows the utilization of the Perm area.
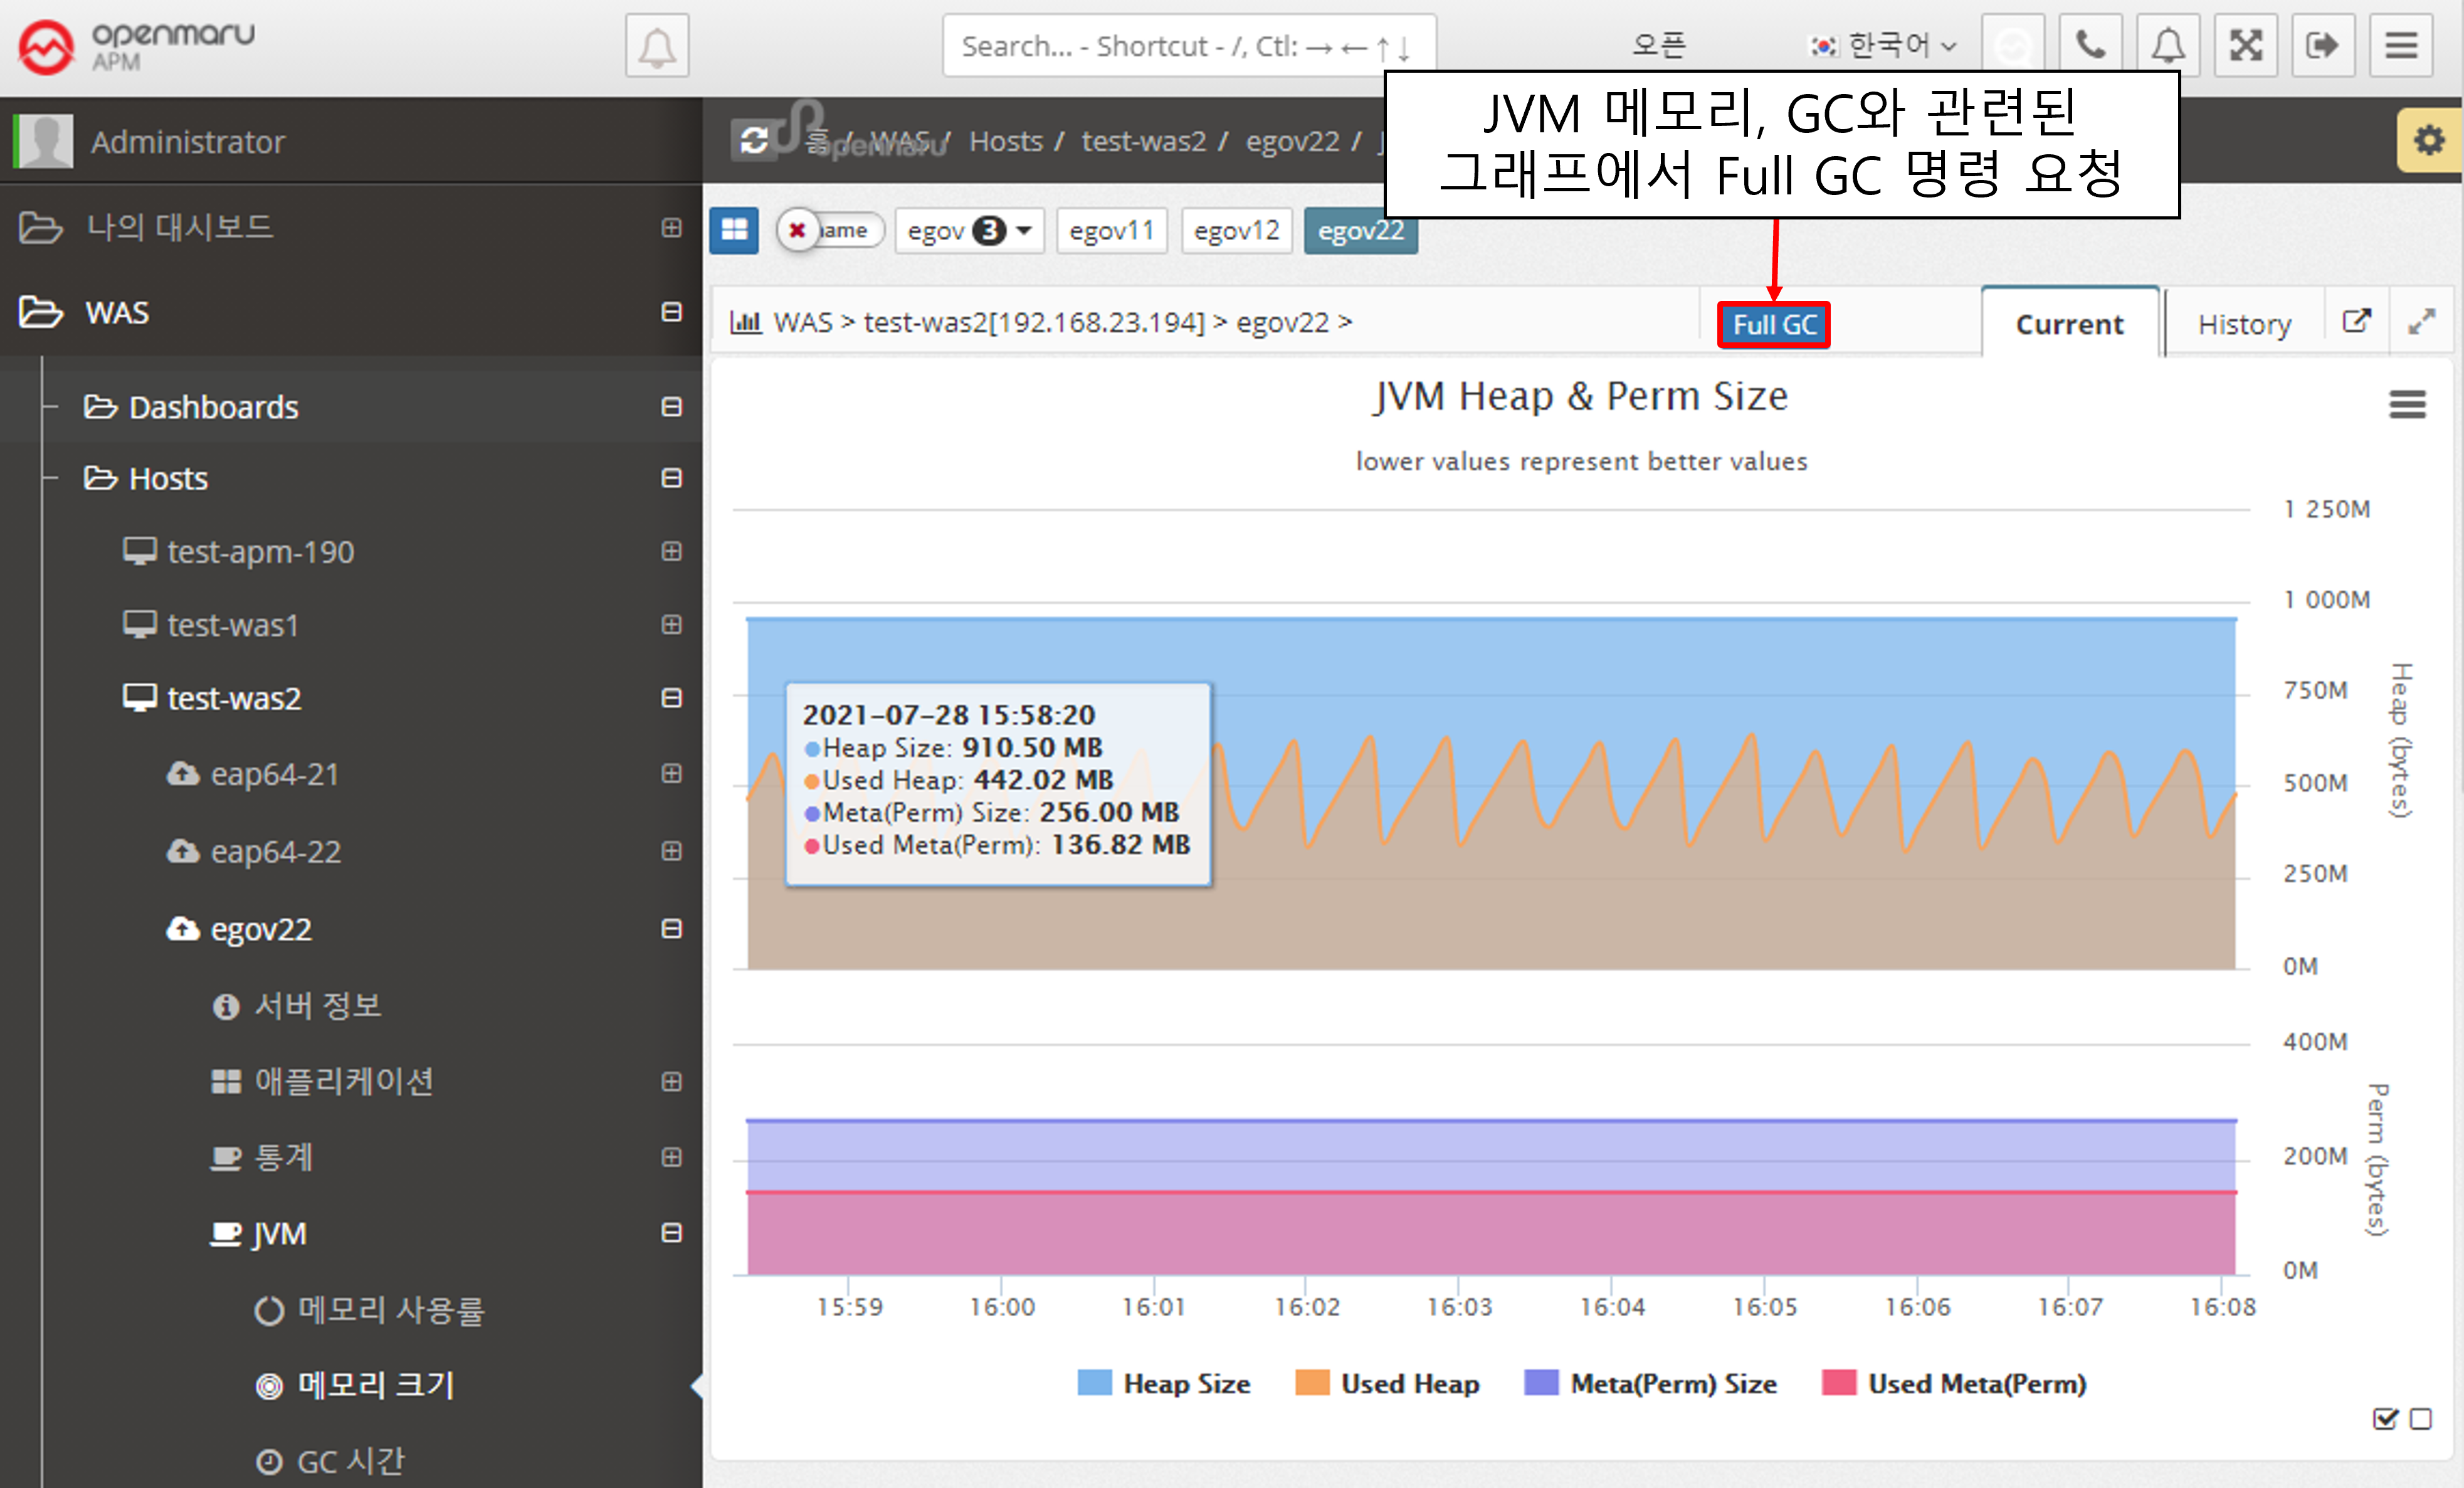
JVM > Memory Size
Displays the memory size of the WAS instance JVM. It shows the maximum value and the current usage in bytes. Heap usage is shown at the top and Perm usage at the bottom.
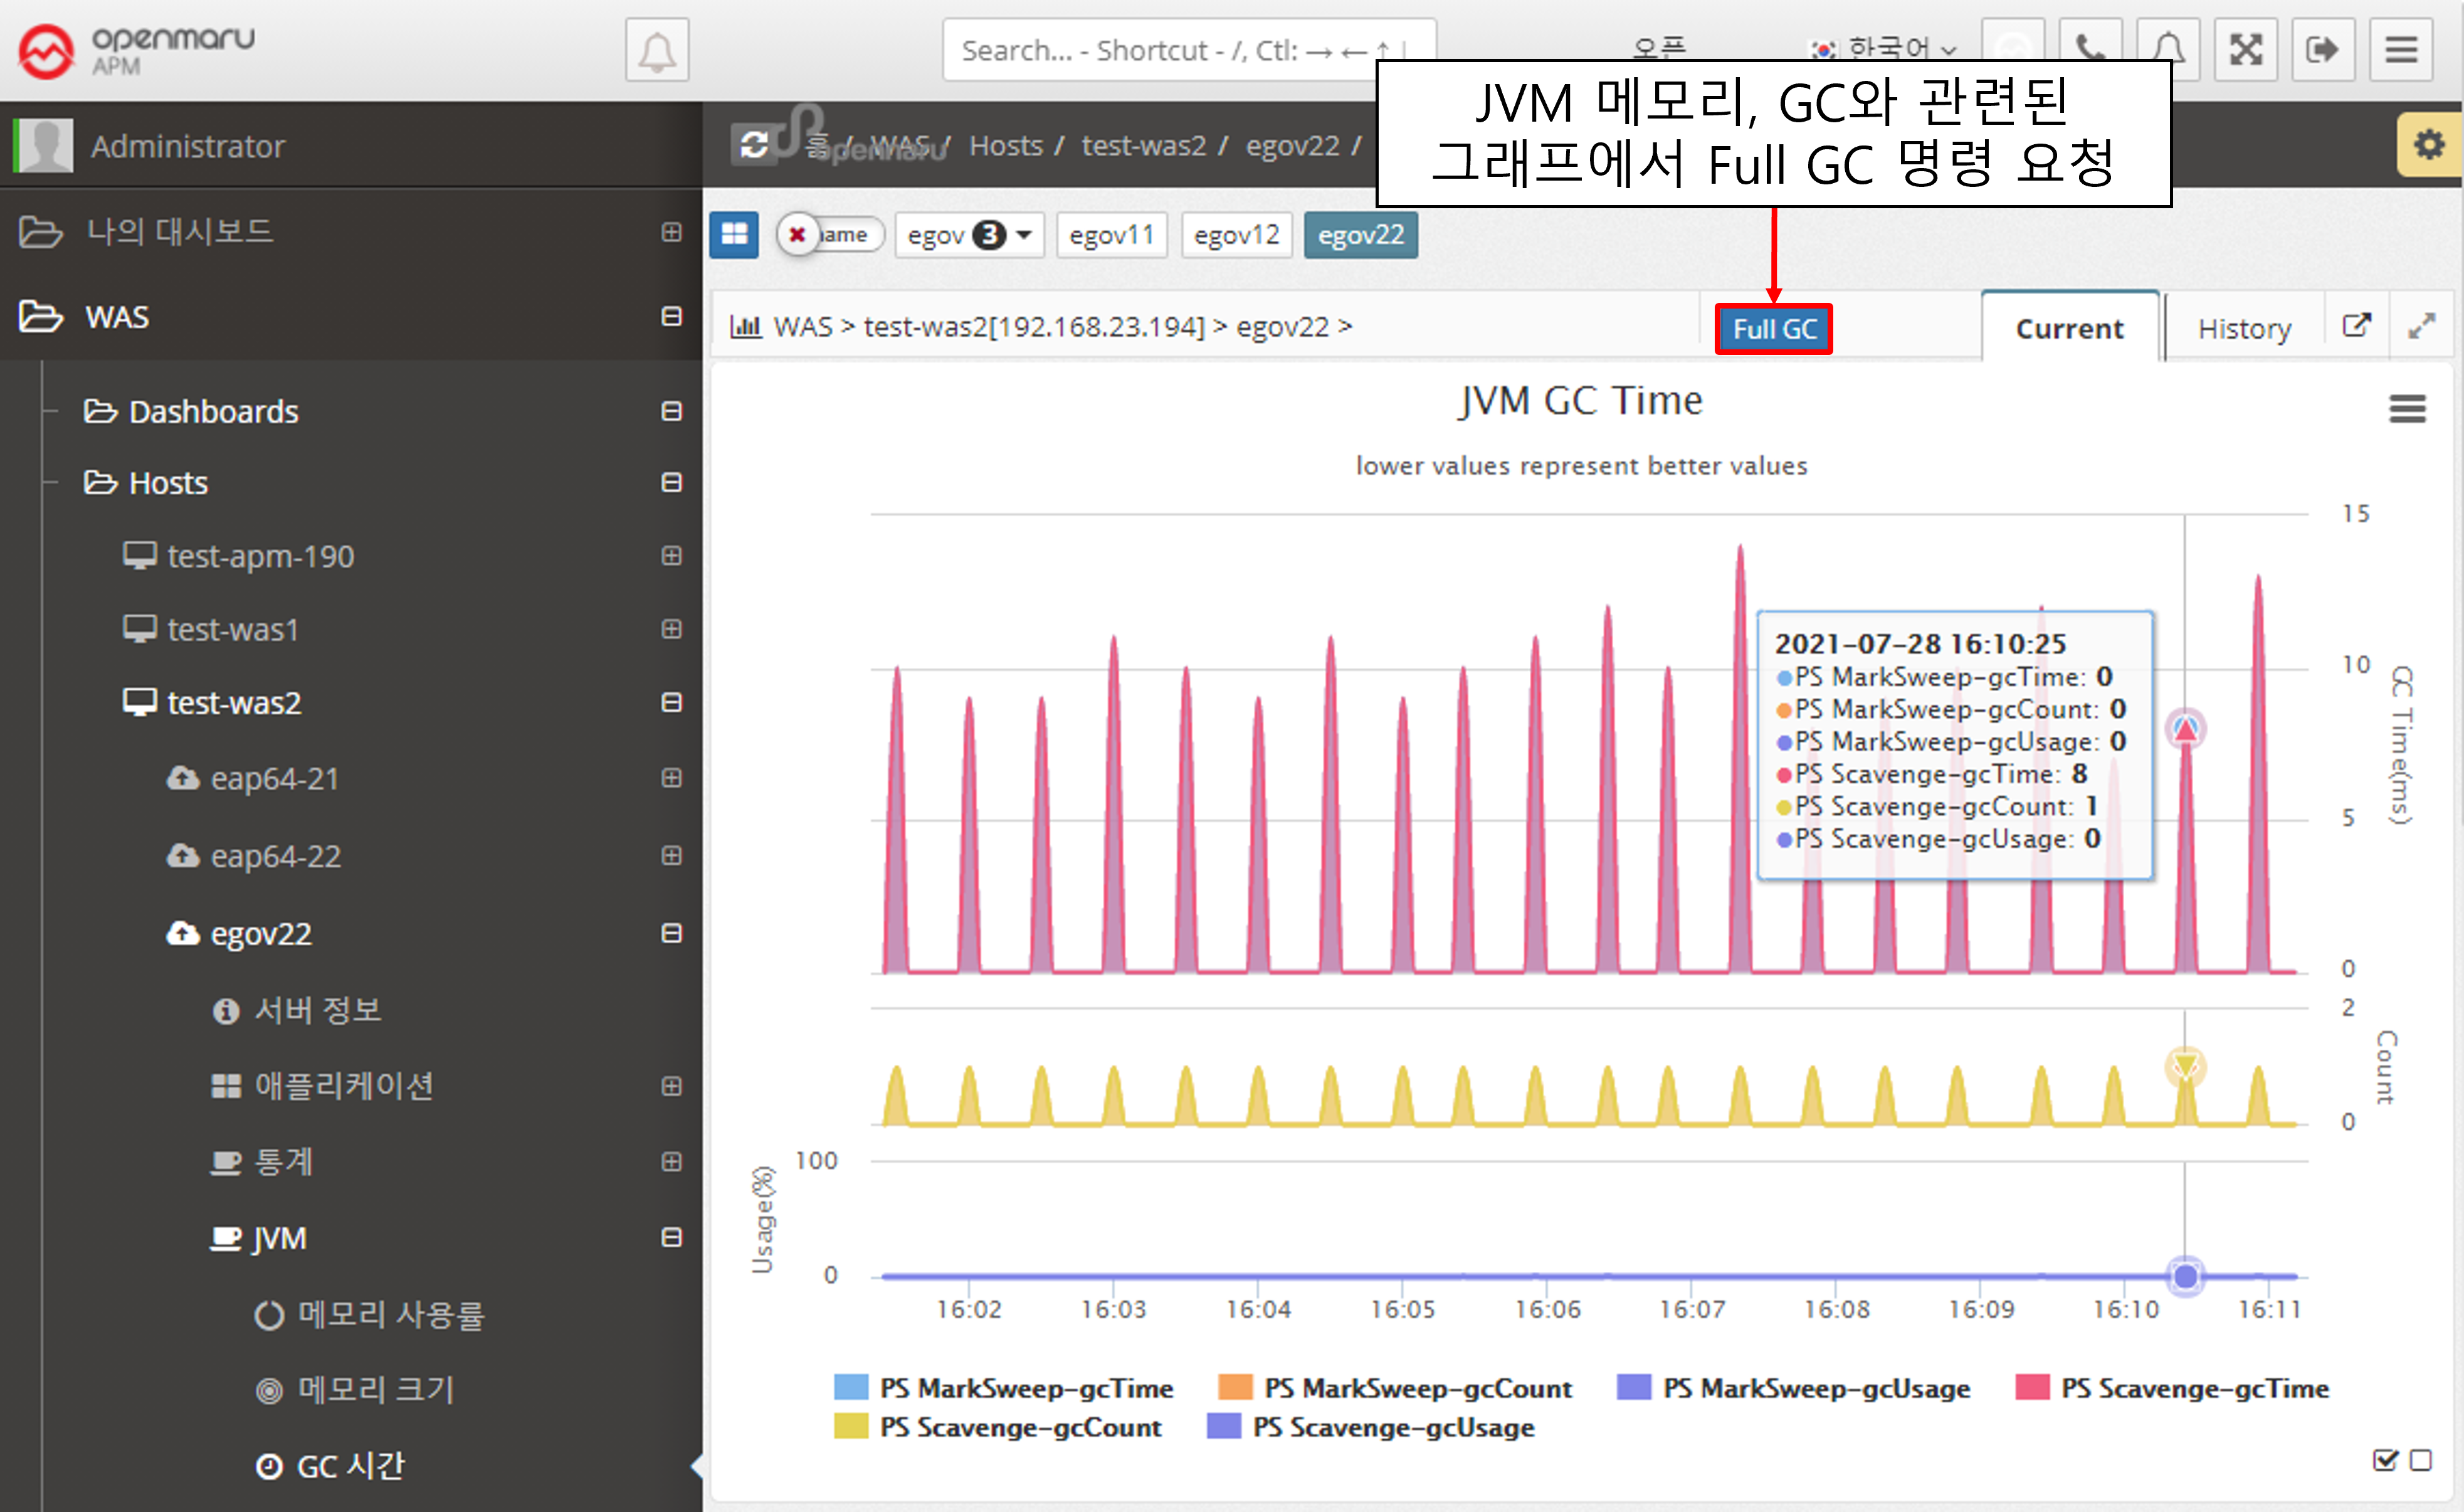
JVM > GC Time
Displays the GC status of the WAS instance JVM. The top line shows the time spent on GC, and the bottom line shows the number of GCs. Minor GC and Full GC are displayed separately.
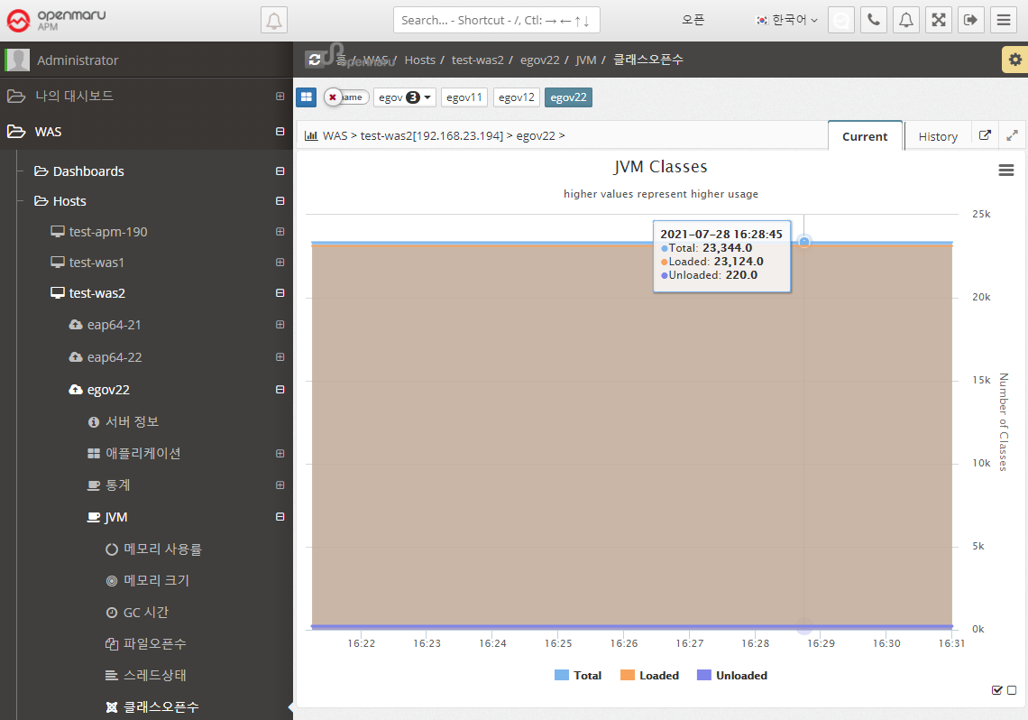
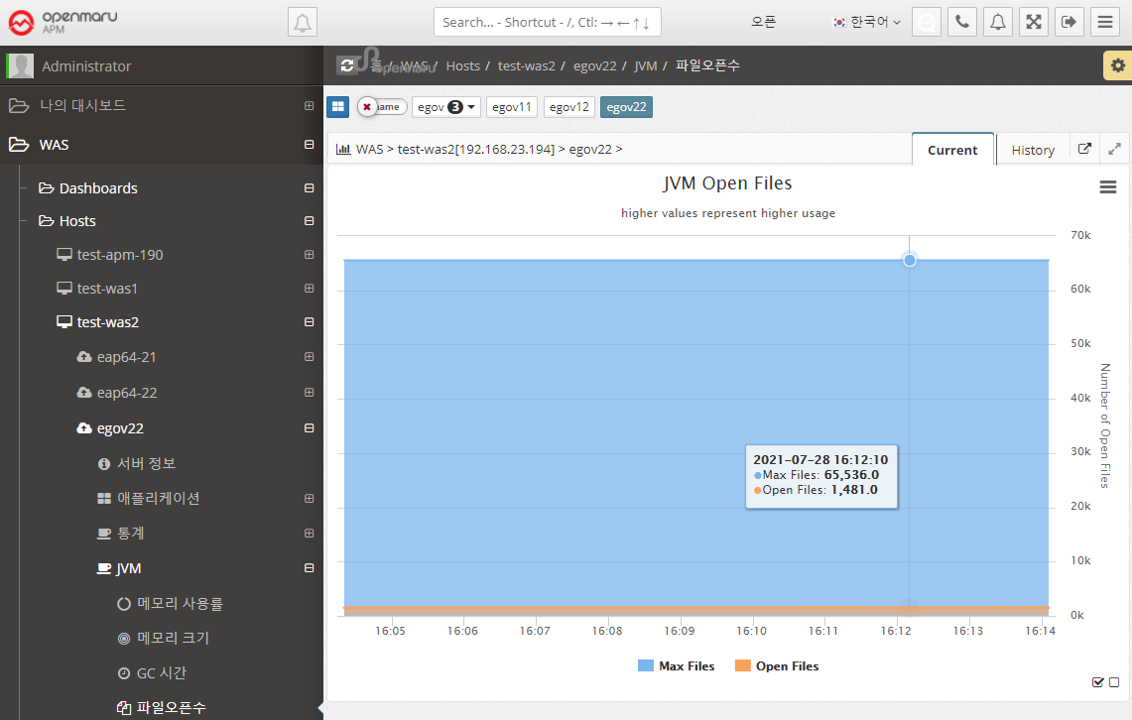
JVM > File Open Count
Displays a graph of the number of files opened in the WAS instance. It shows the maximum number of files that can be opened and the number of files that are currently open. To analyze which files are open, see Analyzing Open Files per WAS Instance.
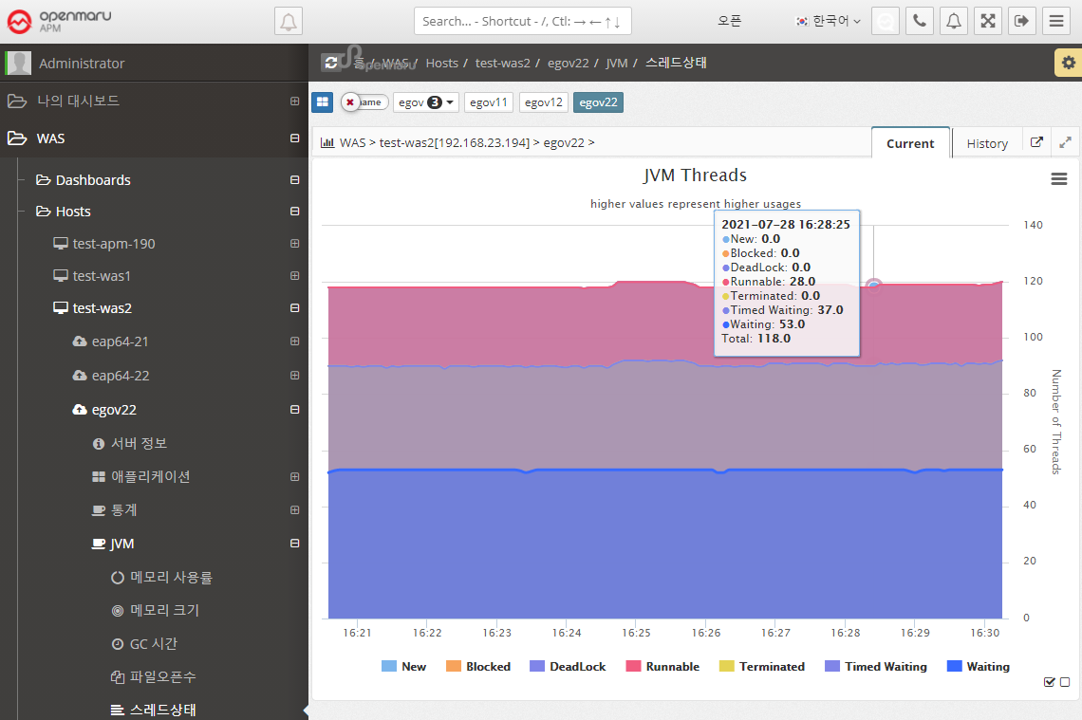
JVM > Thread State
Displays the status of the WAS instance’s threads in a graph. Expresses the status of Java threads such as New, Blocked, DeadLock, and Runnable. If a deadlock occurs, an Alert is raised to notify you that a deadlock has occurred.