2.2.3 Statistics by WAS Instance
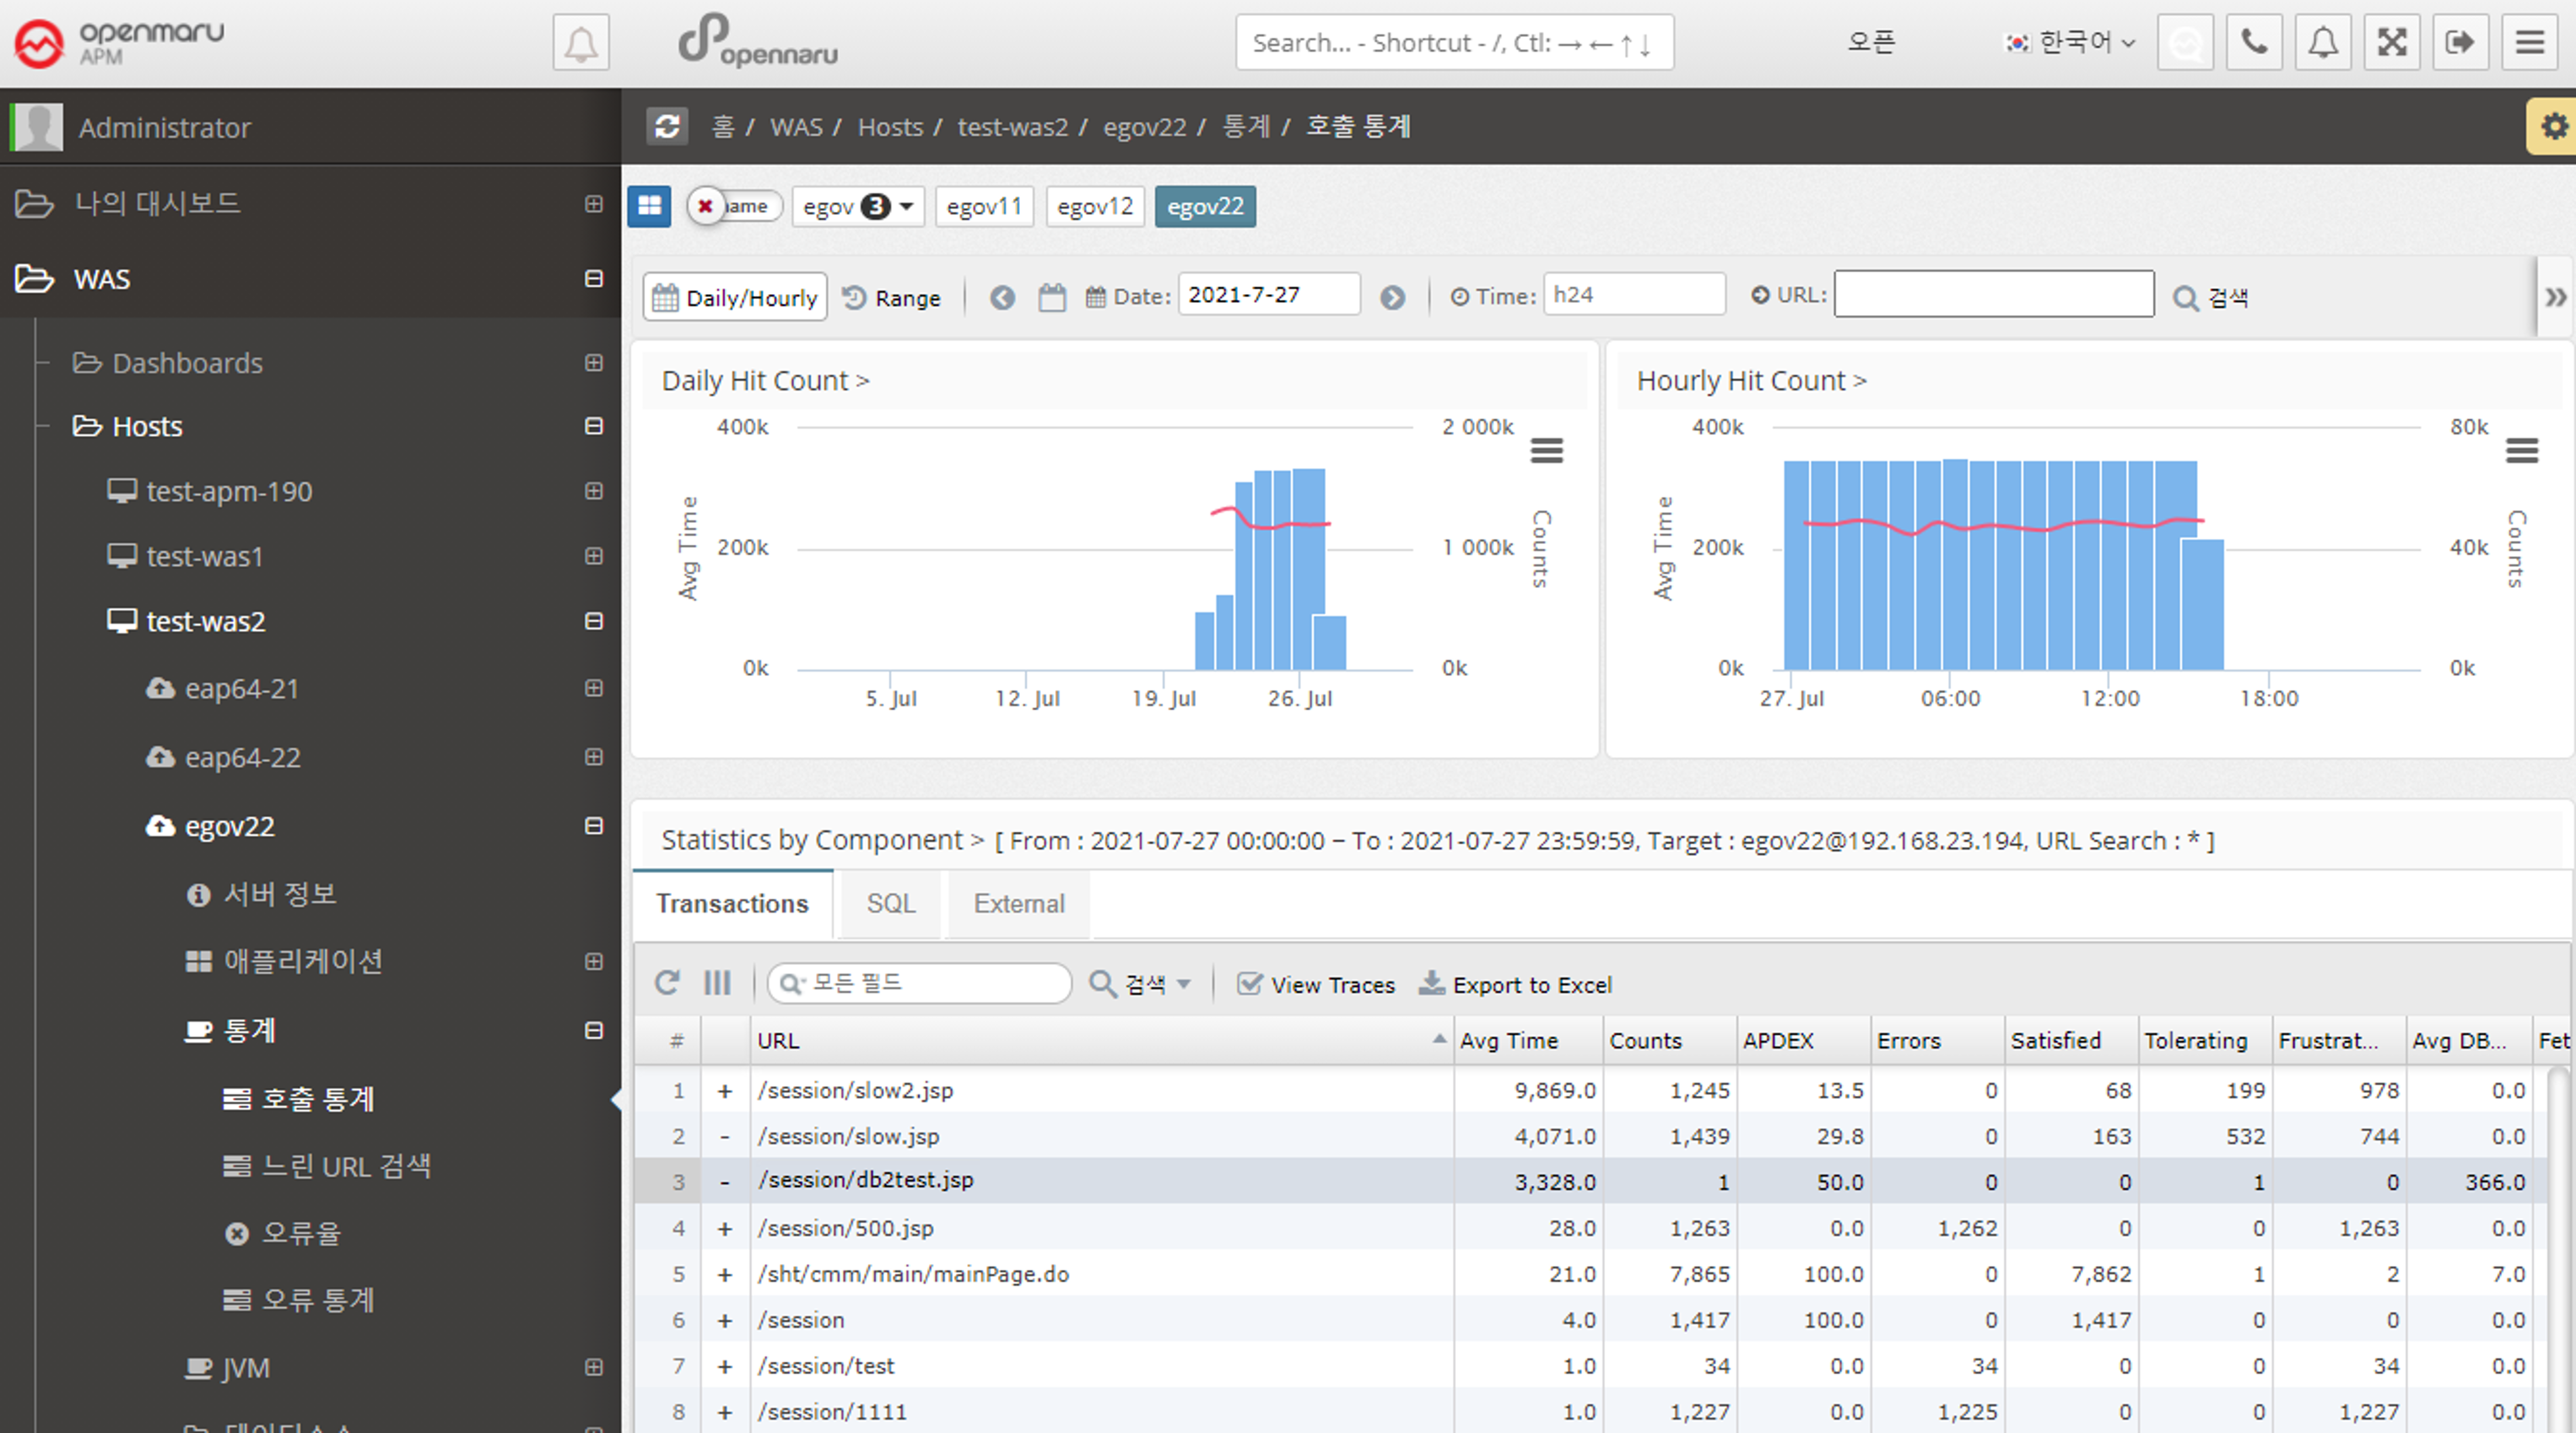
Statistics > Call Statistics
Displays the number of URL calls, SQL query executions, and external calls using HTTP Client by day and hour.
-
When a date is selected as 'Daily/Hourly', the number of daily and hourly calls for the month is displayed in a graph with the APDEX index.
-
Displays the URLs with the slowest average response time on that day in a list at the bottom.
-
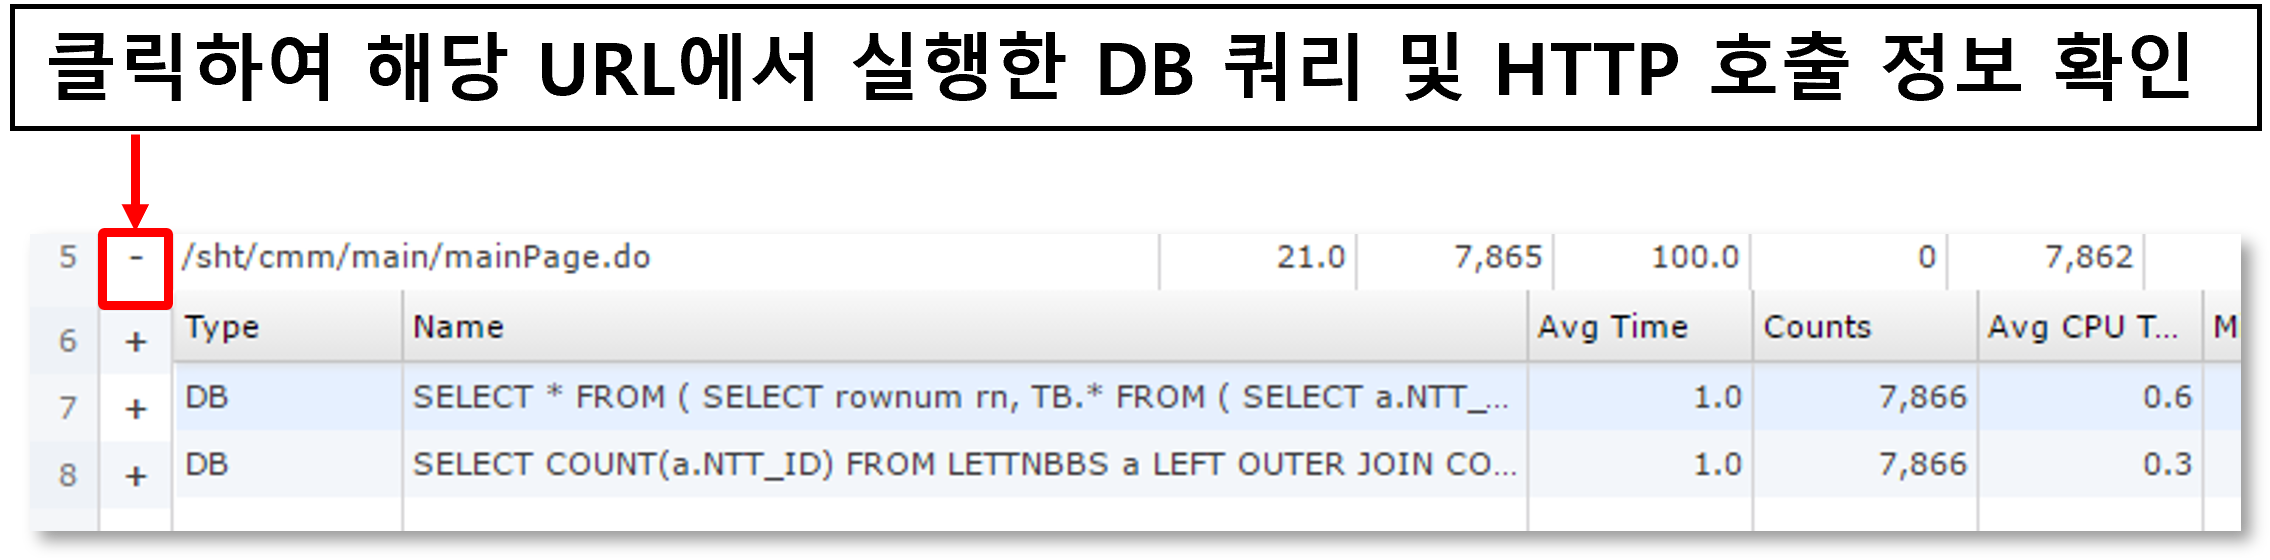
Displays information such as average response time, number of calls, number of errors, number of satisfaction ratings, and average SQL query execution time for a given URL.
-
You can check the statistics of SQL and HTTP calls called within a URL.
-
See below for how to search for a specific date, time, or URL.
![]()
-
You can search by selecting a date range.
![]()
-
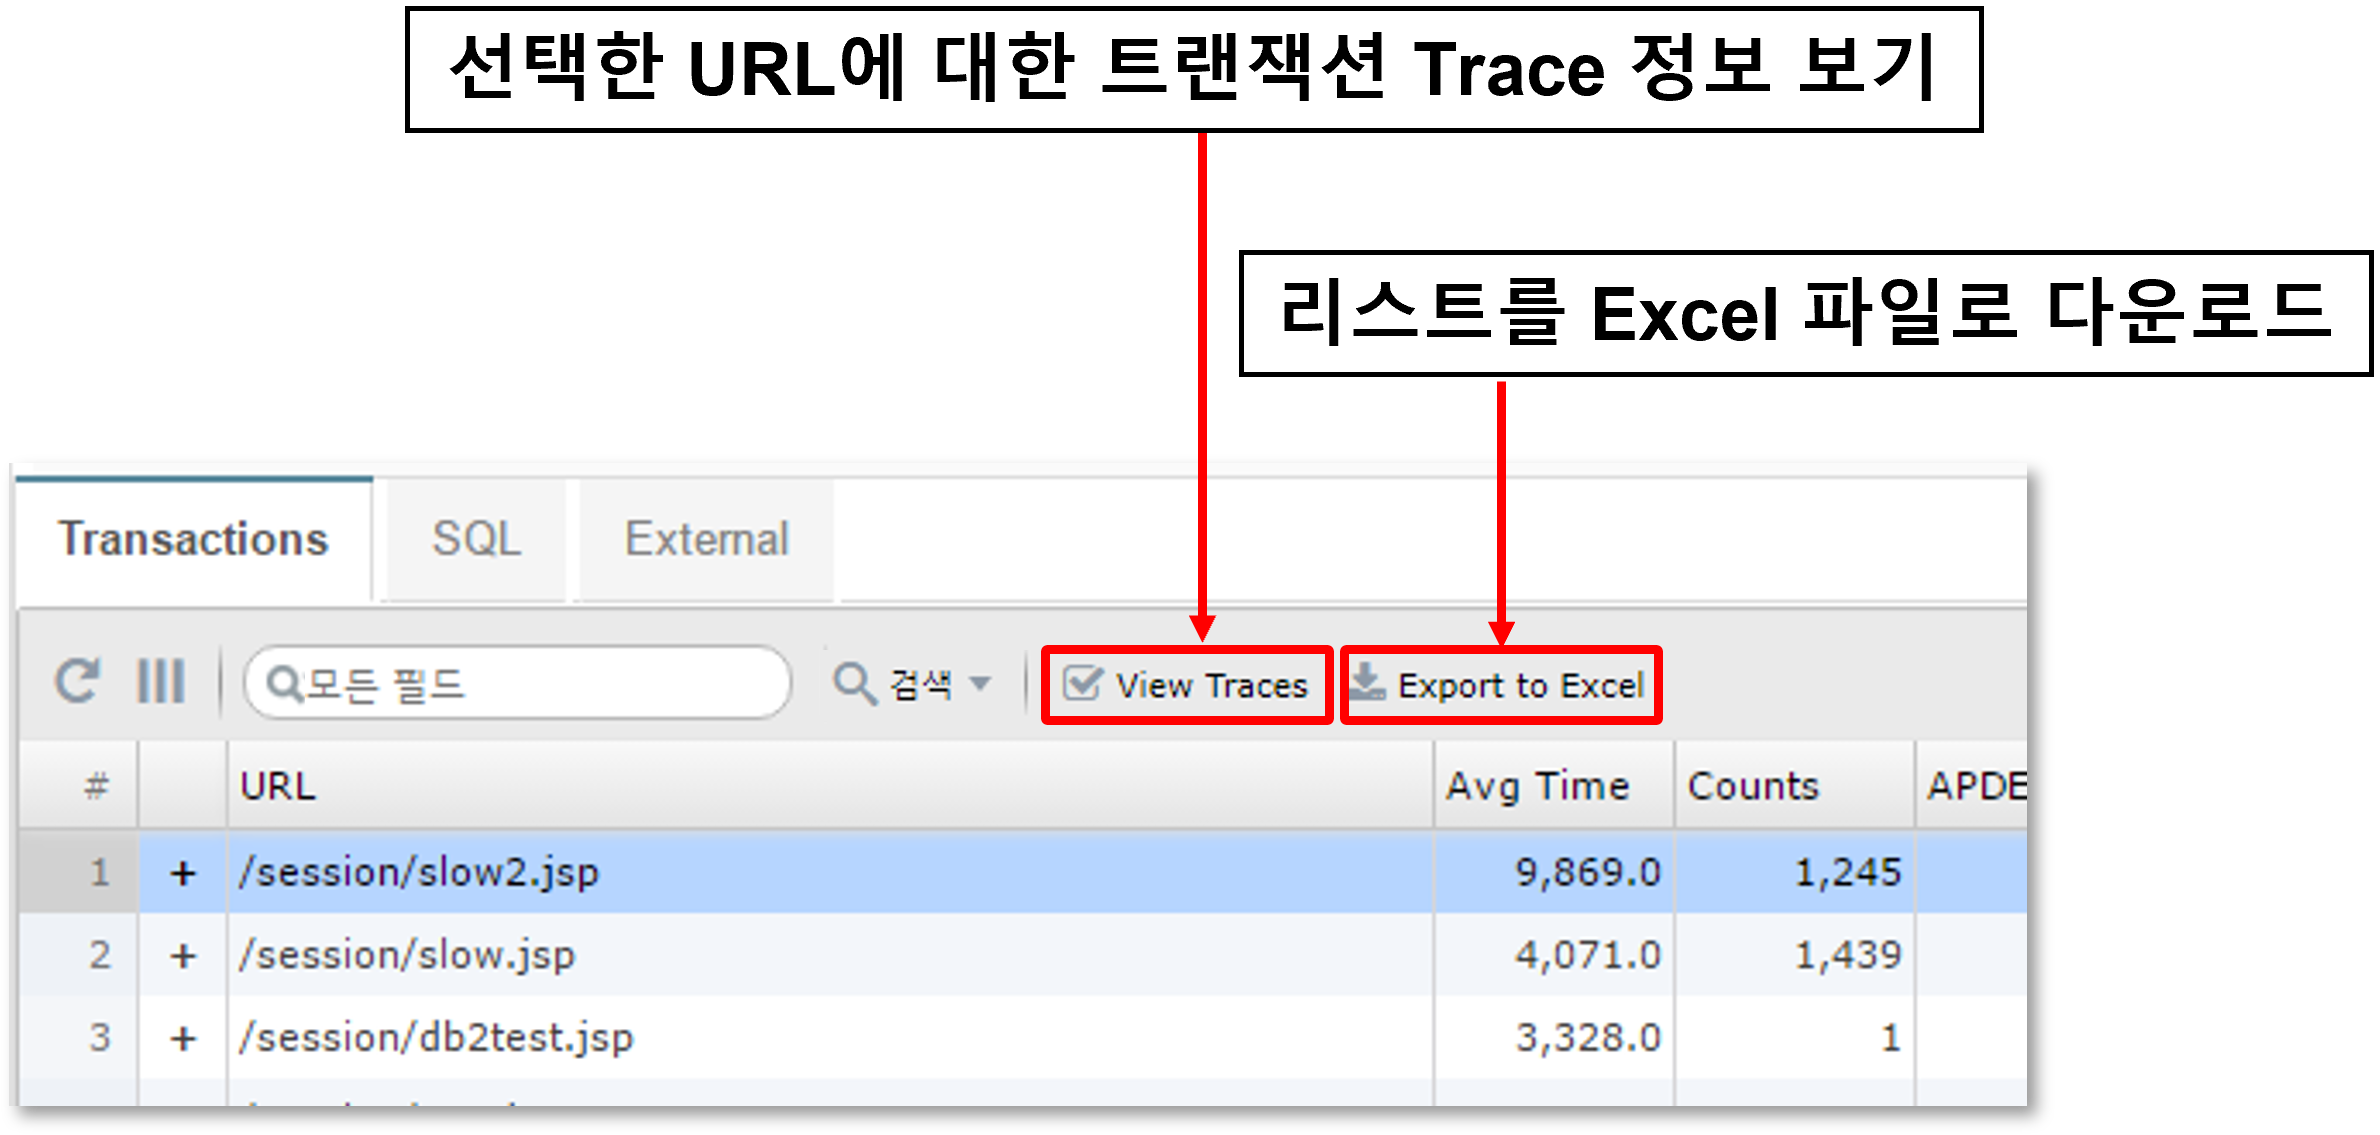
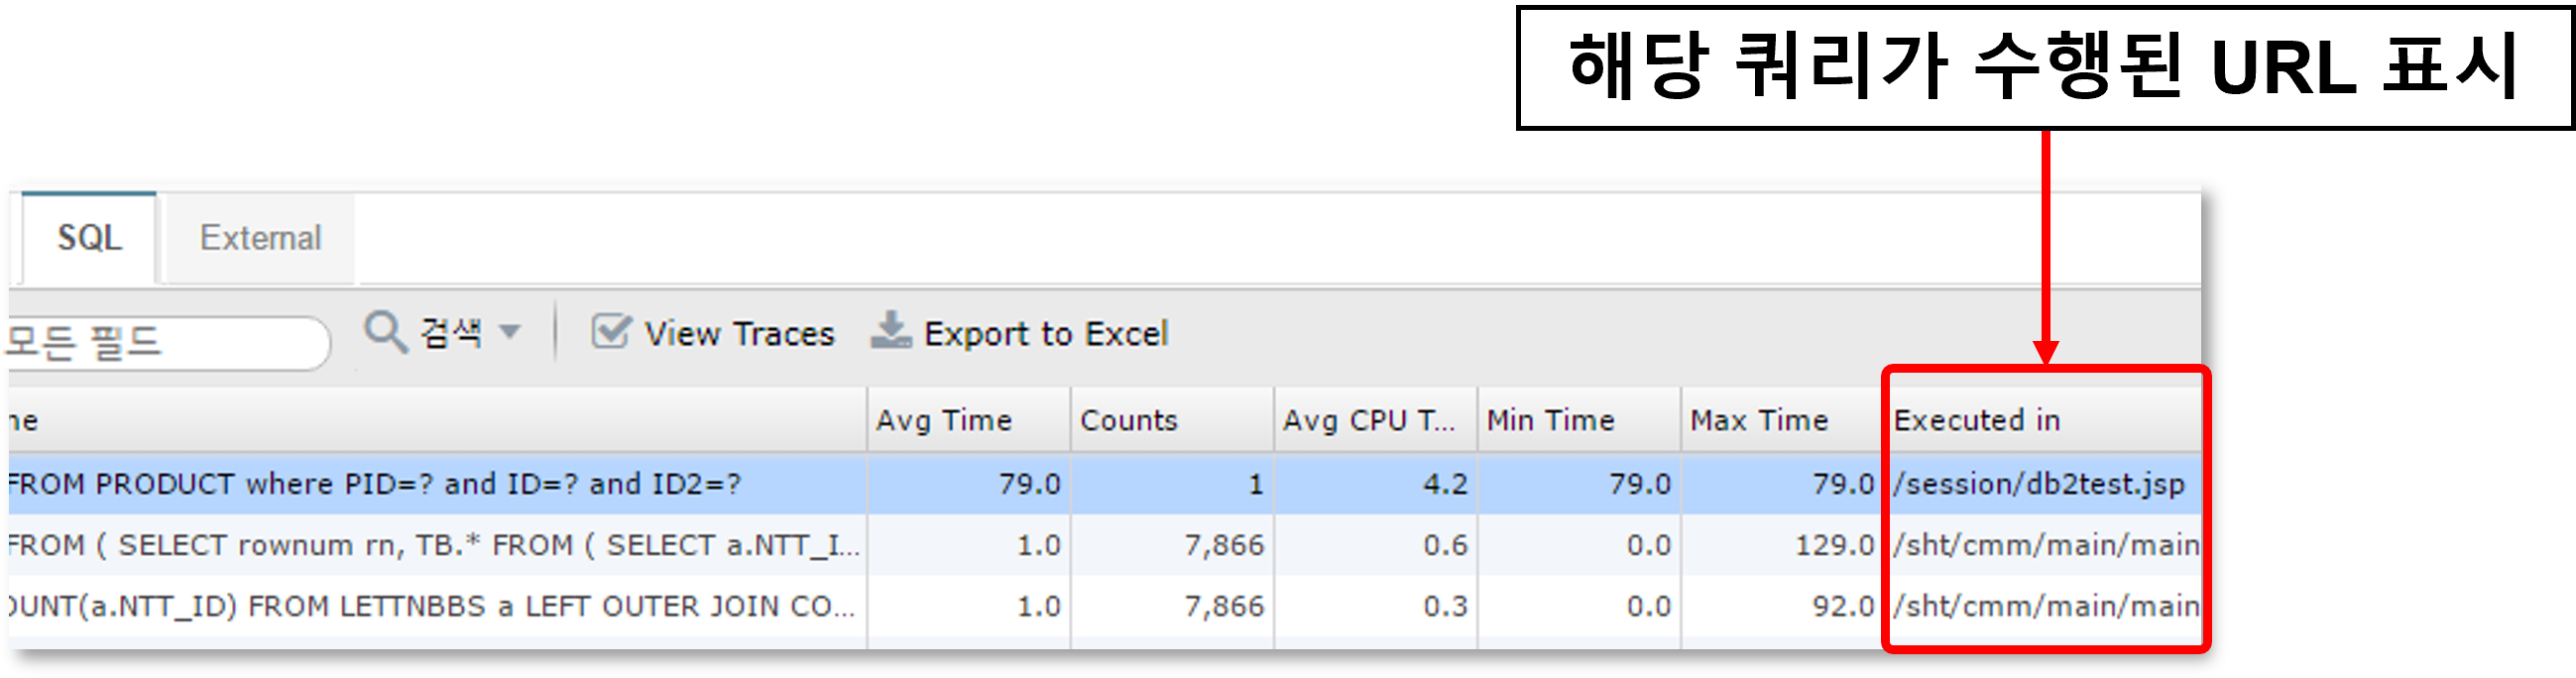
You can check the transaction trace information for the URL.
-
For SQL or HTTP calls, the URL where the query was executed is also displayed.
Statistics > Slow URL Retrieval
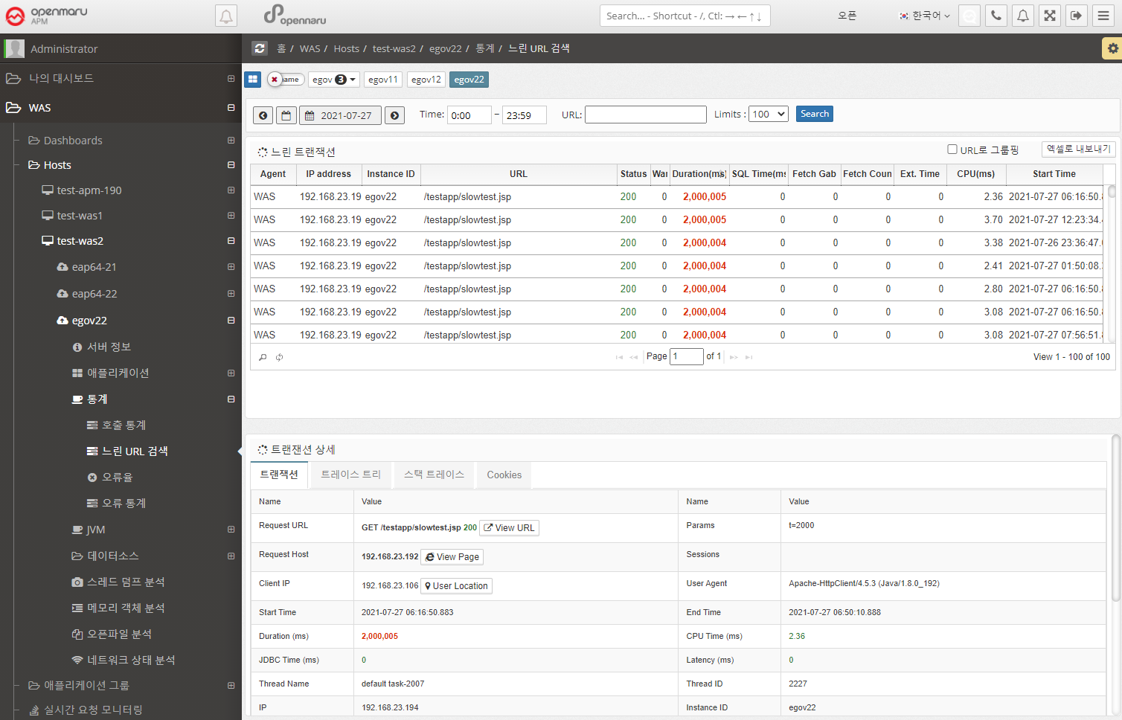
Retrieve a list of the slowest URLs on a per-instance, per-day basis. You can specify the time and number of results using the time slider. Click a URL to display detailed transaction information by method.
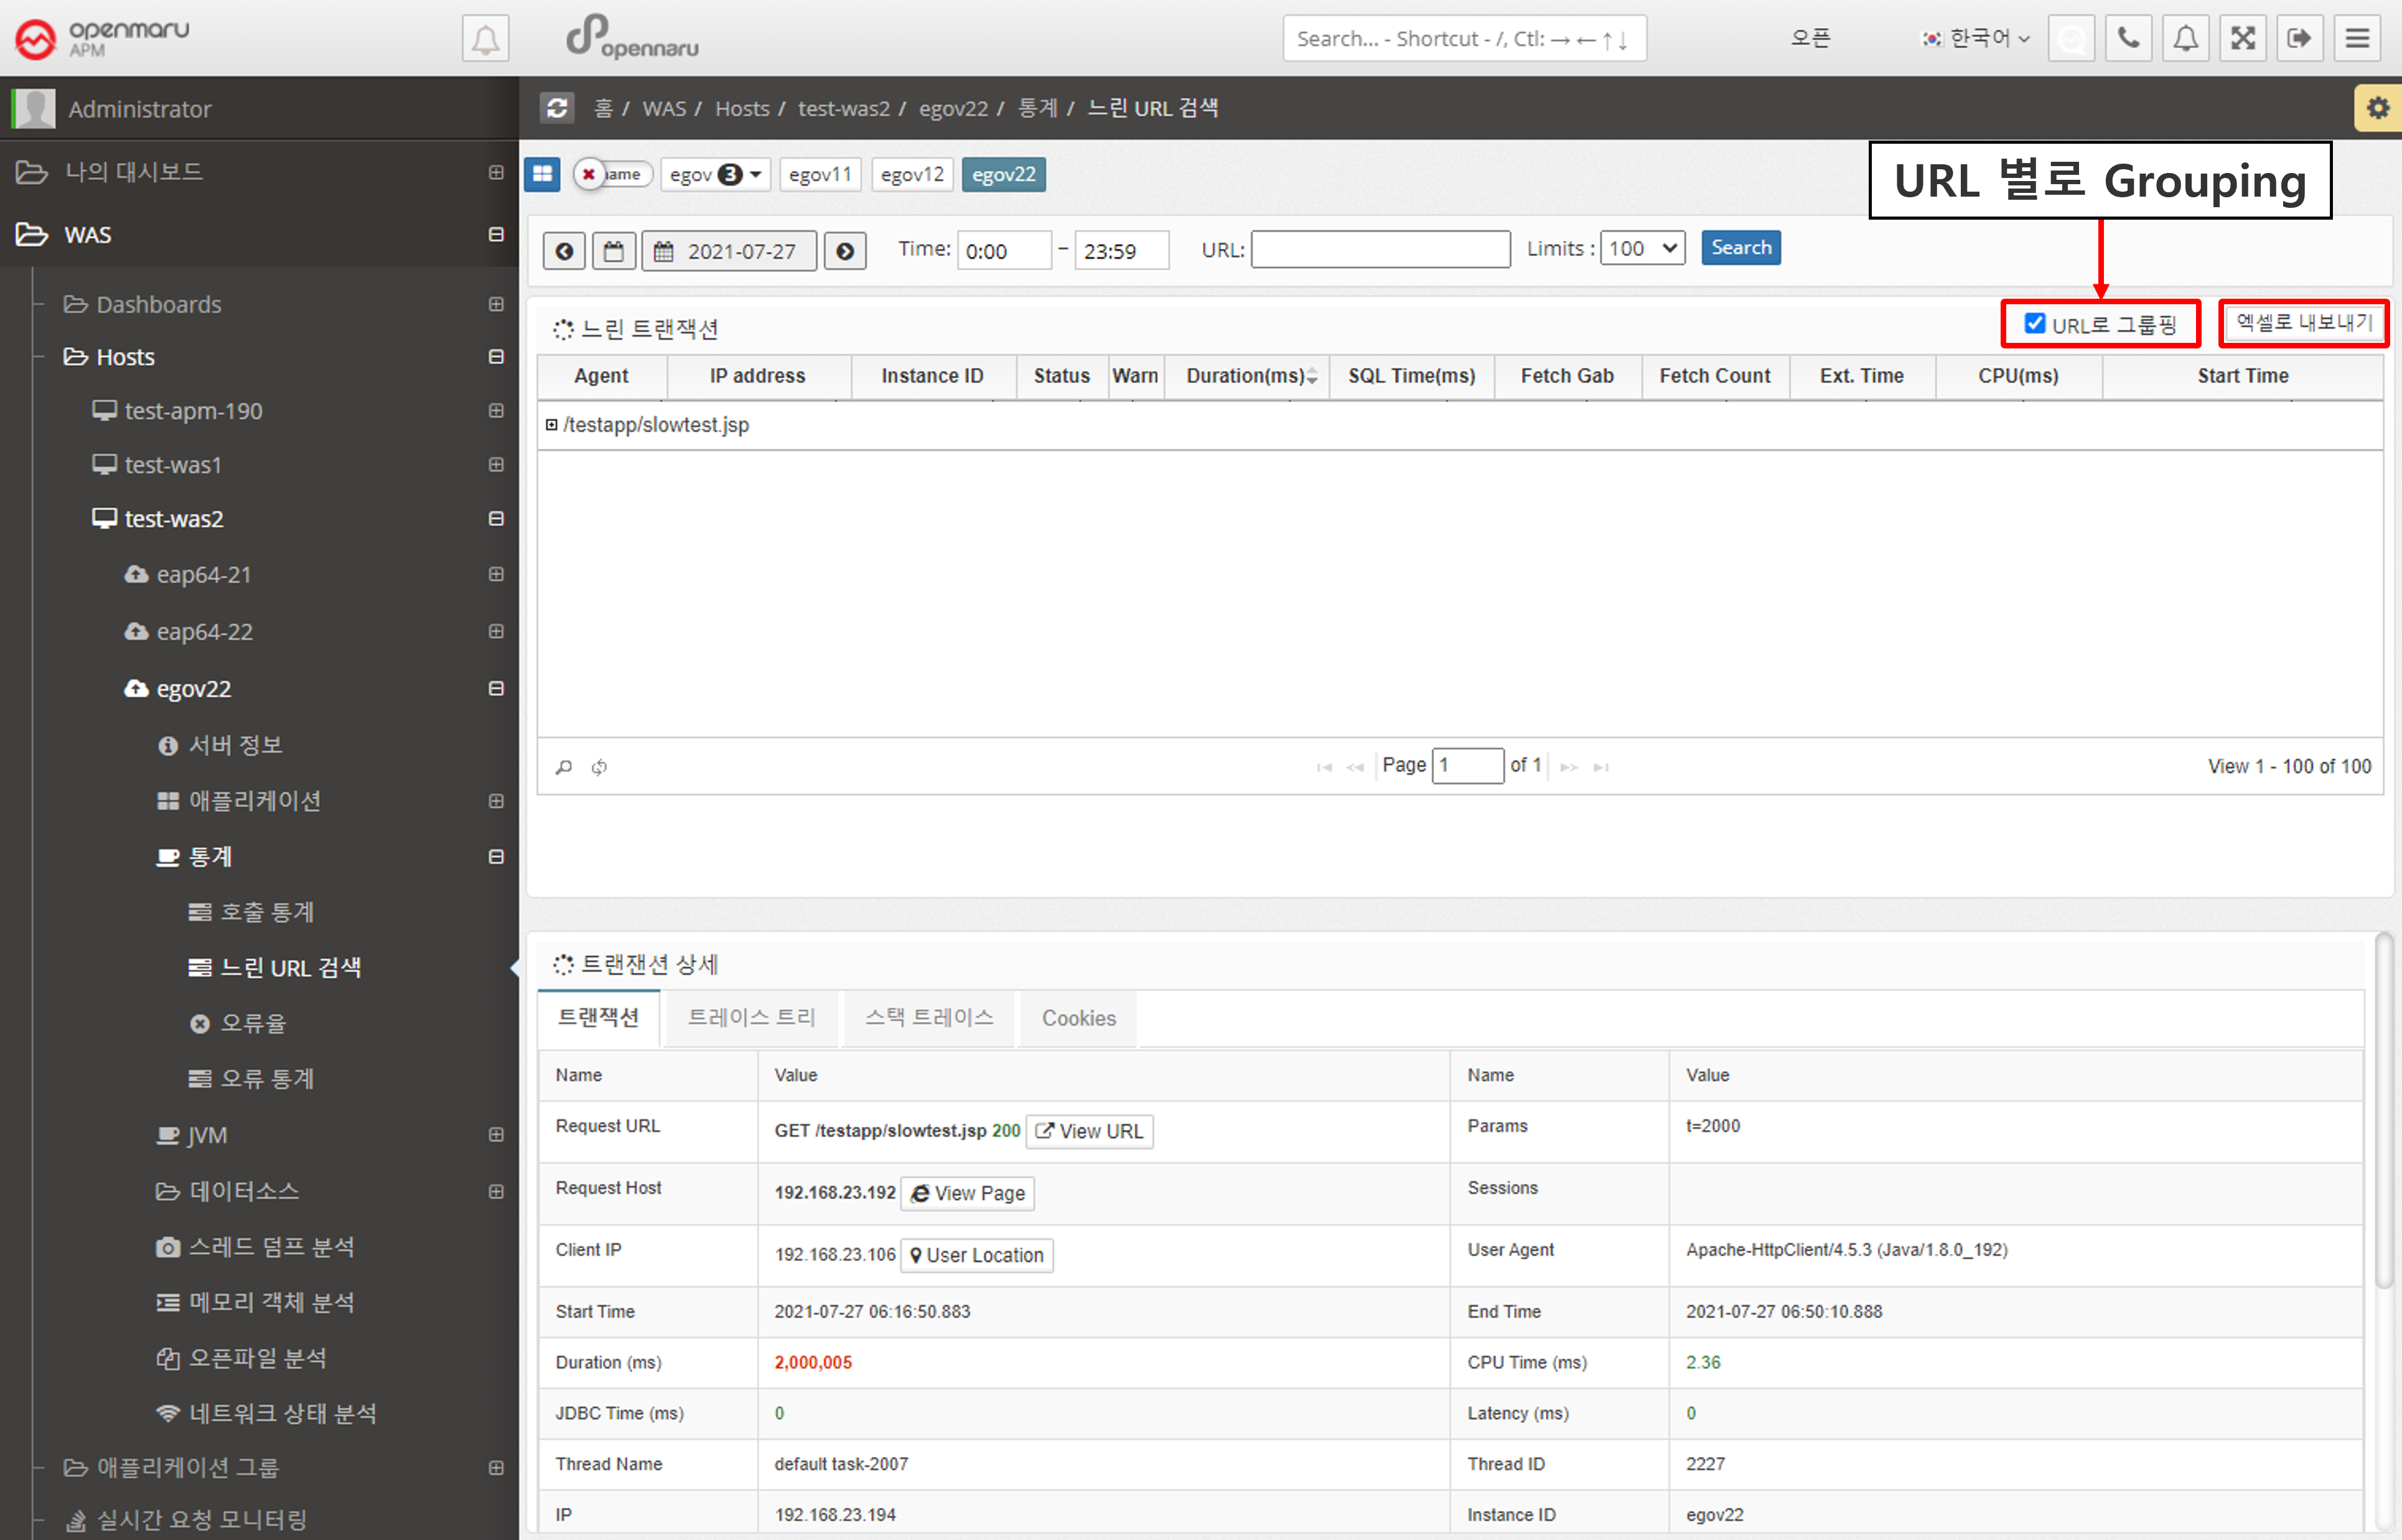
If you check the 'Group by URL' checkbox, the searched URLs will be displayed grouped by URL.
You can also download the search results as an Excel file.
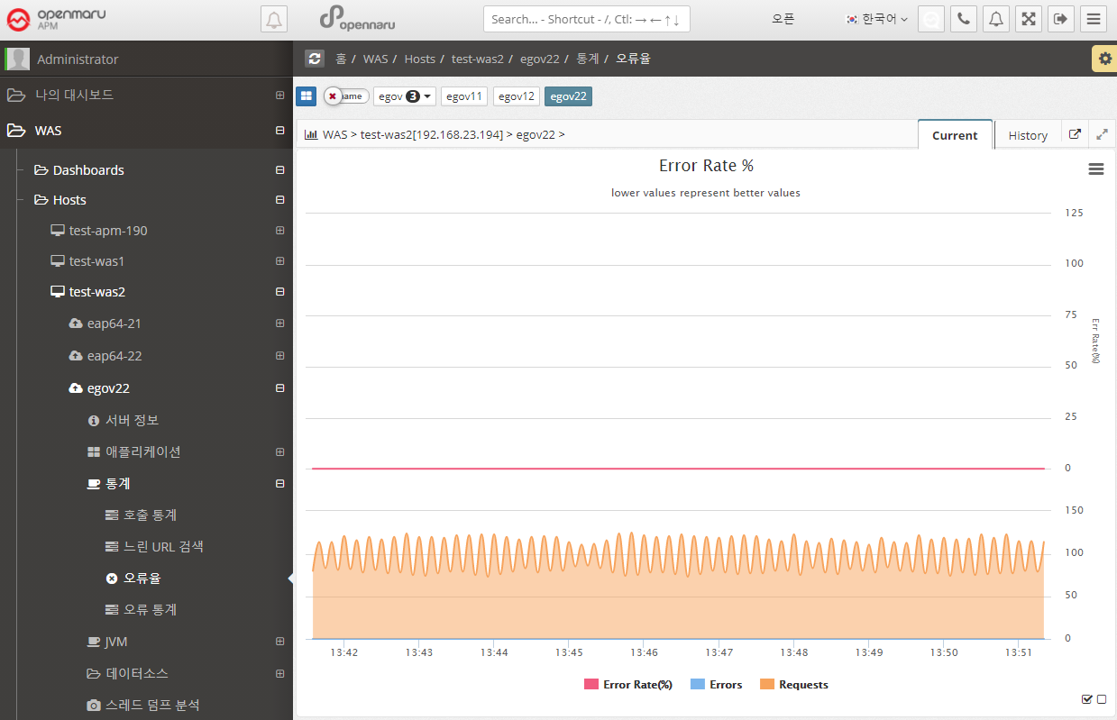
Statistics > Error Rate
Calculate the number of HTTP Status code 40x and 50x error codes returned by each application as a percentage (%) of the total number of URL requests and display the error rate in a graph.
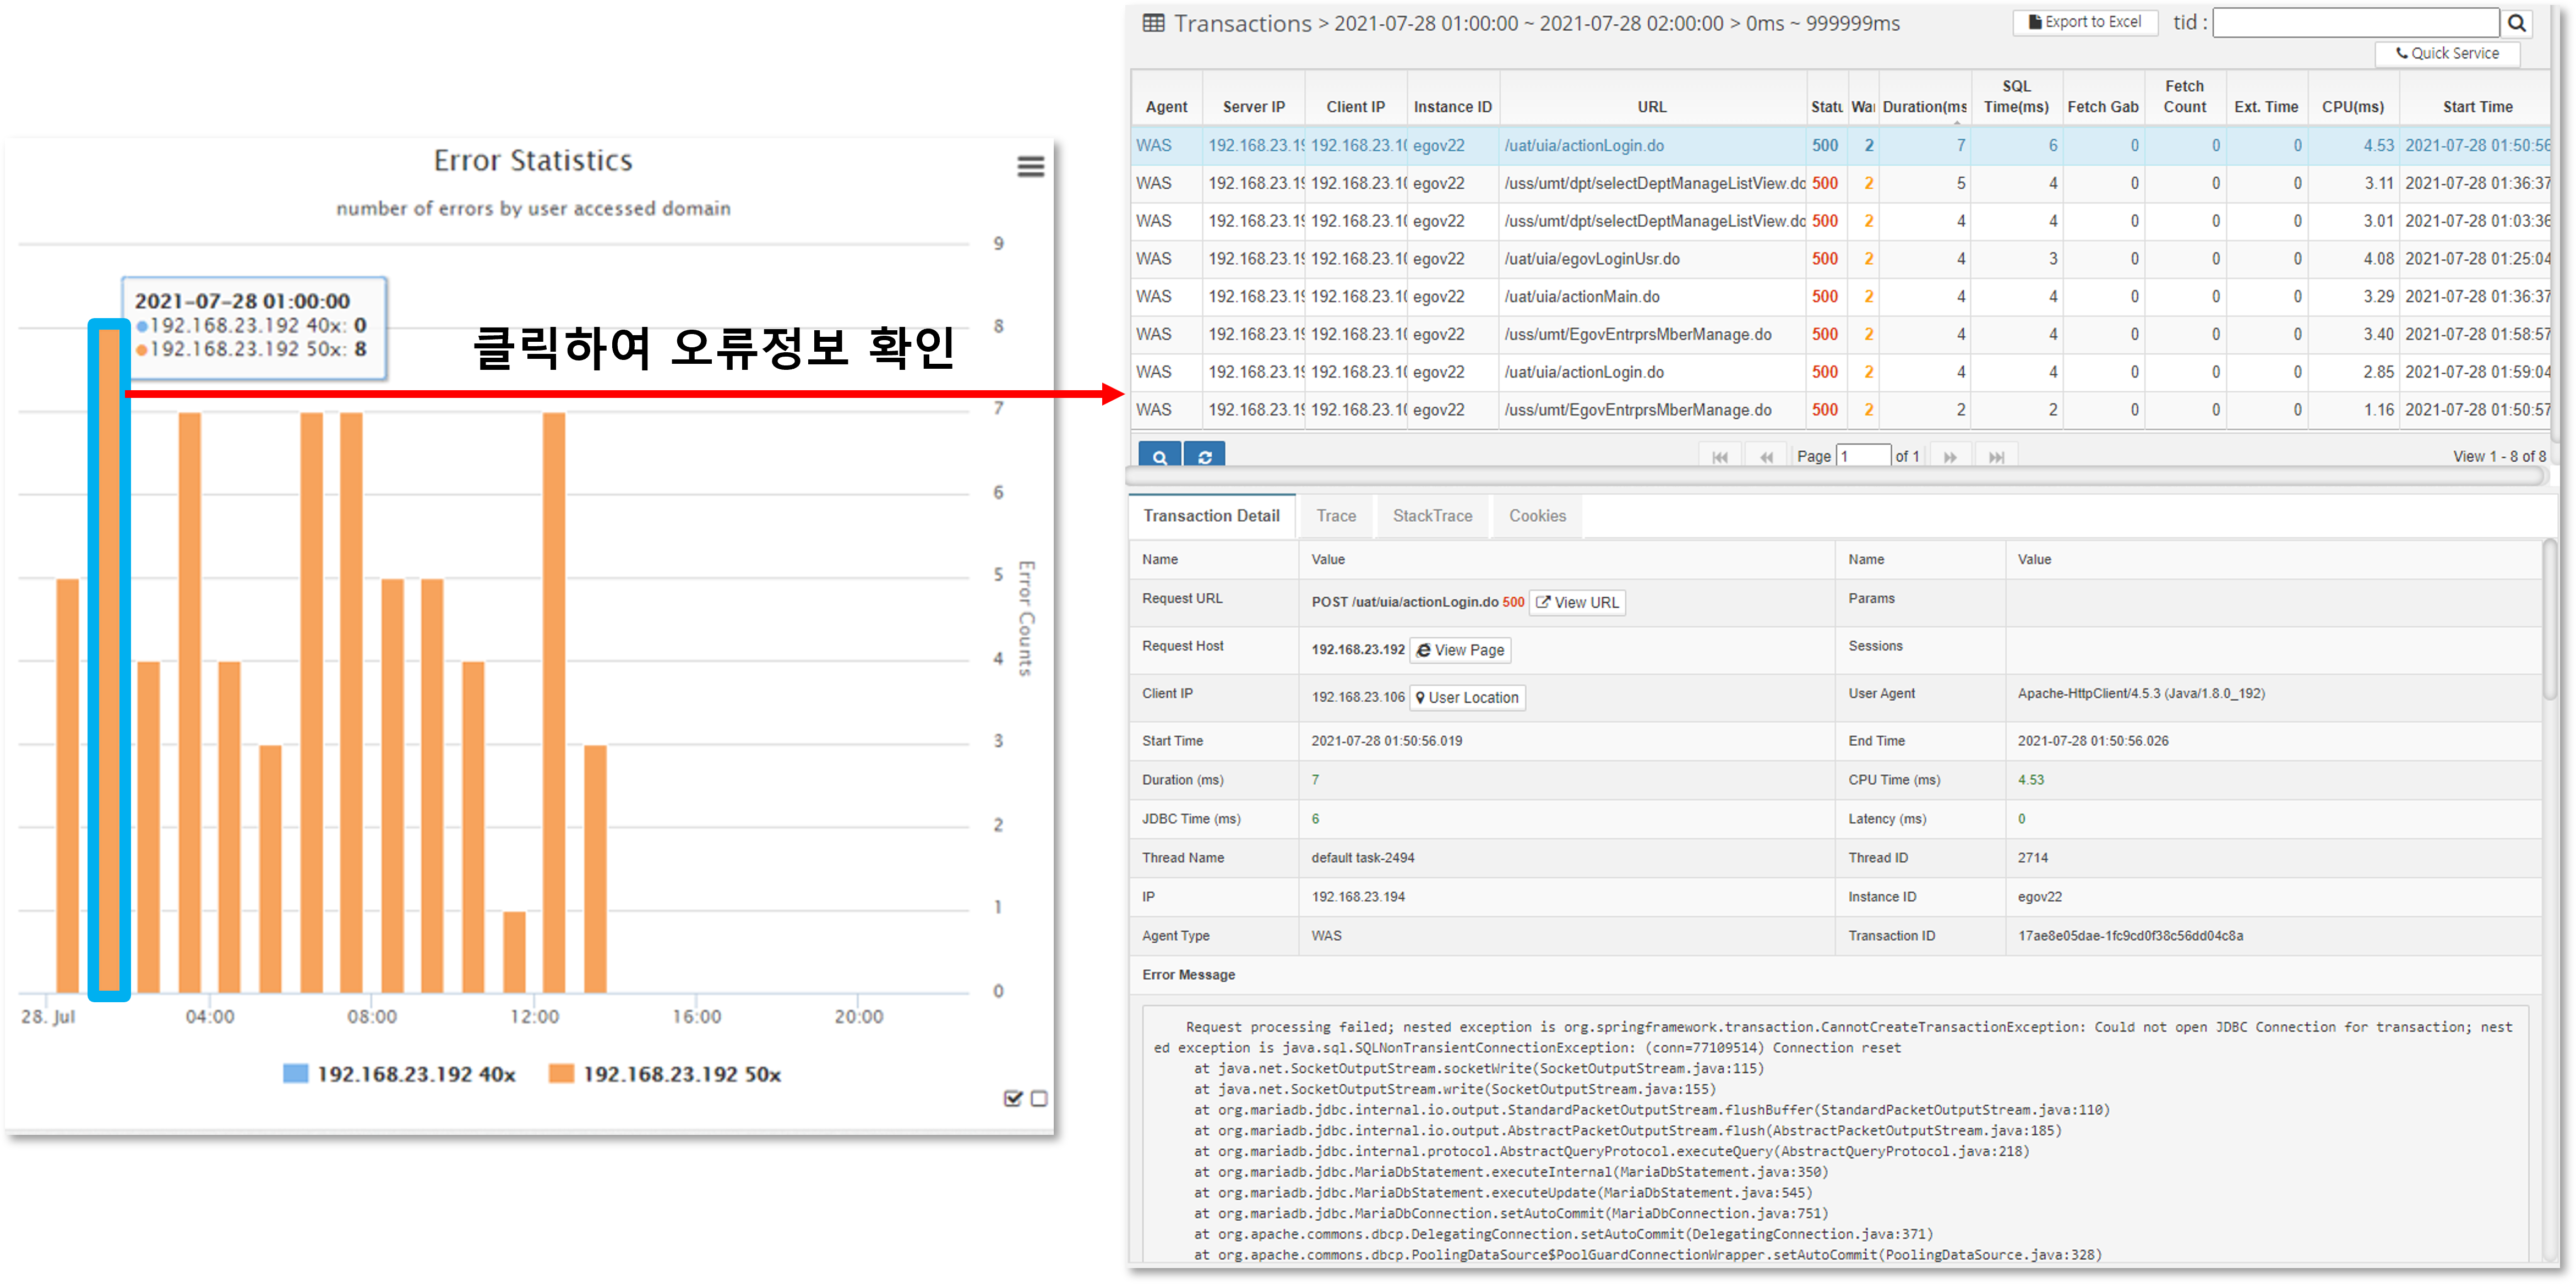
Statistics > Error Statistics
Displays hourly and daily graphs of errors that occurred in the instance. The information is categorized by the domain name that the user accessed by typing in the browser, separating 400 errors from 500 errors.
For example, if your WAS instance serves more than one domain name, you can see which domain name users are accessing and using to get errors.
Select a date to view hourly error statistics for that day.
If you select the 'Daily' tab, you can see error statistics for each day of the month.
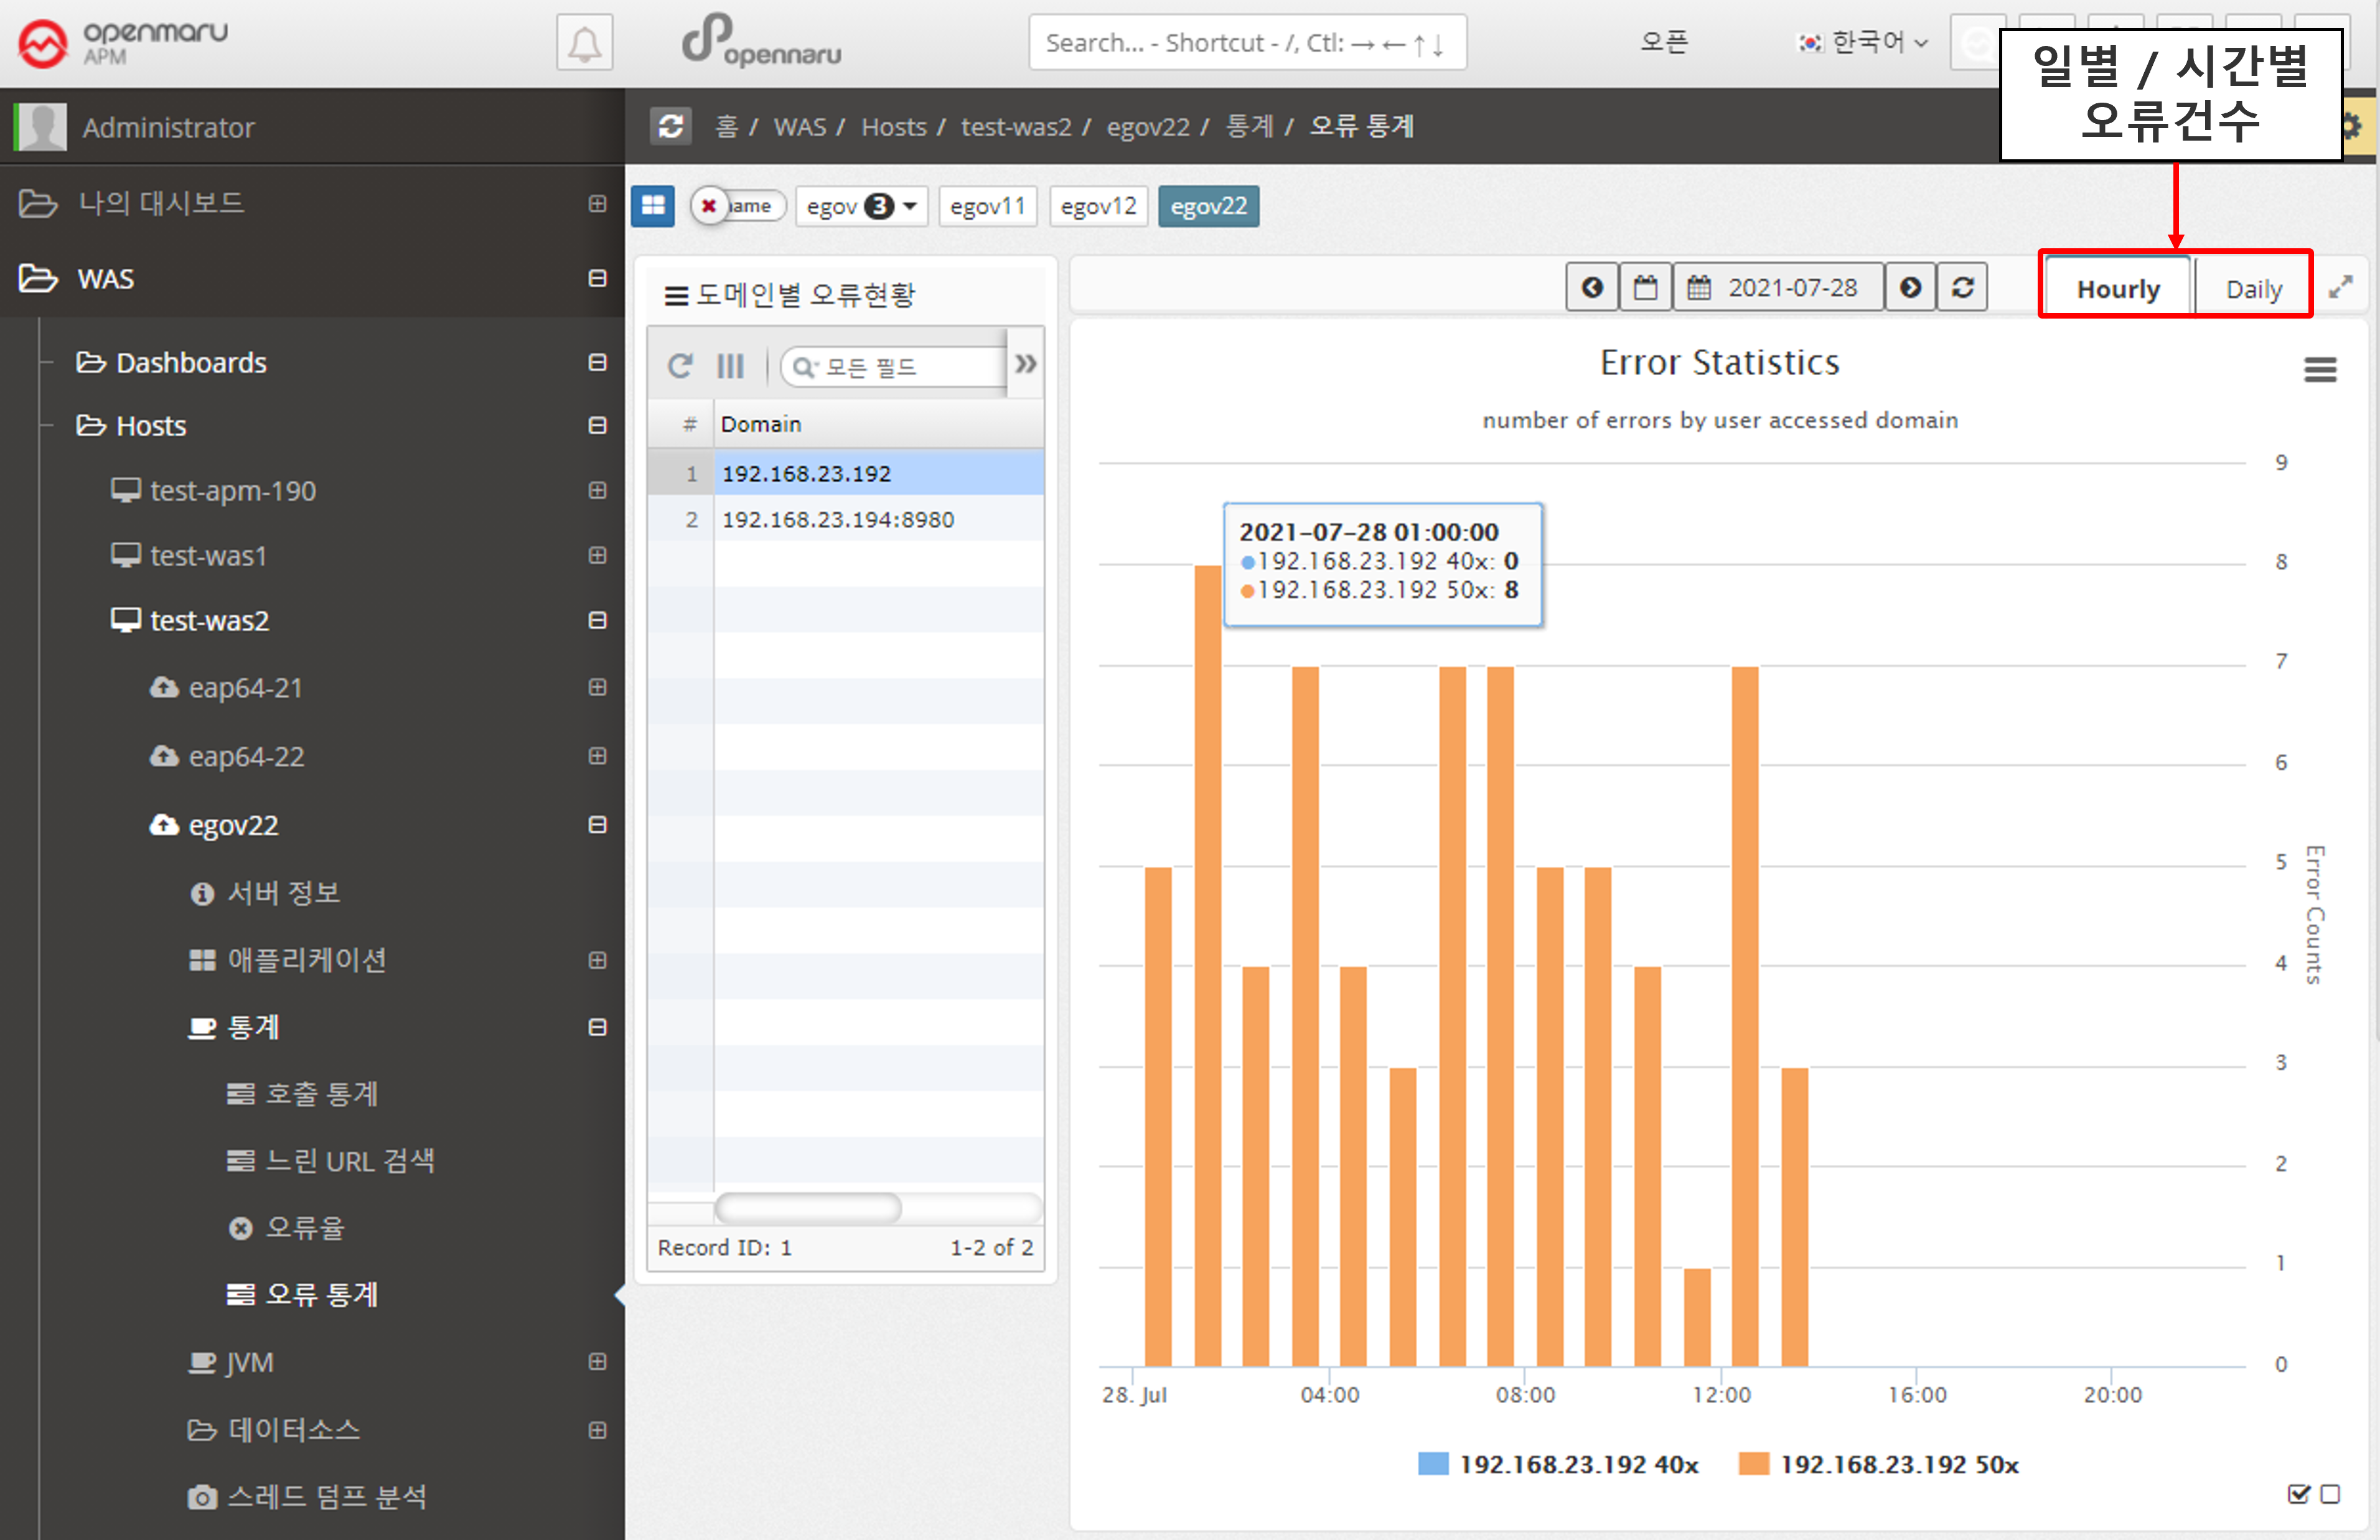
If you want to see the details of the specific error that occurred, you can click on the corresponding bar to see the detailed transaction information for the error.