2.5.3 System - Resources
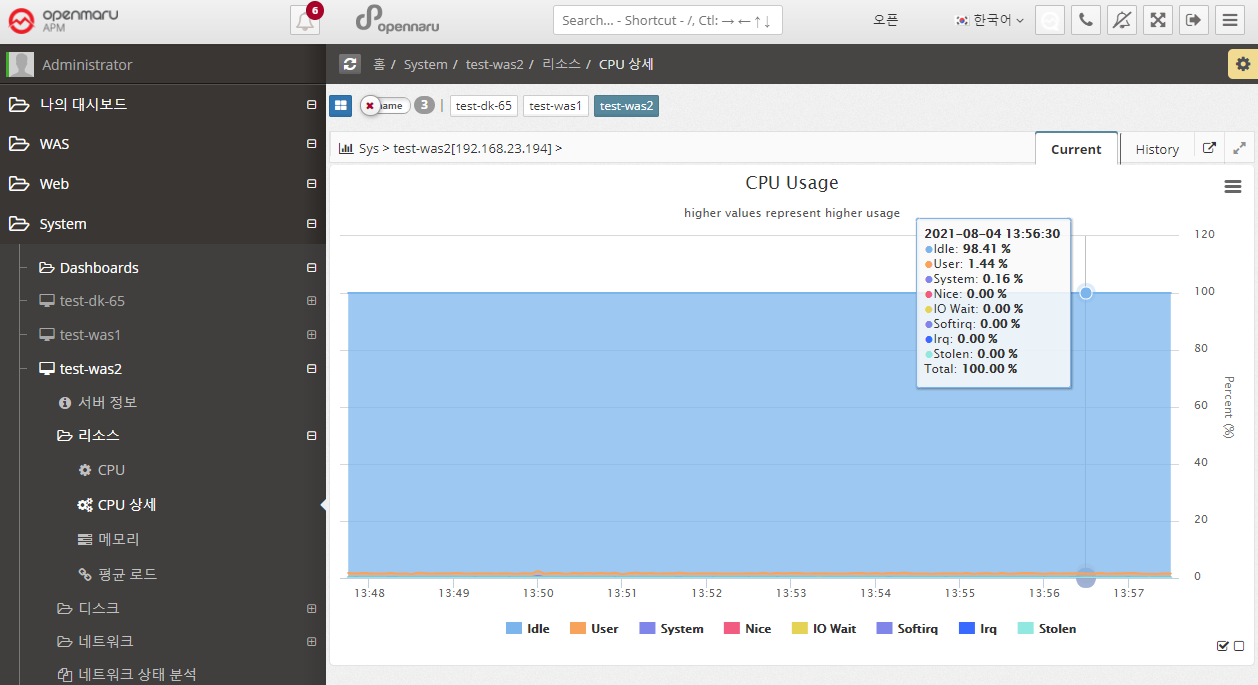
System > Resources > CPU Details
Displays a graph of all items of the system’s CPU utilization.
The meaning of each item is as follows
| Item | Description |
|---|---|
User |
CPU utilization by user (application) |
Nice |
CPU utilization for applications running with Nice priority |
System |
CPU utilization at the system level (kernel) |
Iowait |
Percentage of CPU used or idle due to processing disk I/O requests |
Irq |
Percentage of CPU used to handle interrupts |
Softirq |
Percentage of CPU used to handle software interrupts (Softirq) |
Stolen |
Percentage of CPU lost in a virtualized environment |
Idle |
Percentage of CPU not in use |
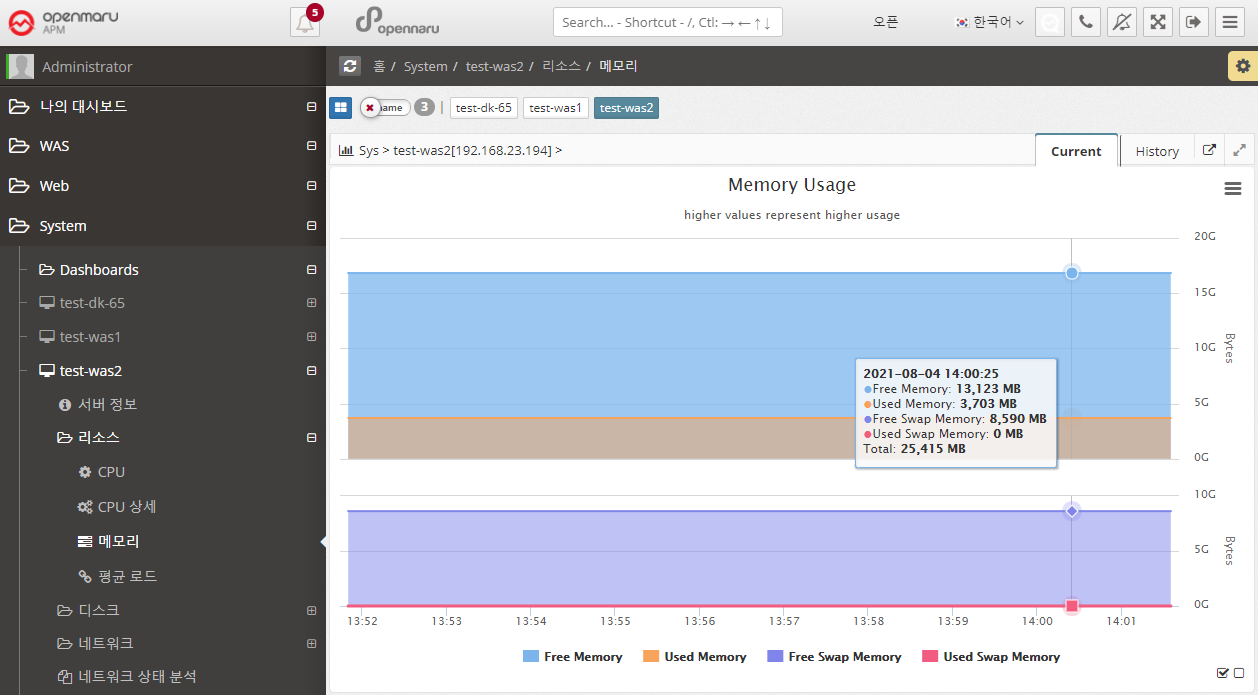
System > Resources > Memory
Graphically displays the system’s memory usage and swap usage. It displays total memory and the amount of memory currently in use, as well as the total swap memory size and swap memory usage that you have set. Swap memory is a way to use the file system on disk as memory. Therefore, unless the system suddenly runs out of physical memory, using swap memory in the operating system will significantly reduce the overall performance of the system. It also has a significant impact on the performance of JVM > applications running on the OS, so it’s a good idea to check Swap usage.
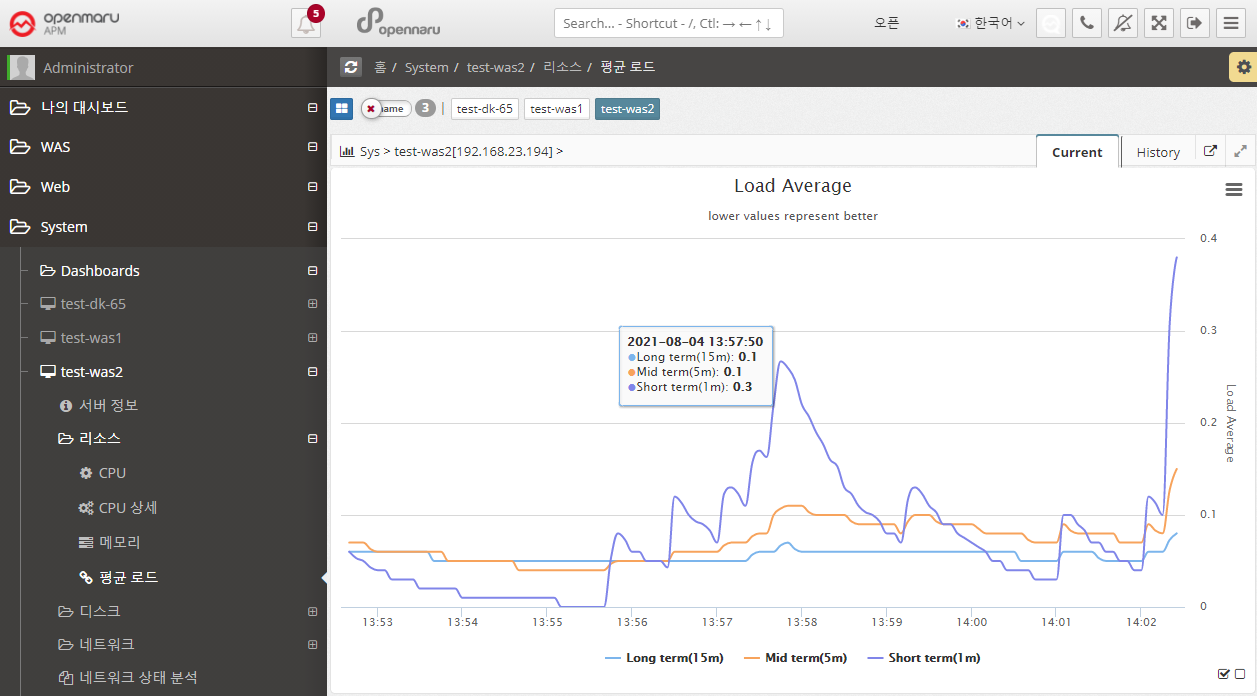
System > Resources > Average Load
Graphically display the average load of the system.
| Item | Description |
|---|---|
Short Term |
The average number of processes waiting to run in one minute. |
Mid Term |
The average number of processes waiting to run in 5 minutes. |
Long Term |
The average number of processes waiting to run in 15 minutes. |
A high Load Average can indicate that the system is overloaded. If you have a system with 1 core, a load average of 1 means that it is using all of its cores. Most system administrators agree that a Load Average of 0.7 or higher will sooner or later lead to an overload situation, so it’s a good idea to find the cause and fix it. If it’s above 1.0, you need to find and fix the problem immediately. If it’s over 5.0, it’s really serious. If left unchecked, the system will either hang or slow down significantly.
On multi-core systems, the average load value is affected by the number of cores available. If it is 100% utilized, it will show 1.0 on a single core and 2.0 on a dual core. Naturally, it would be 4.0 on a quad-core system with four cores.
It also shows the 1, 5, and 15 minute averages, so if the 15 minute average is over 1.0 on a single core, it means you are in a constant overload situation.
Of course, the Current chart shows the 1-, 5-, and 15-minute averages better, but the History chart shows averaged data over hours and tens of minutes, so the 1-, 5-, and 15-minute averages are almost identical overall.
To check the current CPU and Core count of your system, go to System - Server Information and check the 'CPU' section.