2.8.1 How to use reports
You can download daily and weekly reports from the 'Reports' menu.
The daily report and the weekly report at 13:00 midnight every day will automatically generate an Excel file at 33:00 midnight on the day the weekly report is generated.
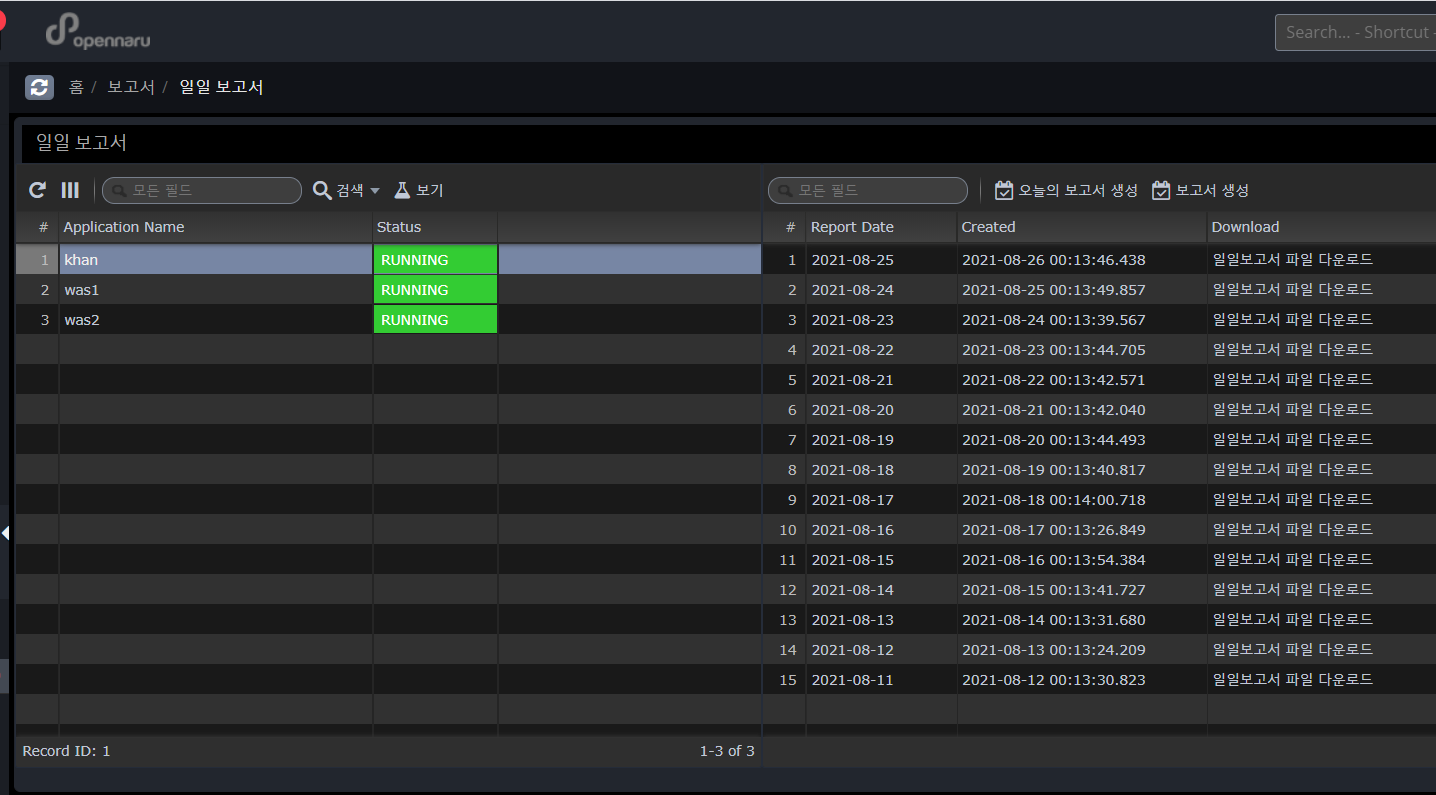
Daily report
The daily report is generated for each application group, and 'Report Date' means the date of the report contents, and 'Created' shows the date and time when the report excel file was created. Click the 'Download daily report' link to download the excel file.
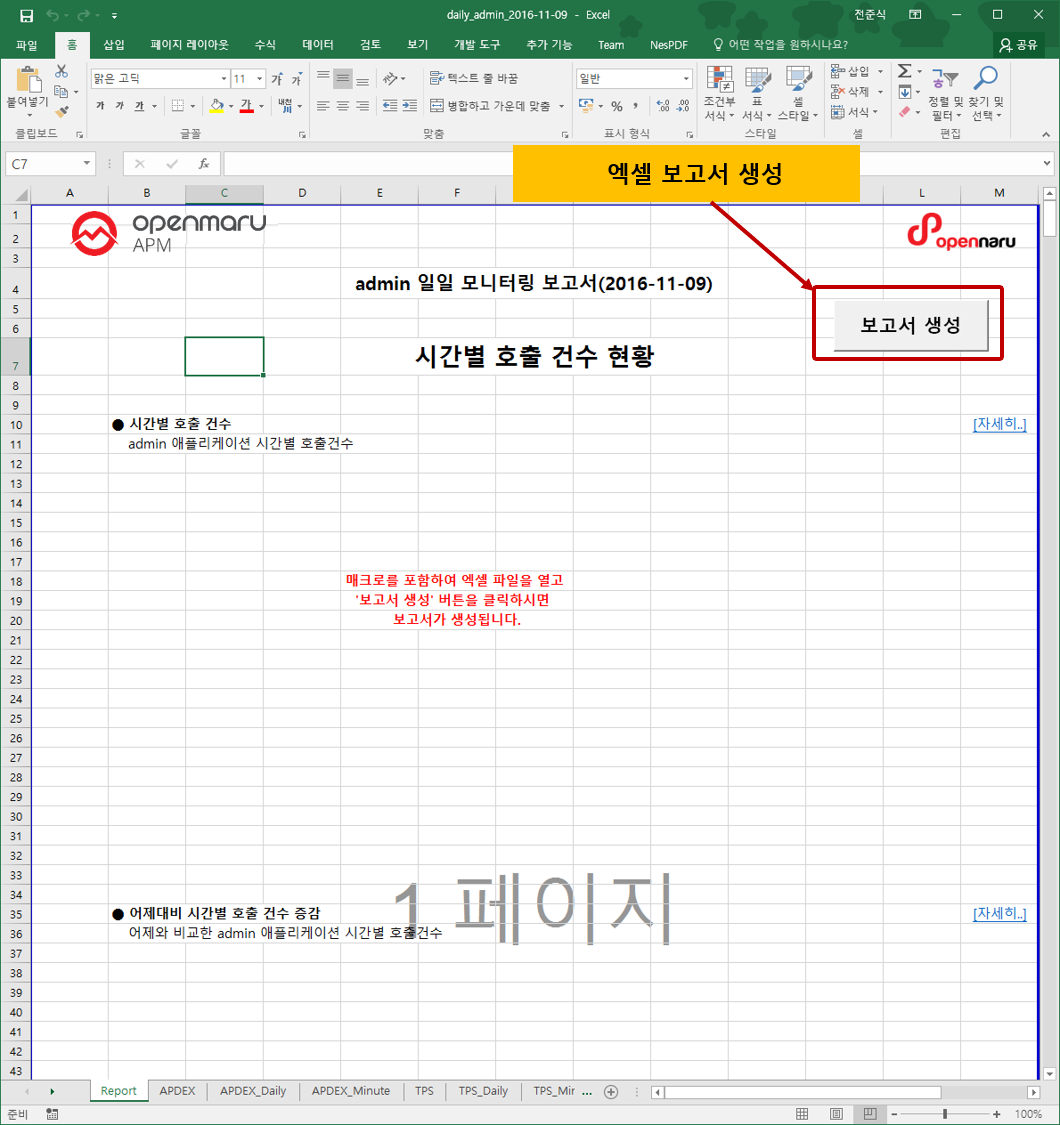
Generated report
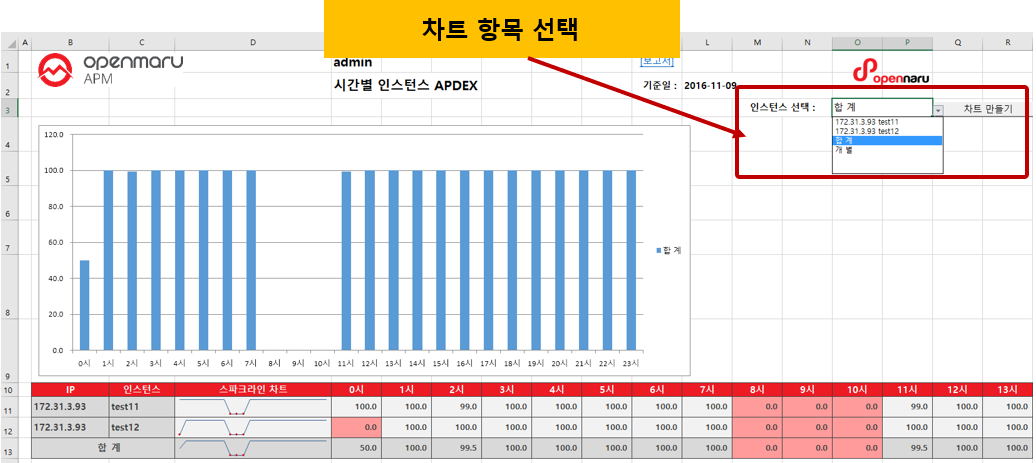
The report generates hourly call count, hourly average response time, hourly APDEX, hourly TPS, hourly active users, hourly error rate, hourly JVM Heap utilization status, hourly system CPU utilization, hourly system memory utilization, top 50 slow URLs, and top 50 slow queries for each item.
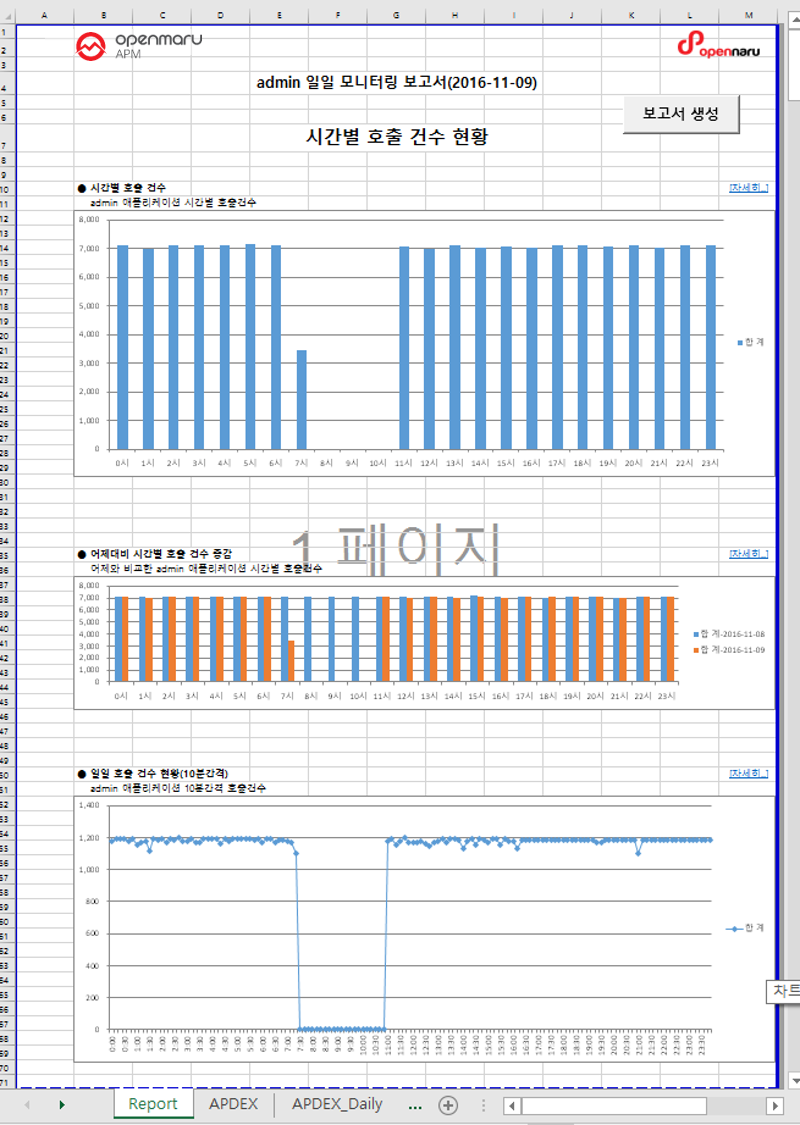
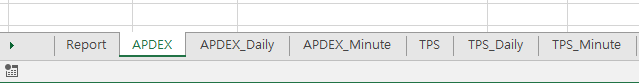
The first tab, 'Report', displays a summary report for each item, and each tab shows hourly data items, hourly data items compared to yesterday, and 10-minute data items.
Each Tab item displays tabular data and a graph.
To change the automatically generated graph, select the item you want to graph from the "Select Instance: menu, select the item you want to graph, and click the 'Create Chart' button to create a graph with that item.
Weekly Report
The weekly report is generated for each application group, and the 'Report Date' means the date of the report content, and 'Created' shows the date and time when the report excel file was created. Click the 'Download Weekly Report' link to download the excel file.
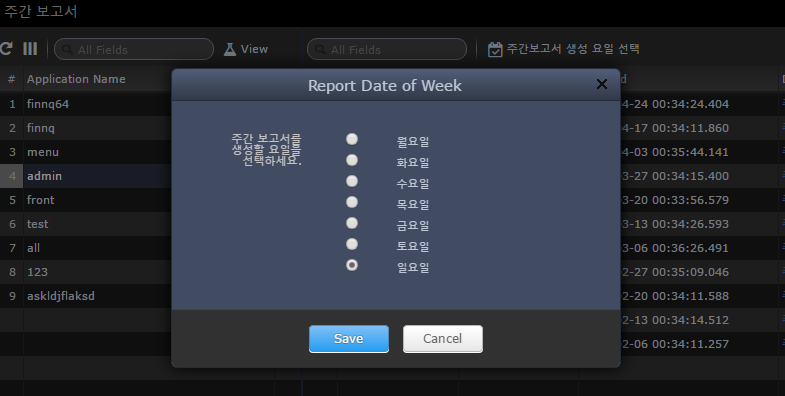
By clicking the 'Select Weekly Report Generation Day' button, you can select the day of the week you want to generate the weekly report. For example, if you select 'Sunday', the statistics from last Monday to midnight Sunday will be generated at 33:00 on Monday morning.
To generate the Excel file for the weekly report, download the Excel file and click the 'Generate Report' button, just like the daily report.