2.2.10 Business Groups - Applications
This item is used to get an overall view of processing by task. You can use it to get an overall picture of your business system because you usually configure multiple WAS instances to handle a single task.
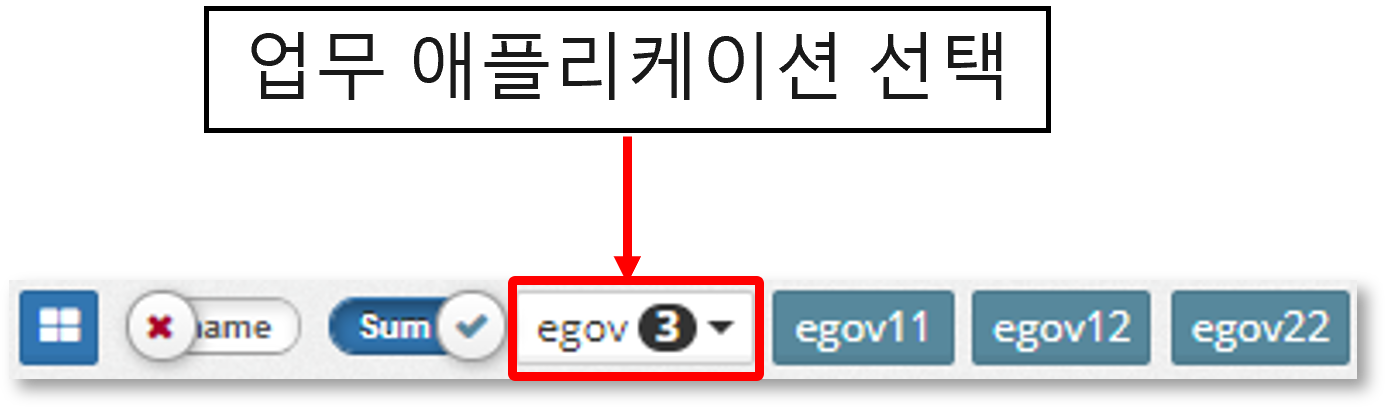
When you select a business application name in the 'Navigator' at the top of the graph, the current graph changes to a graph for that business. Individual instances are not selected in the task-specific group.
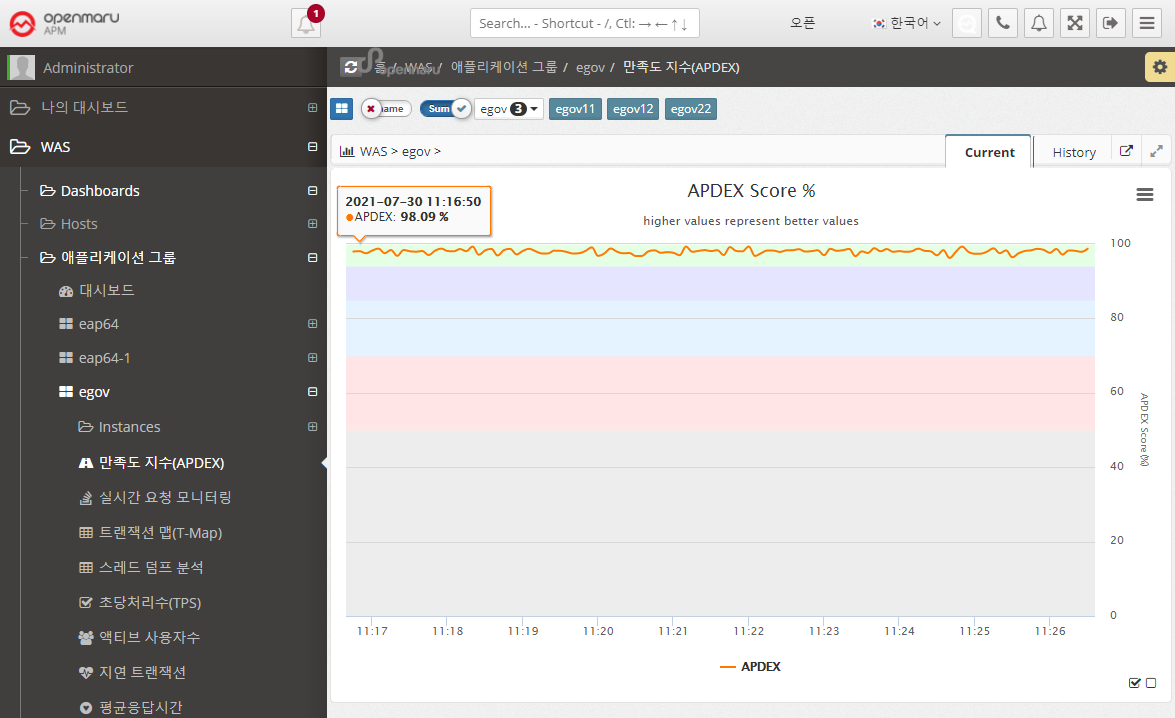
Application > Satisfaction Index (APDEX)
Displays a graph of the user satisfaction index (APDEX) for the application. Multiple instances used for a task are summed to get the average APDEX value and graphed.
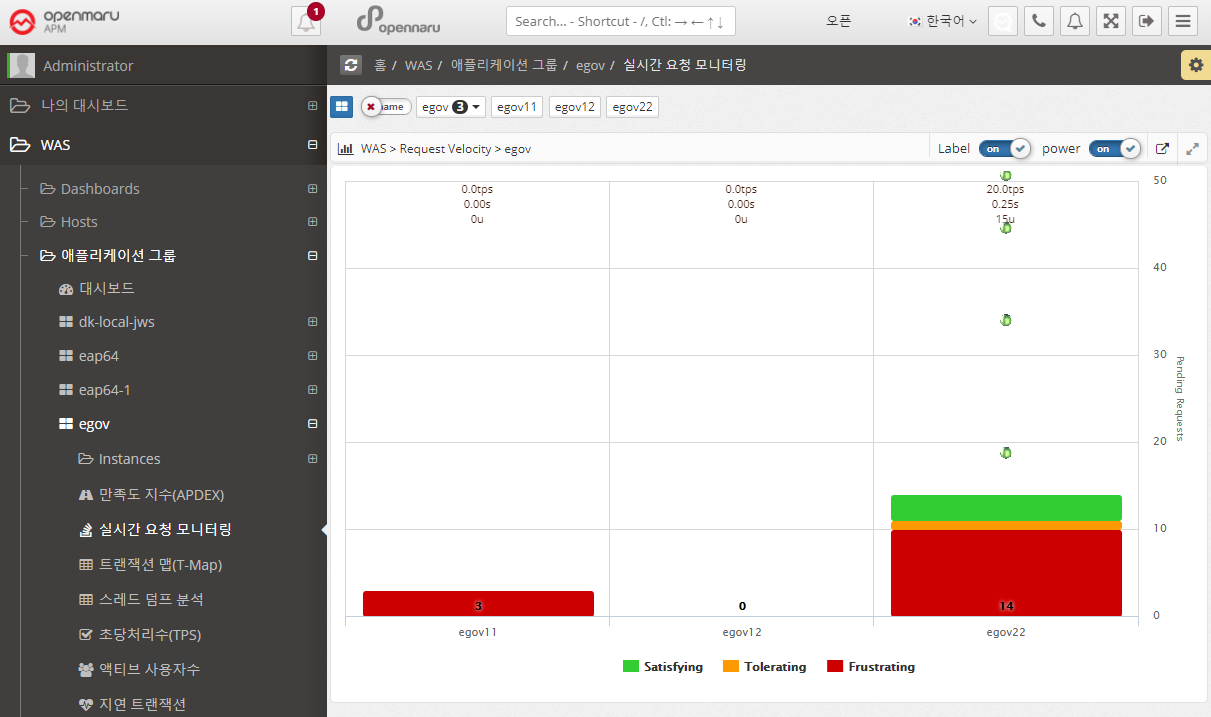
Applications > Real-Time Request Monitoring
Displays information requested by applications organized by task in real time. You can monitor the processing status of requests.
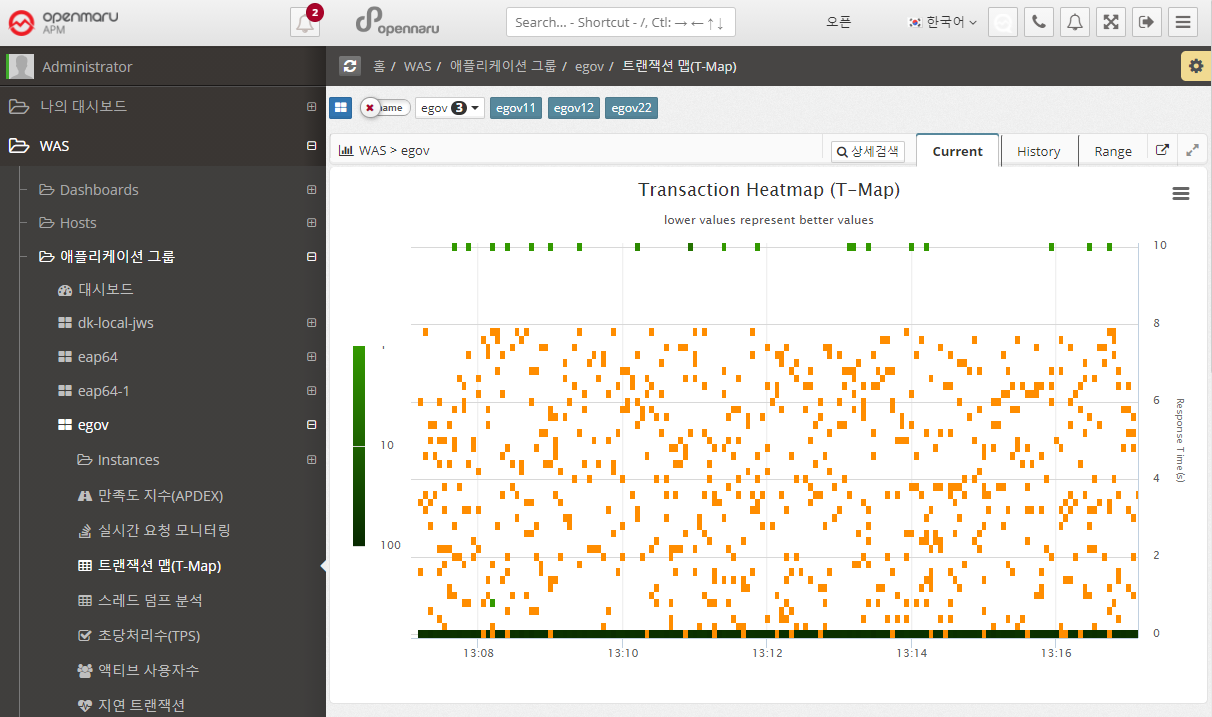
Application > Transaction Map (T-Map)
Displays the Transaction Heatmap (T-Map) for the job. For instructions, see APM Dashboard Screen Configuration - Transaction Heatmap (T-Map).
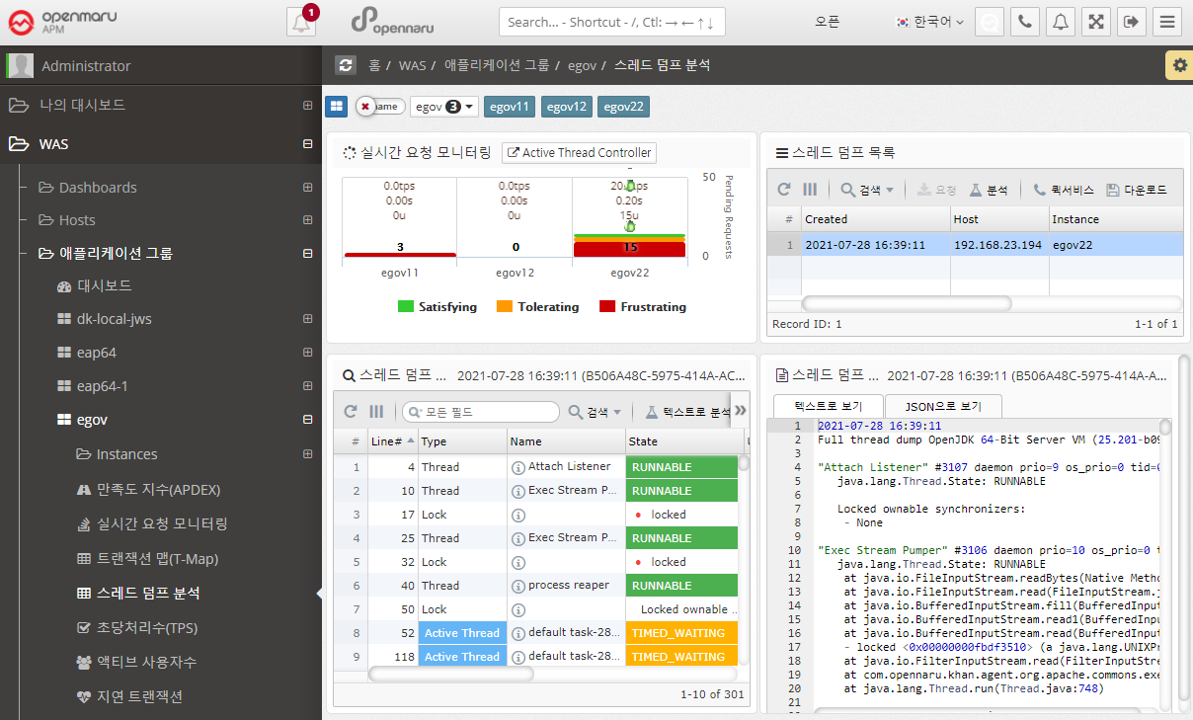
Application > Analyze Thread Dump
To see what is currently running in your WAS instance, you can analyze it using thread dumps.
For details on how to analyze a thread dump, see, How to Respond to Server Failures with APM.
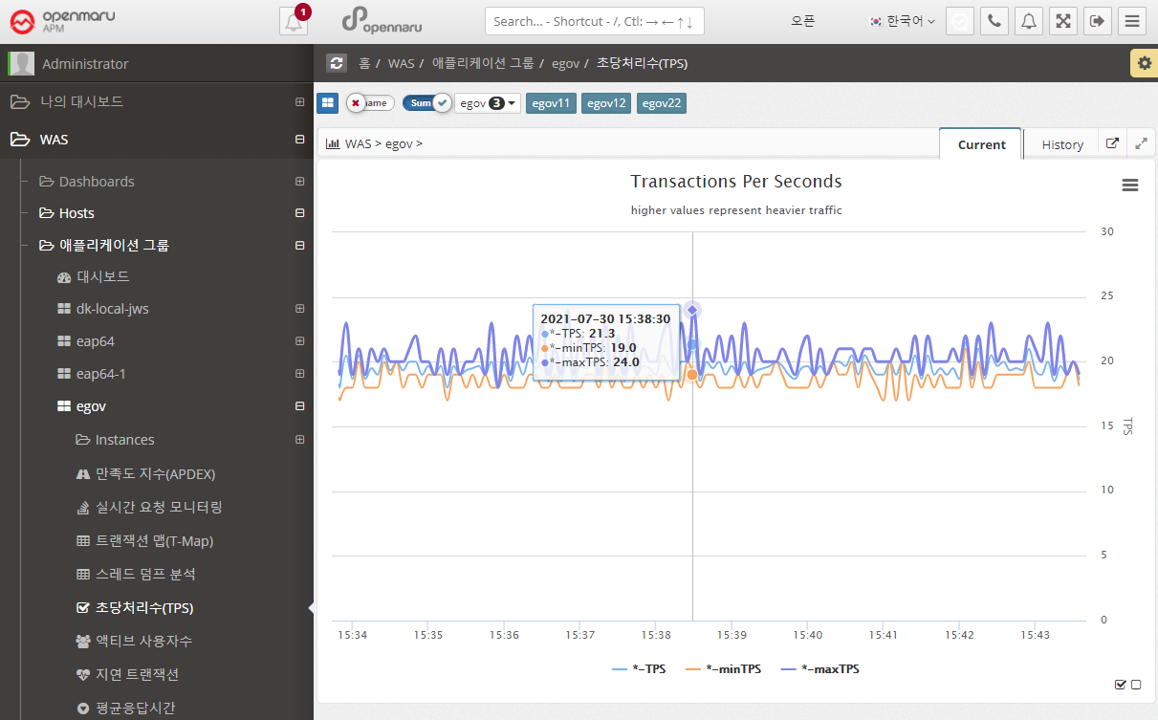
Applications > Transactions Per Second (TPS)
Summarizes and graphically displays the transactions per second (TPS) for all WAS instances that comprise the business system.
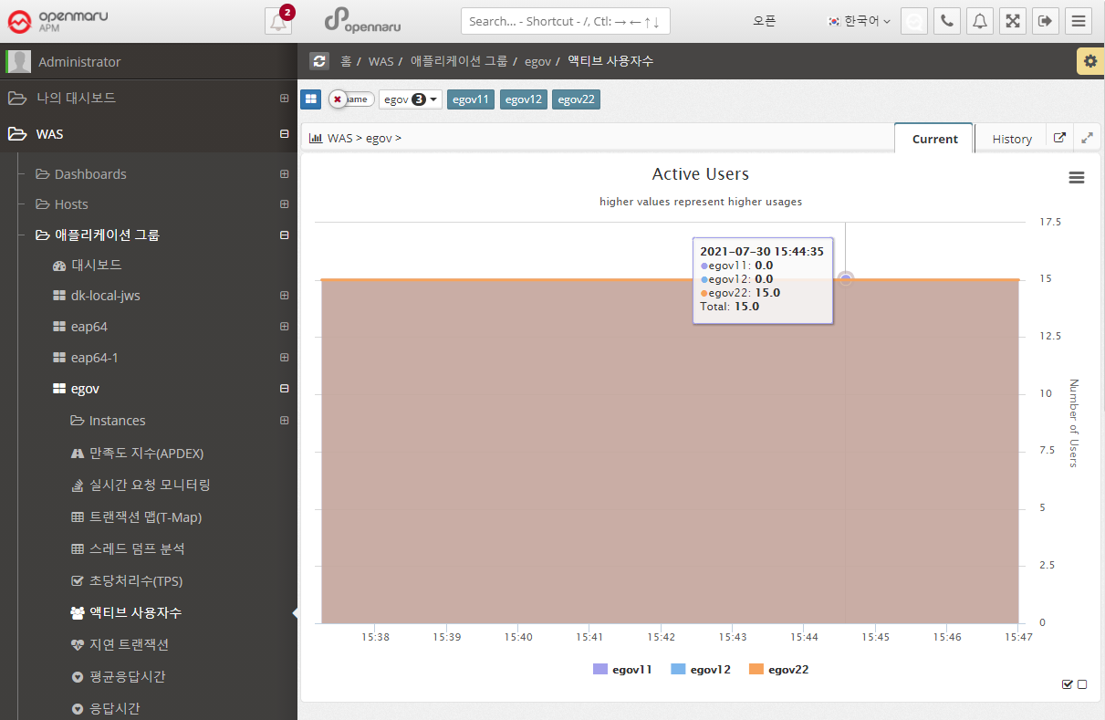
Applications > Active Users
Summarizes and graphs the number of active users (the only users who have made a request in the last 5 minutes) for all WAS instances that make up the business system.
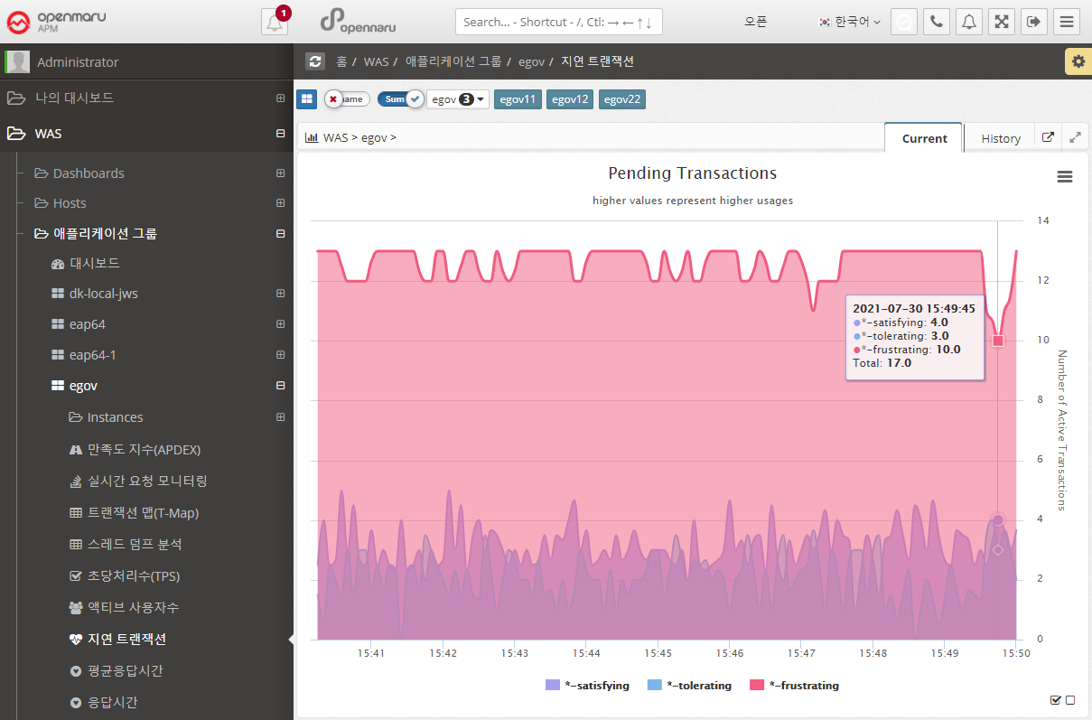
Applications > Lazy Transactions
Displays the latency information of all WAS instances that make up the business system in the form of Satisfying, Tolerating, and Frustrating statistics.
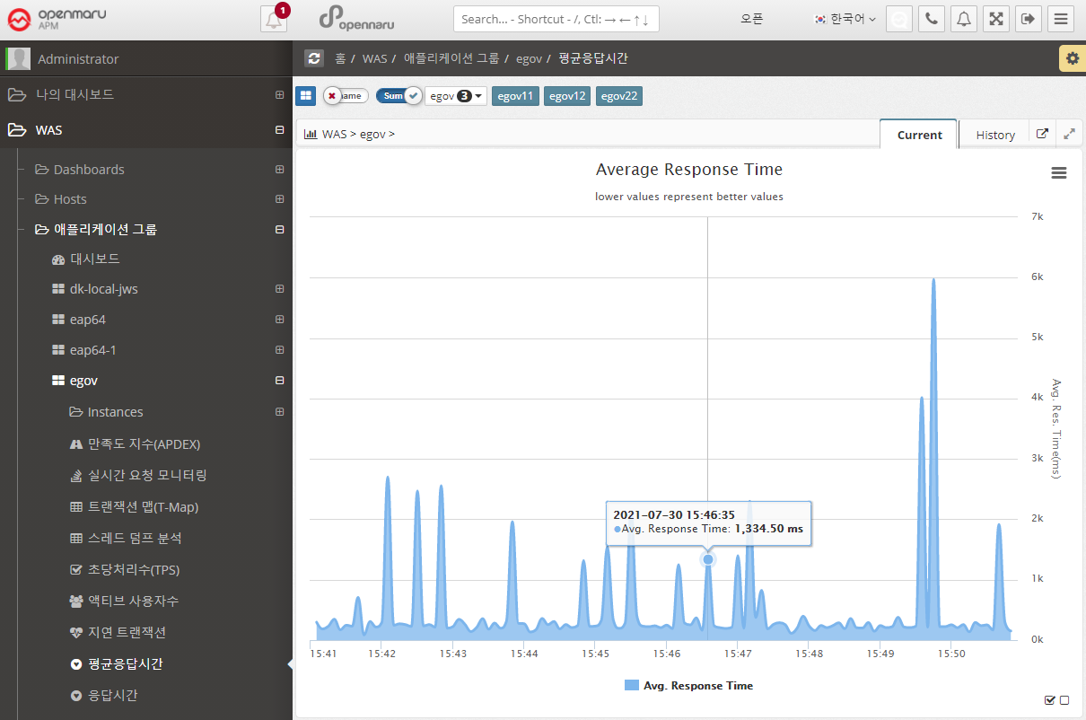
Applications > Average Response Time
Summarizes the average response time of all WAS instances that make up the business system and displays it in a graph.
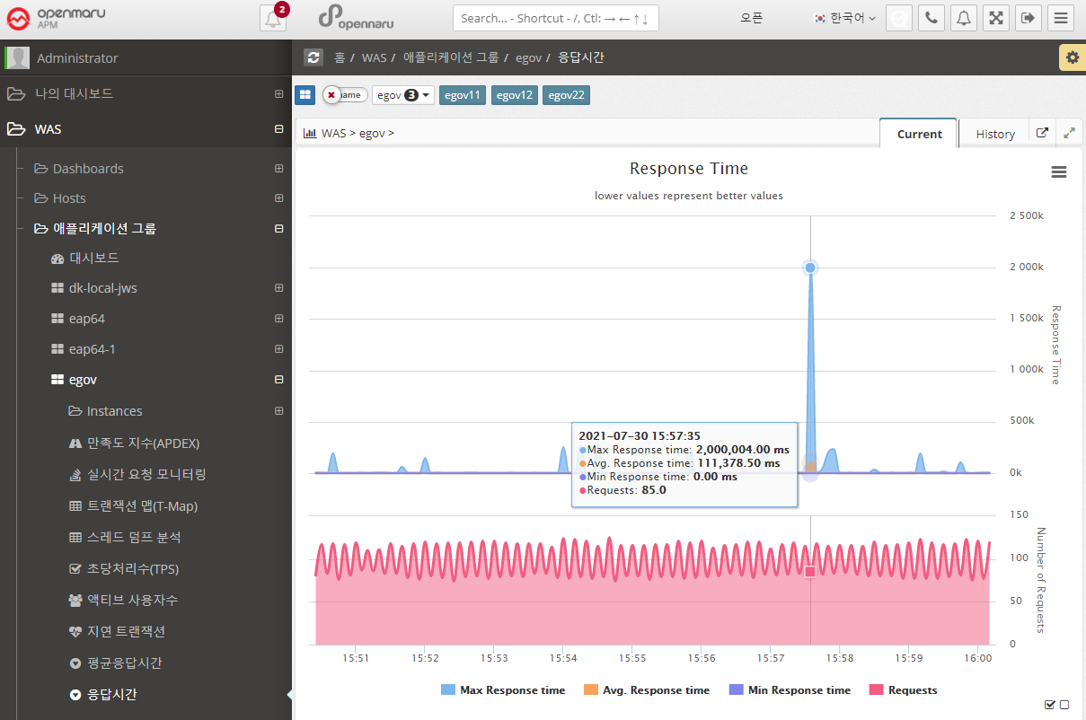
Applications > Response Time
Displays the response time for all WAS instances that make up the business system in a graph with the number of calls, maximum, minimum, and average values.
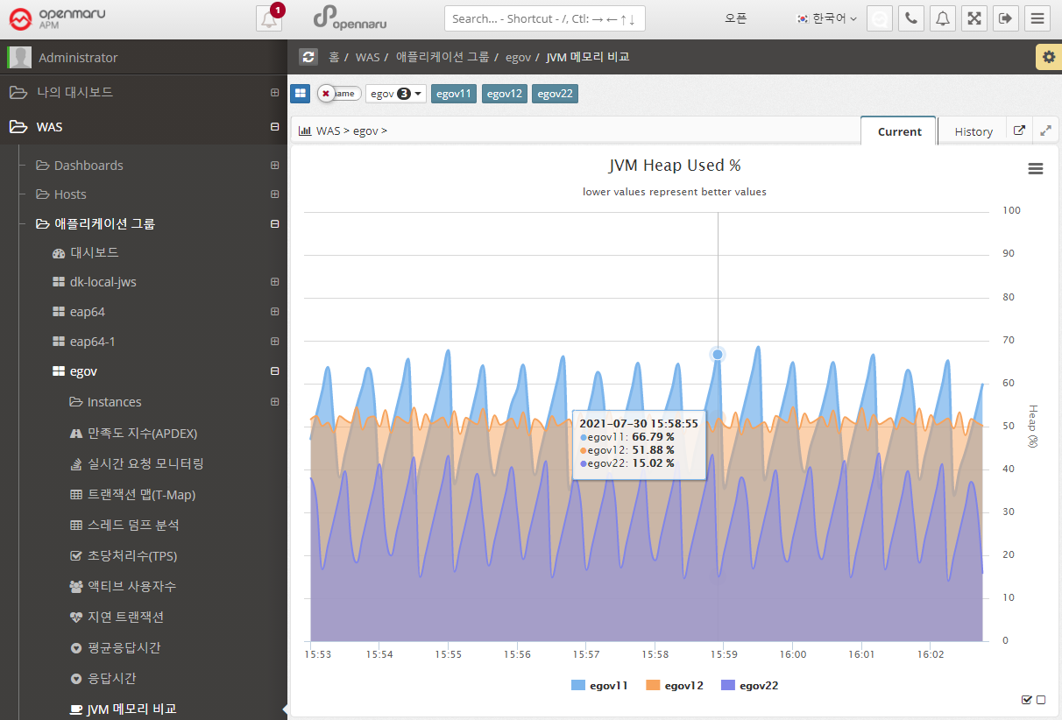
Applications > JVM Memory Comparison
Shows the JVM Heap utilization of all the WAS instances that make up this business system, overlaid for comparison. You can show or hide the graph by clicking on the name shown in the legend of the graph, making it easier to spot instances with memory issues. See "APM Screen Organization and Common Features - Selecting Chart Legends and Exporting Data".