2.10.1 How to respond to server failures with APM
How to analyze when a service is slow
When a service is slow, a thread dump can help you determine the cause. When a service is slowing down, you can use APM’s metrics to understand what’s going on.
-
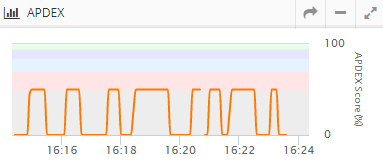
The user satisfaction index (APDEX) is getting lower and lower.
-
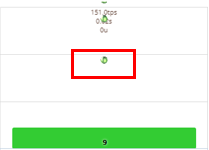
The TPS value decreases and the Average Response Time value increases.
-
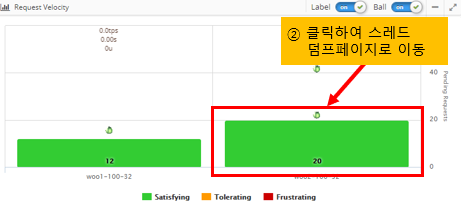
TPS value decreases and Average Response Time increases. Request Velocity’s Pending Requests pile up.
-
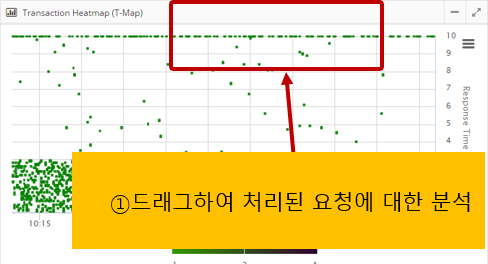
Pending Requests Dots appear at the top of the Transaction Heatmap (T-Map).
How to analyze a thread dump
At this point, getting a thread dump and analyzing it will help you determine the cause of the failure.
Since thread dumps are snapshots of the JVM, it is recommended that you take 5 thread dumps at 3-5 second intervals.
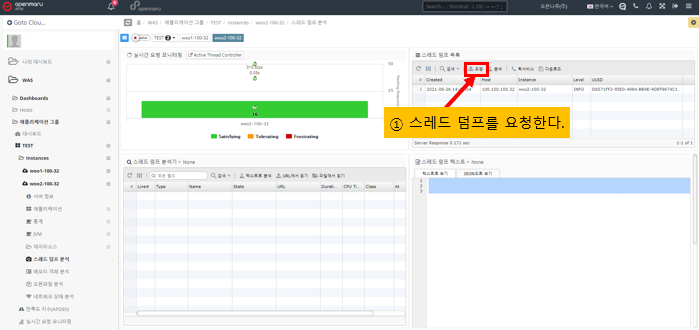
If you see an instance in your dashboard that is accumulating pending requests, click the pending request bar for that instance to be taken directly to the page where you can analyze the thread dump.
-
How to request a thread dump
-
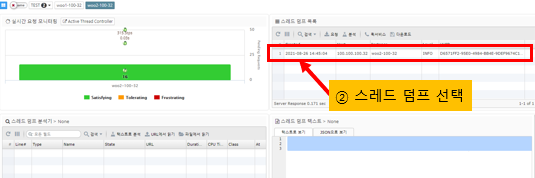
Selecting a thread dump
-
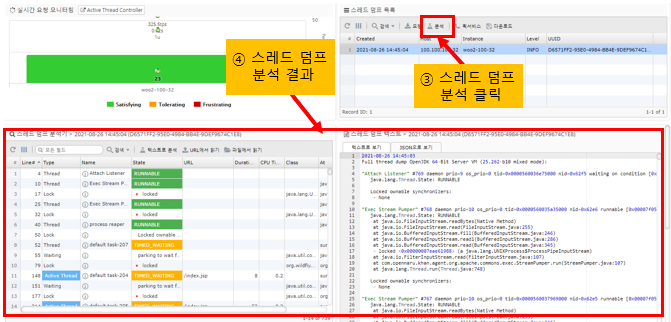
Click the Analyze Thread Dump button
-
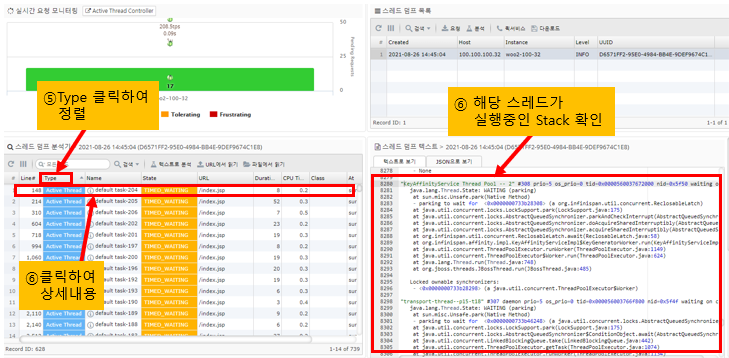
Active Thread is the thread that is currently processing the Request
The Active Thread is the Request that is currently being processed at the time the thread dump is run in APM, as an additional piece of information in the thread dump.
By sorting threads by Active Thread, you can see the URL information that is currently being served, the CPU usage of the application up to the time of the thread dump, and the execution time.
Clicking on a row in the thread dump table on the bottom left will take you to the corresponding line in the thread dump on the bottom right, where you can see the stack information for the application that the thread is currently running.
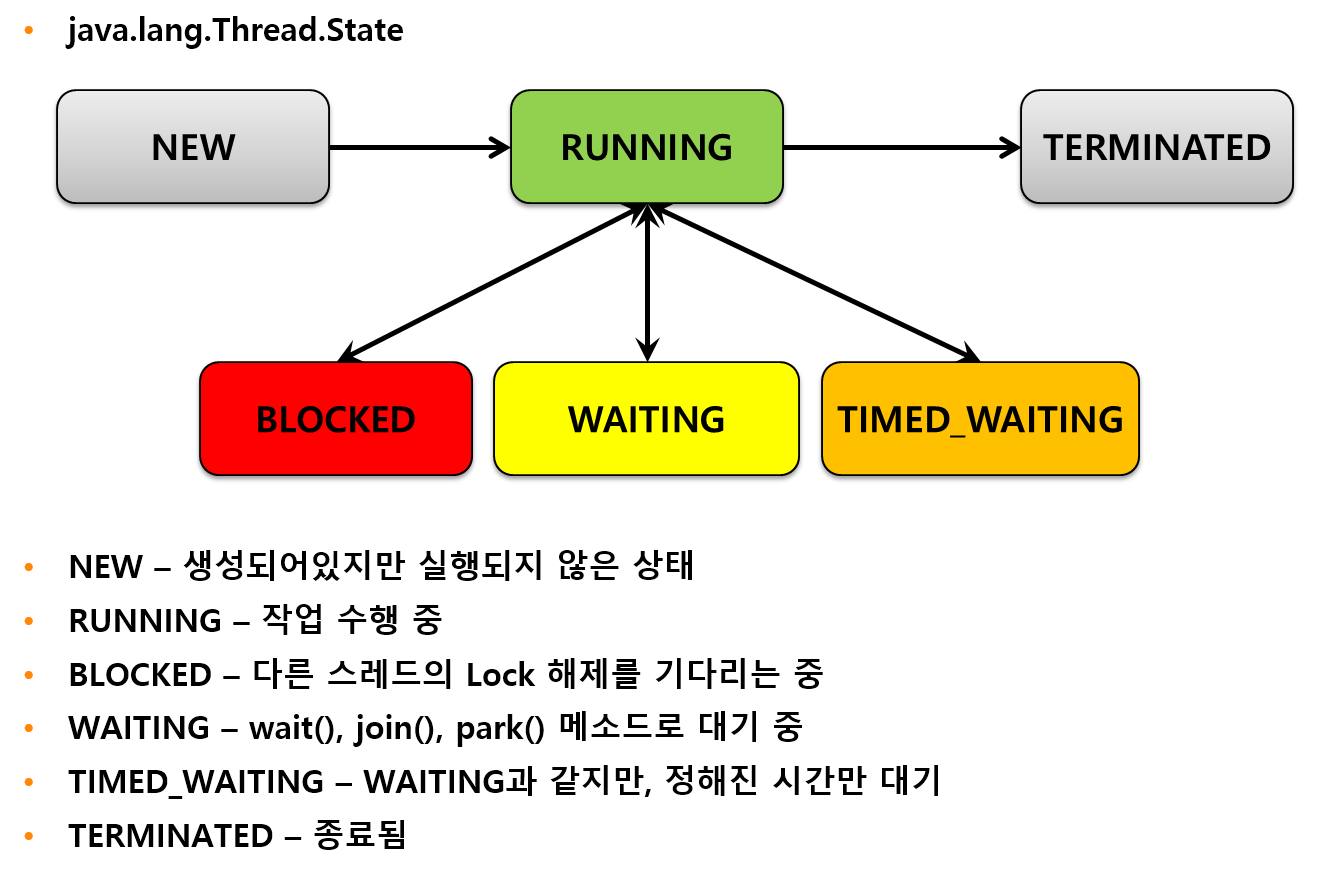
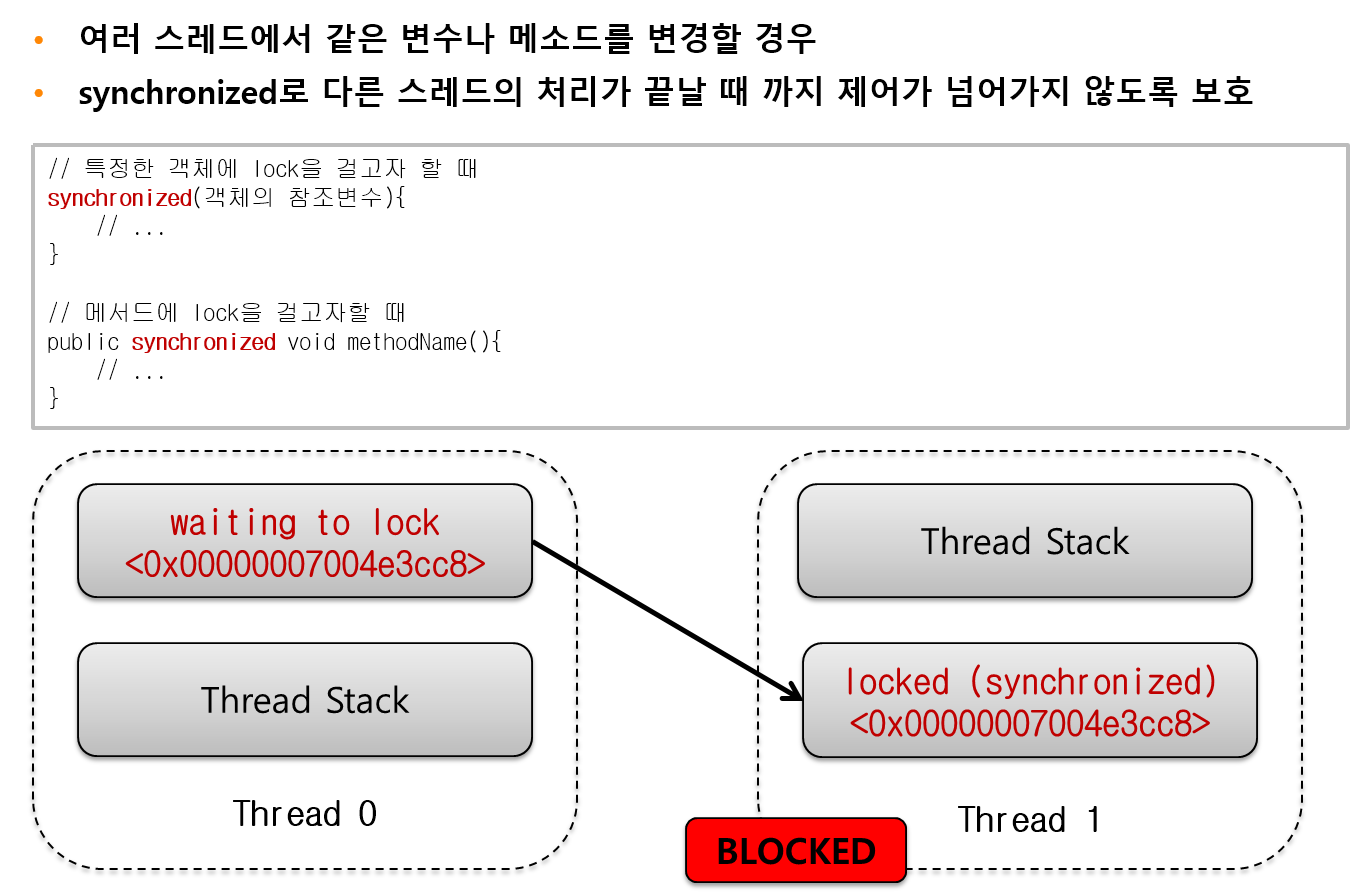
Analyzing Lock Relationships
When multiple threads share a single variable or method, Java’s syntax uses synchronized to prevent them from accessing it at the same time. If you see BLOCKED in a thread dump, it means that the thread that holds the lock has to wait for the other thread to release the lock, potentially slowing down the system.
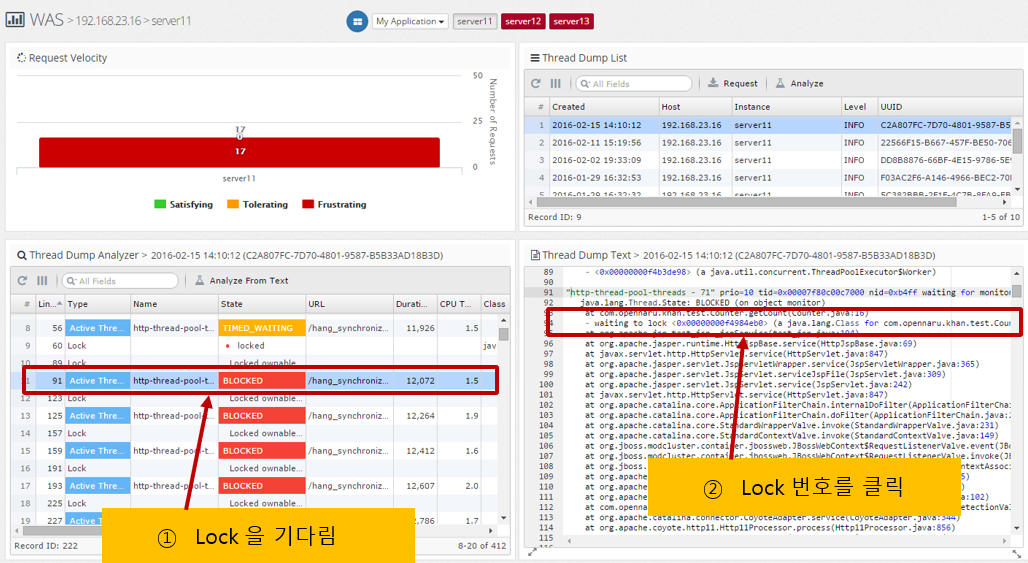
In APM’s thread dump analysis, it is labeled BLOCKED as shown below, and if you click on the column, the waiting lock information is displayed, such as waiting to lock <0x0000….>.
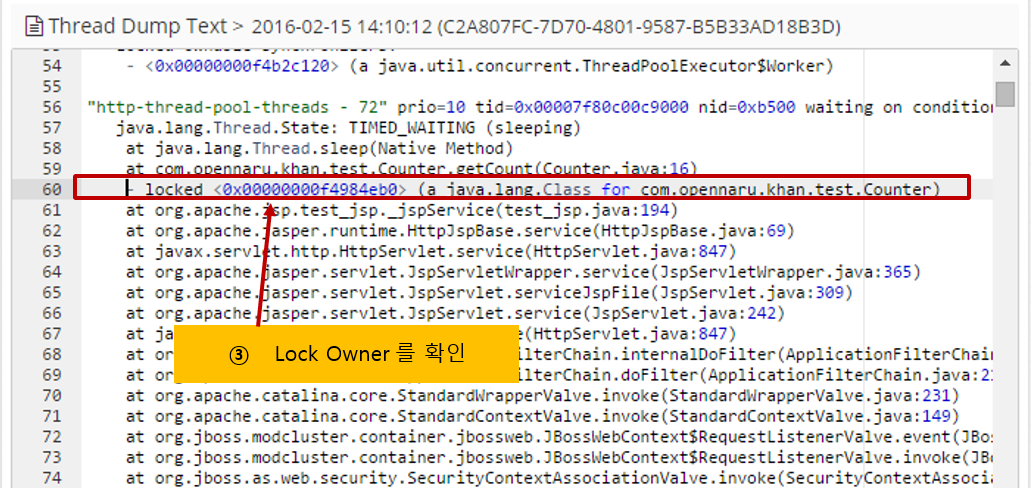
Here, you can click the lock number to go to the thread that holds the lock.
You can analyze it with the following procedure.
How to display methods in the trace that you are curious about the execution speed of the application you are developing?
If you are curious about the execution speed of the application you are developing in production, simply add the @TraceMethod annotation to your code and it will be added to the Transaction Trace item in APM to check the execution time of the method.
-
Download and compile the APM API.
$ mvn install
Alternatively, you can download the compiled JAR from the following URL.
-
Add a dependency to your pom.xml file.
Add the dependency as follows
<dependency>

	<groupId>com.opennaru.khan</groupId>

	<artifactId>khan-monitoring-api</artifactId>

	<version>1.3.0</version>

</dependency>-
Using the @TraceMethod annotation.
Call a class named Test in the JAX-RS method like below.
package com.opennaru.rest;

import javax.ws.rs.GET;

import javax.ws.rs.Path;

import javax.ws.rs.PathParam;

import javax.ws.rs.core.Response;

@Path("/users")
public class UserRestService {

	@GET
	public Response getUser() throws Exception {

		Thread.sleep(1000);

		Test test = new Test();

		test.test();

		Thread.sleep(1000);

		Test2 test2 = new Test2();

		test2.test();

		Thread.sleep(1000);

		return Response.status(200).entity("getUser is called").build();

	}

}-
Add the @TraceMethod annotation to the test() method of the Test class.
package com.opennaru.rest;

*import com.opennaru.khan.agent.instrument.TraceMethod;*

public class Test {

	public Test() {

	}

	*@TraceMethod*

	public void test() {

		try {

			System.out.println("start test");

			Thread.sleep(1000);

			new Test2().test();

			System.out.println("end test");

		} catch(Exception e) {

			e.printStackTrace();

		}

	}

}-
The Transaction Trace item shows the execution time of the Test.test() method with the @TraceMethod annotation as follows.
===========================================================================

[Num.][ Start Time |Elapsed| % | B-Gab|Exclusi| A-Gab| CPUTime] Method Call

---------------------------------------------------------------------------

[ 1][18:25:09.342| 6,327| 100| 0| 5| 0| 0.0]+ org.apache.catalina.connector.CoyoteAdapter.service()

[ 2][18:25:09.346| 6,322| 100| 0| 237| 6,085| 0.0] + org.jboss.resteasy.plugins.server.servlet.HttpServletDispatcher.service()

*[ 3][18:25:09.557| 6,085| 96| 0| 3,080| 3,005| 0.0] + @GET com.opennaru.rest.UserRestService.getUser() *

*[ 4][18:25:10.634| 2,004| 32| 0| 1,003| 1,001| 0.0] + @TraceMethod com.opennaru.rest.Test.test() *

[ 5][18:25:11.636| 1,001| 16| 0| 1,001| 0| 0.0] + @TraceMethod com.opennaru.rest.Test2.test()

[ 6][18:25:13.638| 1,001| 16| 0| 1,001| 0| 0.0] + @TraceMethod com.opennaru.rest.Test2.test()