2.4.9 DBMS Monitoring: Query Information
Slow queries
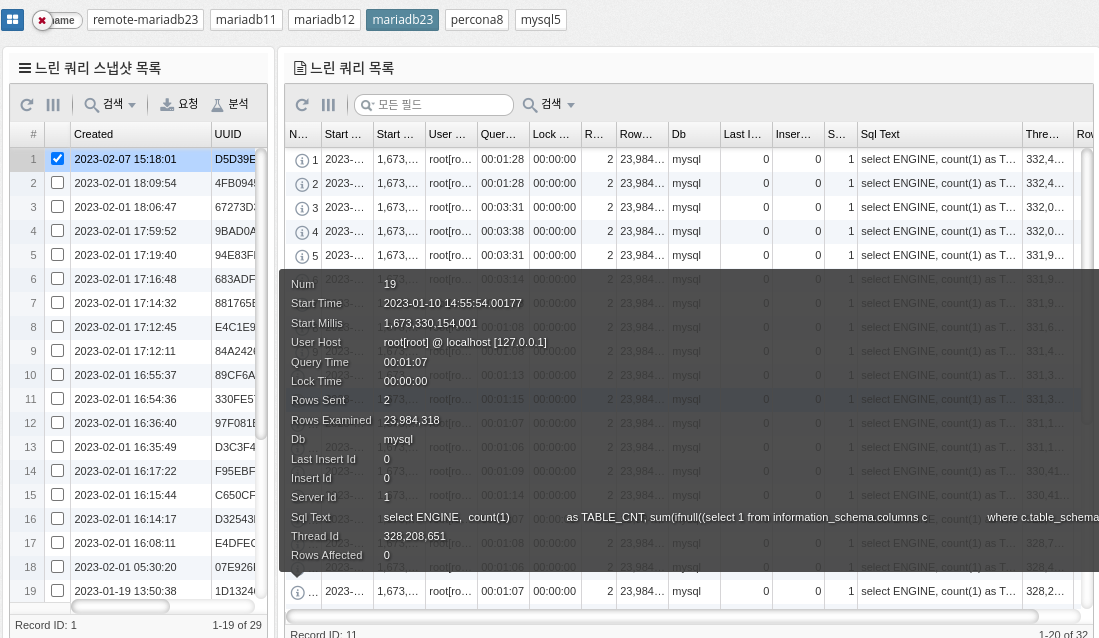
The slow_log table in MySQL is a log file that tracks slow running queries in the database. It is used to diagnose and improve database performance by identifying the source of slow-running queries.
The slow_log table stores information about each slow query, such as the start time, execution time, SQL statements, and number of rows processed. You can use this information to identify which queries are taking too long to execute and what changes you need to make to improve performance.
To enable the slow_log table in MySQL, you need to modify the my.cnf file or my.ini file on Windows and add the following line.
[mysqld]
slow_query_log=1
slow_query_log_file=<path to the file>.
long_query_time=<time in seconds>.
The "slow_query_log" parameter enables the slow query log, the "slow_query_log_file" parameter specifies the path to the slow query log file, and the "long_query_time" parameter sets the threshold time in seconds for defining a slow query.
The slow_log table is a useful tool for database administrators to optimize database performance and improve query performance.
Memory usage by account
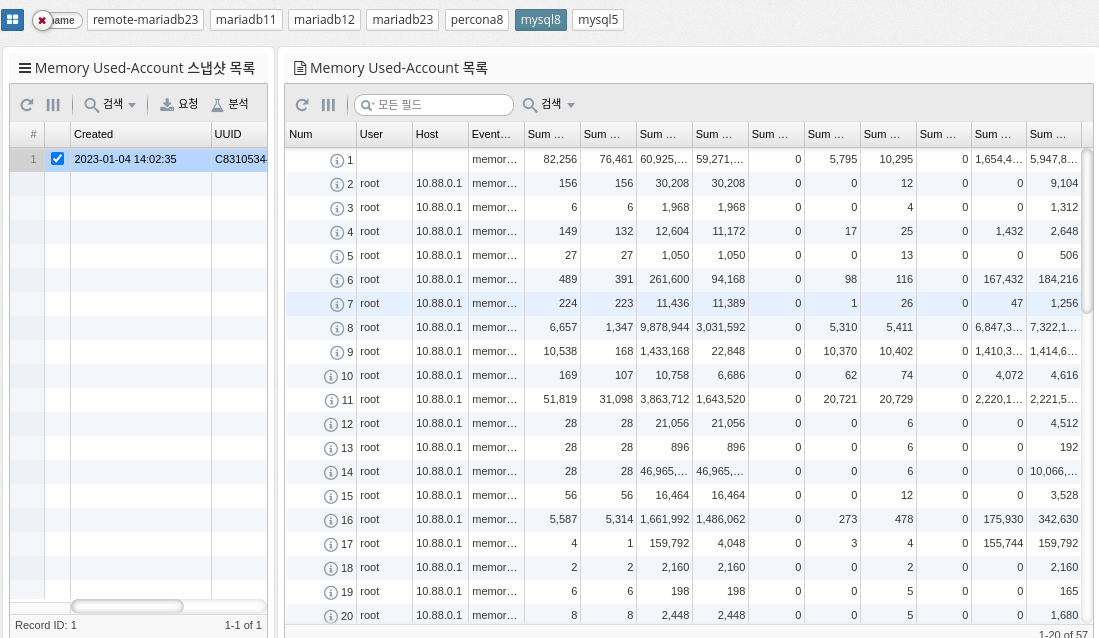
MySQL’s "memory_summary_by_account_by_event_name" represents a query that summarizes the memory usage of different accounts in the database by event name. It provides a breakdown of how much memory is used by each account and what types of events (queries, table operations, etc.) consume the most memory.
This information can be useful for database administrators to identify areas where memory usage should be optimized or resources should be allocated differently. You can run the query by running a SELECT statement with a group by clause against relevant database tables and columns, such as the "performance_schema.memory_summary_by_thread_by_event_name" table.
The query output provides a summary of the total memory used by each account, categorized by event name. You can use this information to identify areas where you can improve performance, such as optimizing database queries, reducing the amount of data stored, or adding additional resources.
| Supported by mysql, percona 8.0 and later, and mariadb 10.5.2 and later. |
Memory Usage by Host
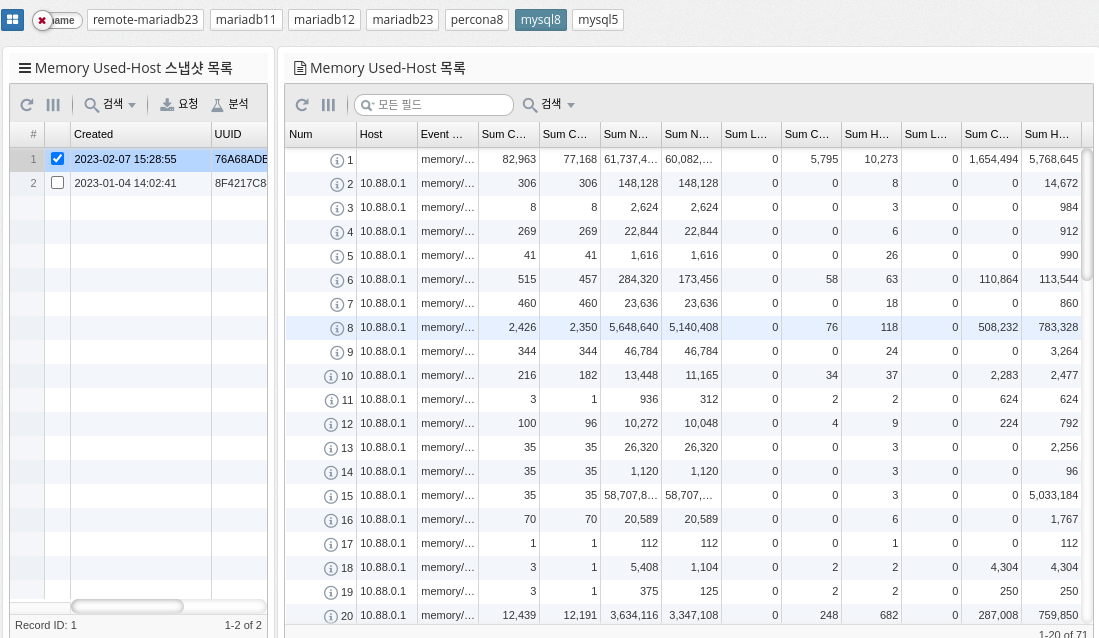
memory_summary_by_host_by_event_name is a performance schema table in MySQL that provides information about memory usage for various events grouped by host. This table is part of the performance schema, a feature of MySQL that provides real-time information about server performance.
The memory_summary_by_host_by_event_name table contains information about the amount of memory allocated and used by each event and the number of instances of the event that were executed. This information can be useful for identifying which events consume the most memory, which can be useful for identifying performance bottlenecks and improving the performance of your server.
Some of the columns in the memory_summary_by_host_by_event_name table are.
-
host: Host name of the server on which the event ran
-
event_name: The name of the event
-
sum_alloc: The total amount of memory allocated by the event instance
-
sum_free: The total amount of memory freed by the event instance
-
current_alloc: The current amount of memory allocated by the event instance
-
current_free: The current amount of memory freed by the event instance
-
count_alloc: Number of memory allocations by event instance
-
count_free: the amount of memory freed by the event instance
In summary, the memory_summary_by_host_by_event_name table provides important information about the memory usage of server events that can be useful for identifying performance bottlenecks and improving server performance.
| Supported by mysql, percona 8.0 and later, and mariadb 10.5.2 and later. |
Memory Usage by Thread
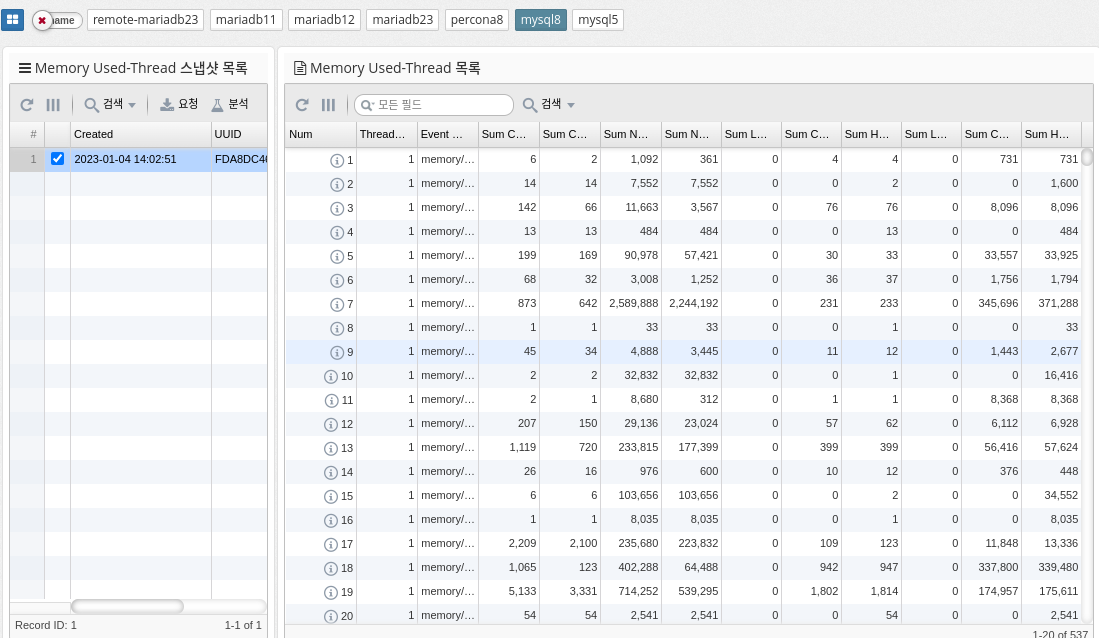
memory_summary_by_thread_by_event_name is a table in MySQL’s performance_schema that provides memory usage statistics for each thread on the server, categorized by event name. The table shows the amount of memory used by each thread, grouped by the type of event it is running (for example, parsing SQL statements, executing stored procedures, and so on).
The columns in this table include
-
THREAD_ID: The unique identifier of the thread.
-
EVENT_NAME: The name of the type of event the thread is running.
-
COUNT_ALLOC: The number of memory allocations for this event type and thread.
-
SUM_NUMBER_OF_BYTES_ALLOC: The total number of bytes allocated for this event type and thread.
-
AVG_BYTES_ALLOC: The average number of bytes allocated for each allocation of this event type and thread.
This table can be useful for determining which threads are using the most memory and which event types are contributing to that usage. Database administrators can analyze the data in this table to identify areas where memory can be over-allocated or freed to optimize memory usage.
| Supported by mysql, percona 8.0 and later, and mariadb 10.5.2 and later. |
Memory Usage by User
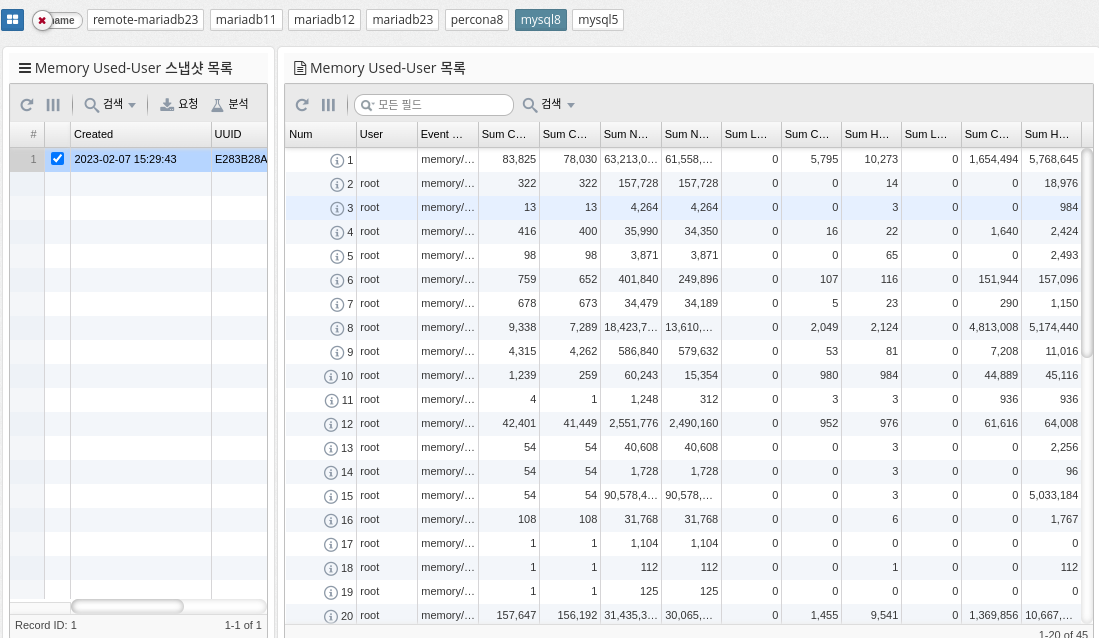
Memory_summary_by_user_by_event_name is a metric in MySQL that provides a summary of memory usage by user and event name. It helps you monitor the amount of memory consumed by different users and events within your database. This information is useful for identifying performance issues and managing database resources efficiently.
The memory_summary_by_user_by_event_name metric provides information about the following aspects of memory usage.
By regularly monitoring this metric, database administrators can identify performance bottlenecks and optimize resource utilization by adjusting query execution plans or tuning database configuration.
| Supported by mysql, percona 8.0 and later, and mariadb 10.5.2 and later. |
Memory Usage by Event
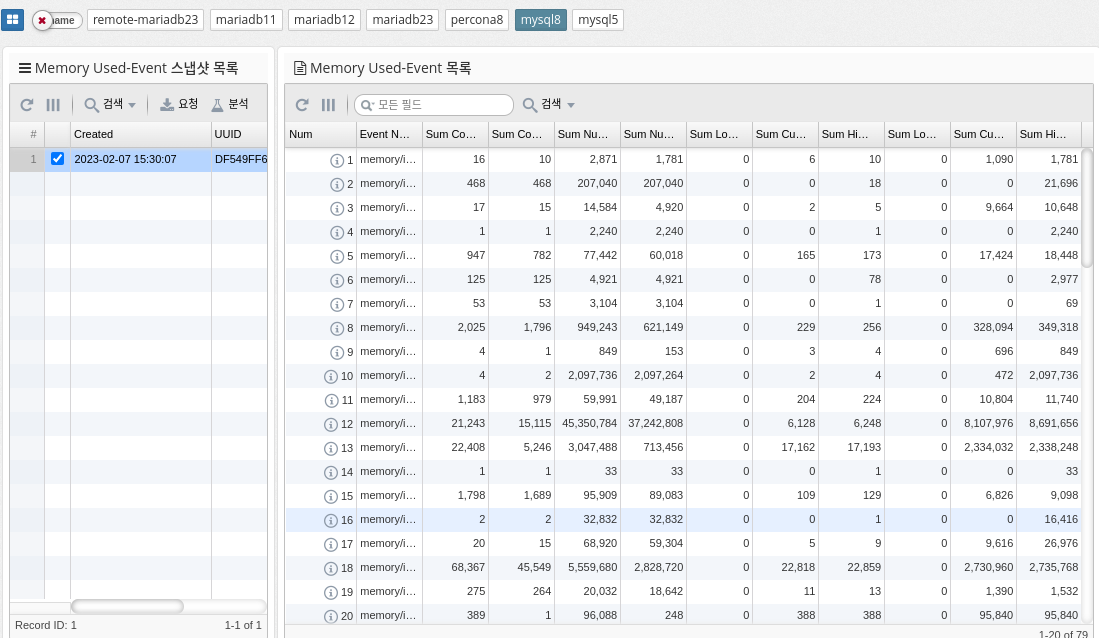
MySQL’s memory_summary_global_by_event_name references a performance schema table that provides information about memory usage by various events on the MySQL server. This table stores data about memory usage for various events and categories of events, such as memory used for sorting, memory used for hash tables, memory used to store query results, and so on. The data in this table is aggregated at a global level and can be used to identify the largest memory consumers on your MySQL server. This information is useful for optimizing memory usage and improving performance.
| Supported by mysql, percona 8.0 and later, and mariadb 10.5.2 and later. |