2.7.1 Warning Policy
This is a menu where you can check the policy settings and events that occurred to alert the operator based on the statistical information of the monitored WAS and system data.
If a warning event occurs for every item, it is likely that too many events will occur, so it is recommended that the warning event is triggered based on real-time statistics so that the warning event is triggered only when there is a real possibility of a problem.
Setting up alerting policies
You can set the alert policy for each WAS instance, Web server, and system.
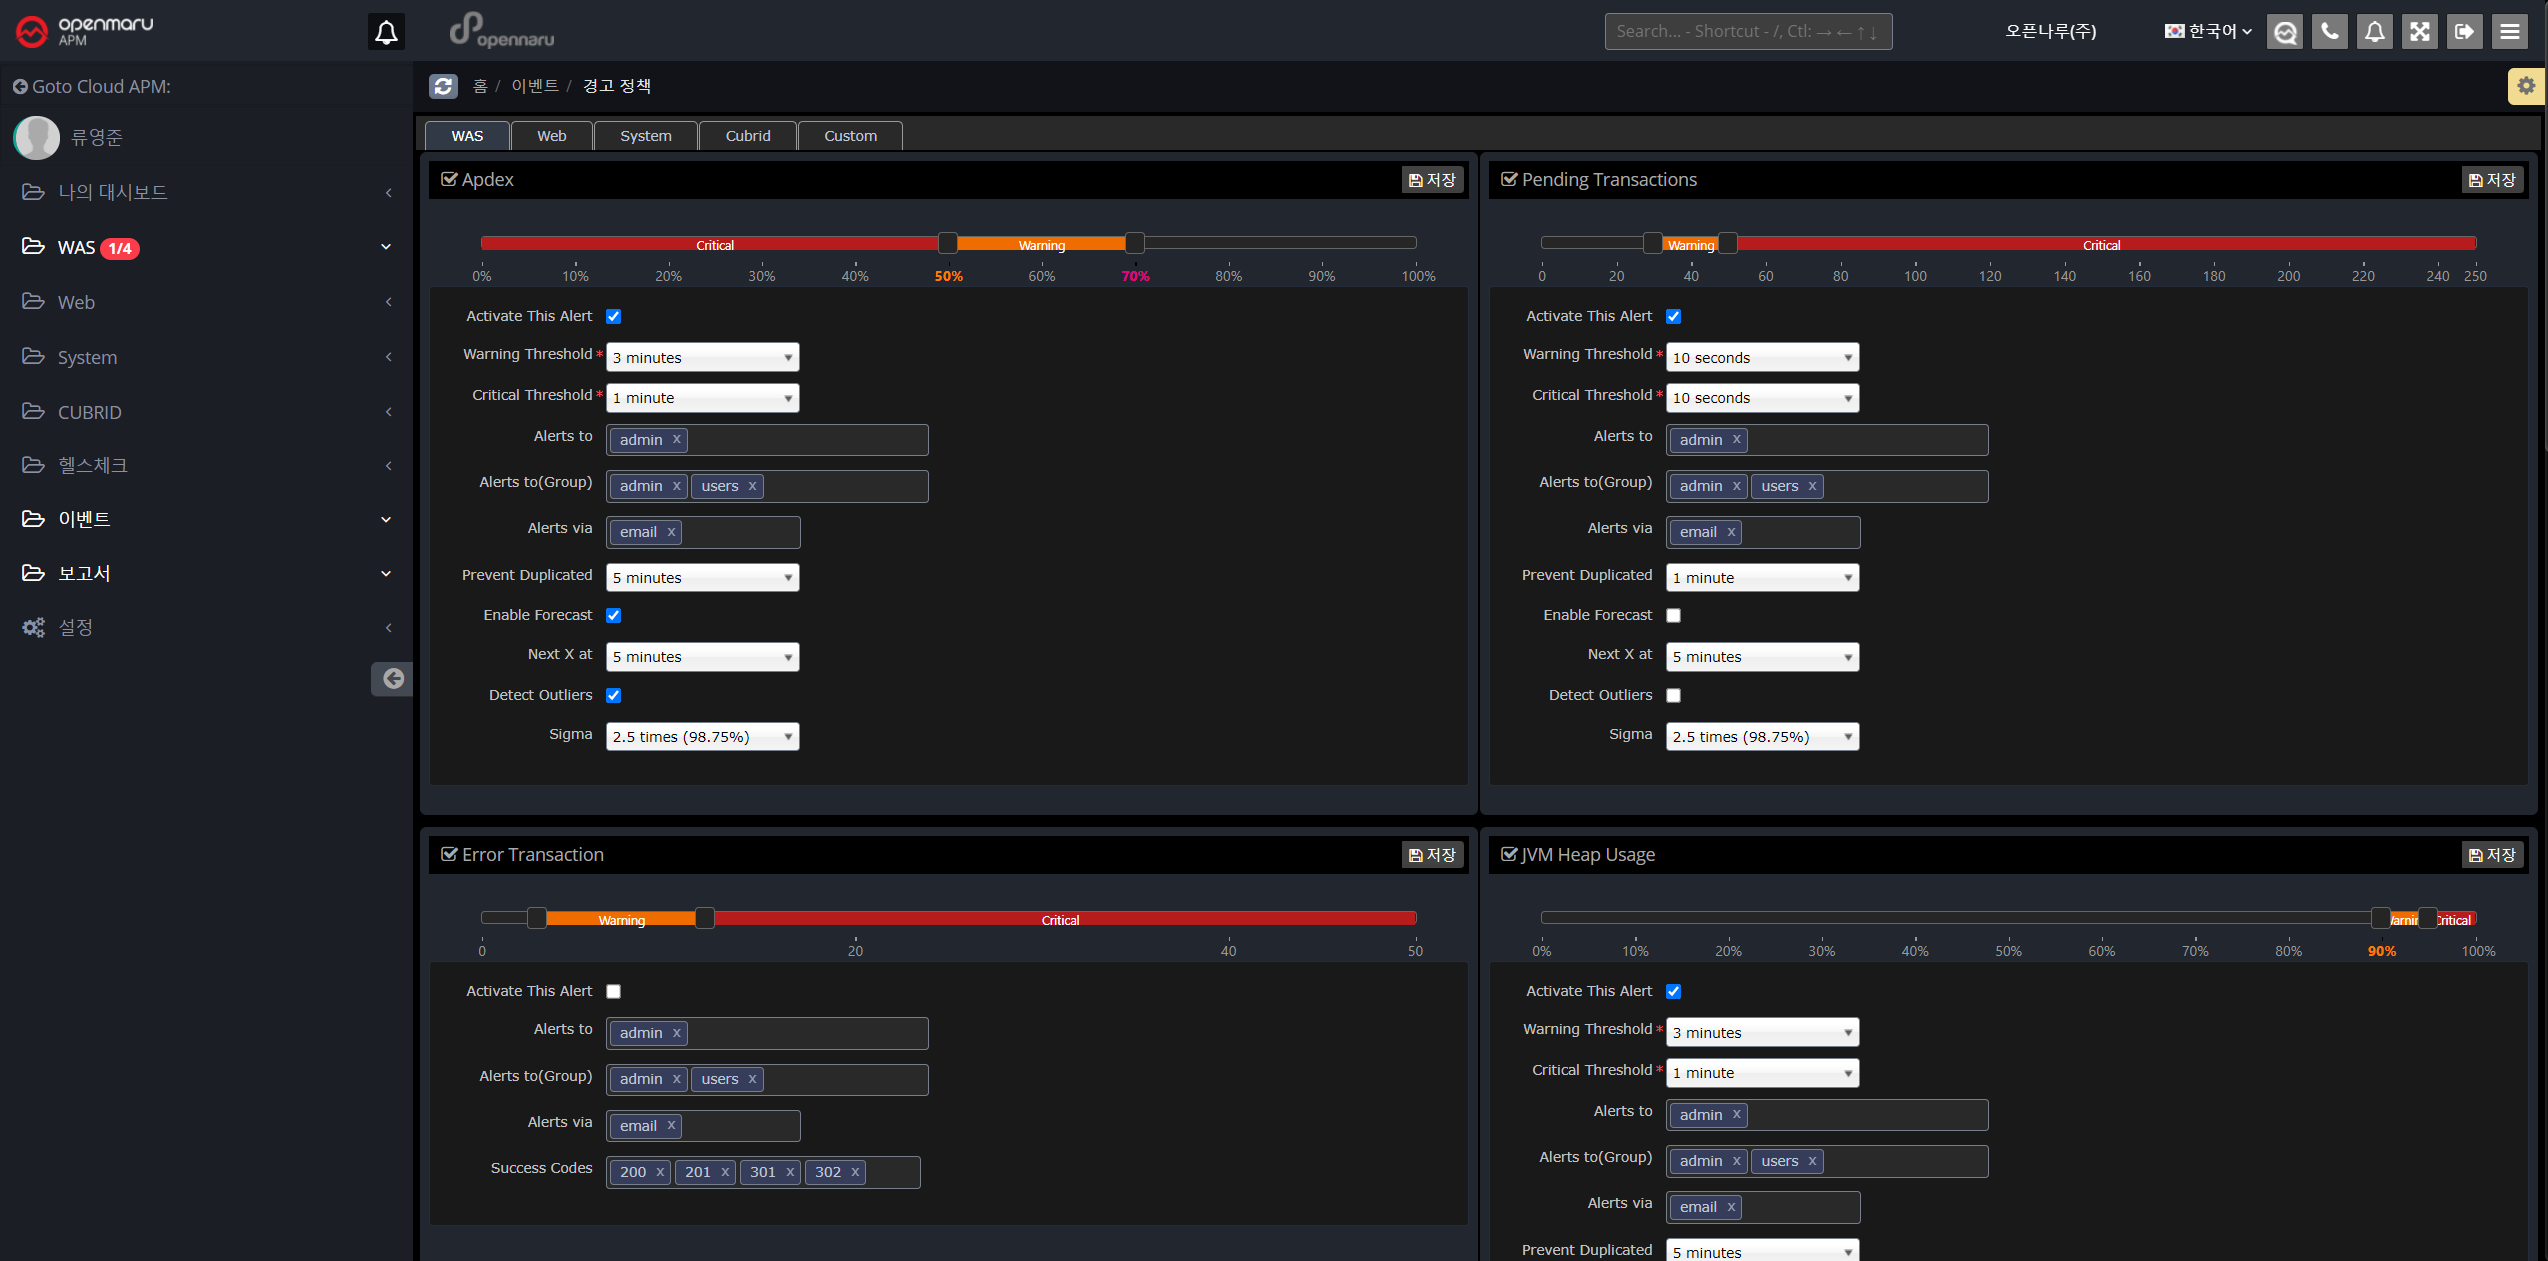
WAS instance warning items
| Item | Description |
|---|---|
User Satisfaction Index (APDEX) |
You can set the warning level to Warning or Critical based on the user satisfaction index (APDEX). |
Pending Transactions |
Set alert policy based on the number of pending transactions. |
Error Transactions |
Set a warning policy based on the number of transaction error states. |
JVM Heap Utilization |
Set the heap utilization of the JVM |
GC Time Percentage |
Set to the percentage of time spent in GC out of the total time. |
Error rate |
Set to the error rate determined by the application’s status code. |
Database query average response time |
Set based on the average response time of database queries. |
Database Connection Pool Utilization |
Set based on the utilization of the database connection pool. |
JVM Perm Utilization |
Set to the utilization of the JVM’s perm area. |
WEB Server Instance Warning Items
| Item | Description |
|---|---|
Worker Utilization |
Set alert policy based on web server resource utilization |
Web Server Traffic |
Set based on the amount of bytes of traffic handled by the web server |
System warning items
| Item | Description |
|---|---|
CPU Utilization |
Set based on your system’s CPU utilization |
Memory Utilization |
Set based on the system’s memory utilization. |
Swap Memory Utilization |
Set based on the system’s swap memory utilization. |
Disk Utilization |
Set based on system disk utilization |
Network Packet Error Rate |
Set based on the error rate of network packets. |
Warning setting items
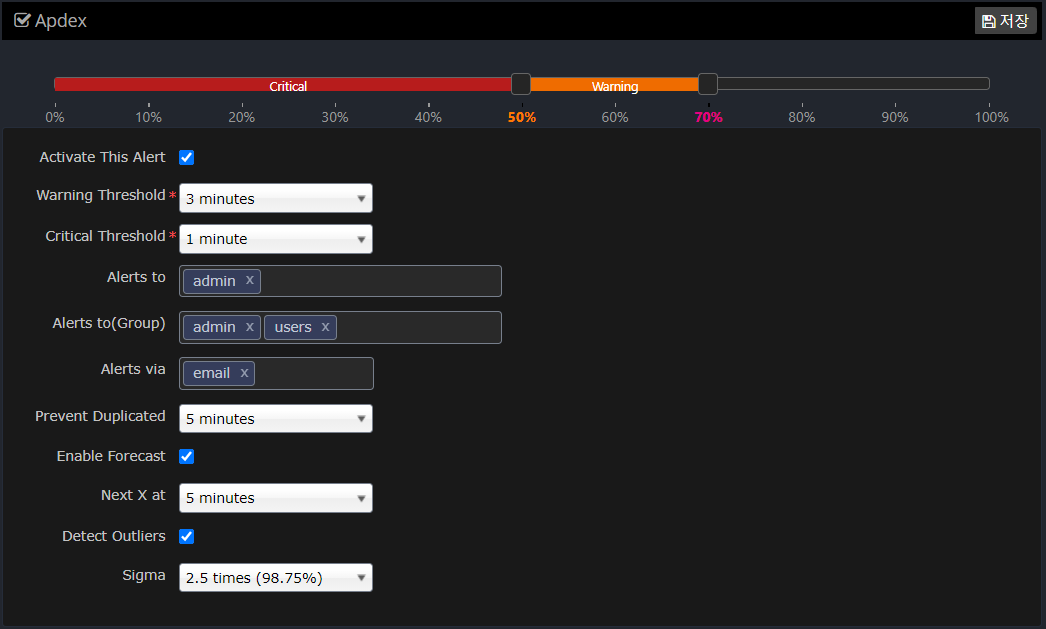
Set each item in the following way.
| Item | Description |
|---|---|
Slider to set the Warn, Critical value |
Set the Warning, Critical value for this item. |
Activate This Alert |
Determines whether to enable this alert item. |
Warning Threshold |
When the average value of the data over a set period of time exceeds the set Warning value, an alert event occurs. |
Critical Threshold |
Fires an alert event when the average value of the data over the set time period exceeds the set Critical value. Generally, the time to determine Critical is set to a smaller value than Warning. |
Alerts to |
Specifies which users to raise the event to. |
Alerts to(Group) |
Specifies which groups to raise the event to. |
Alerts via |
Sets whether the event is notified via email. |
Prevent Duplicated |
Prevent the same event from occurring for a specified amount of time to prevent the same alert event from occurring over and over again. |
Enable Forecast |
Sets whether to enable the Forecast feature. |
Next X at |
Sets the time to forecast. If you set Next X to 5 minutes, the forecast will predict the value in 5 minutes based on statistics and notify you with a forecast alert event. |
Detect Outliers |
Set whether to notify you of outlier values based on real-time statistics. |
Sigma |
Specifies a standard deviation (Sigma) value to alert you when a value outside the range is detected. |
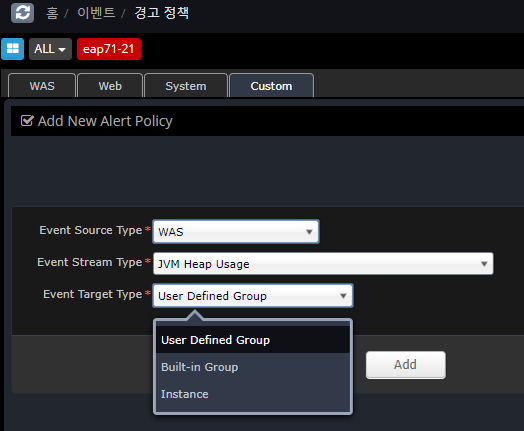
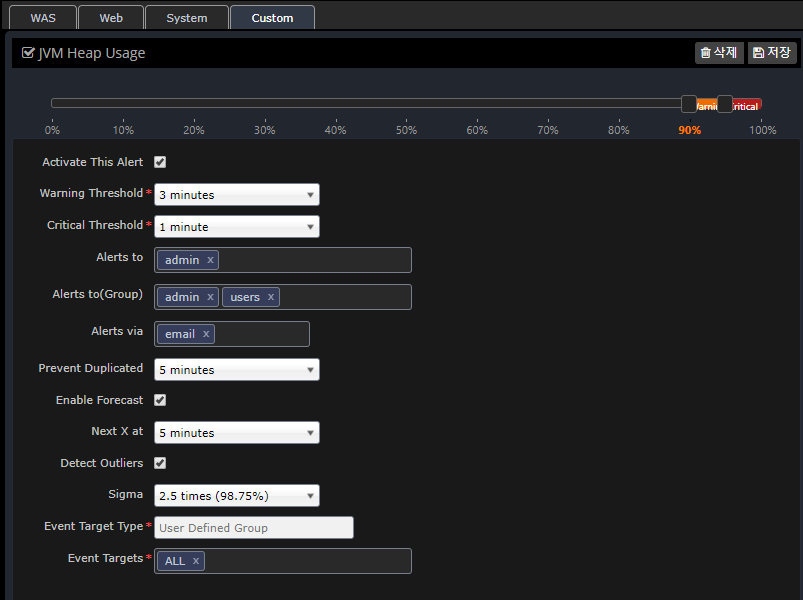
Setting up custom alerts
Alert messages can be customized to be sent to different people for each SYS, WEB, and WAS instance and group.
You can register using the Custom tab as shown below, and if you do not register additional information, it will default to the information registered in the WAS, Web, and System tabs.
In the case of duplicate registration in User Defined Group, Built-in Group, and Instance, the priority is as follows.
-
Instance > User Defined Group > Built-in Group > Preferences (WAS, Web, System)
What is Standard Deviation?
In statistics, the standard deviation is a value that expresses how far apart values are scattered. In statistics, standard deviation is represented by Sigma. For the purposes of setting up warnings, Sigma is the standard deviation.
If the data values are normally distributed, the standard deviation (Sigma) value is represented by the following graph.
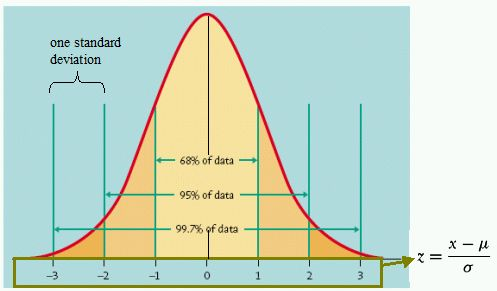
In general, data values will be mostly distributed around the mean. Within 2 standard deviations (Sigma), 95% of the data will be distributed, and within 3 Sigma, 99.7% of the data will be distributed. In other words, most of the data will be within this range.
When applied to monitoring data that changes over time, if you see values outside of these ranges, say 5% at 2 Sigma and 0.3% at 3 Sigma, you know that you’re monitoring data that is statistically out of the ordinary. In statistics, this is known as an outlier.
In OPENMARU APM, we use an algorithm that uses real-time statistics to determine and notify you of outliers for alert settings. This allows you to be alerted as soon as unusual values are collected.
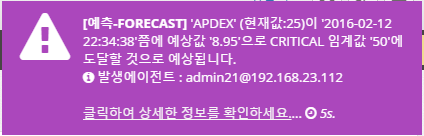
The real-time forecast also uses an algorithm based on these statistics to predict data for the next few minutes and notify you as a warning event.
Types of event messages
Event messages are displayed in the upper right corner of the screen when they occur. The types are as follows
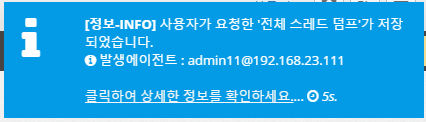
Information - INFO
Displays the following events when the agent is connected and when user-requested commands such as thread dump, open file, and network status analysis are executed.
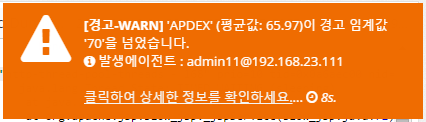
Warnings - WARN
Displays the following event message when an item in the warning policy exceeds the WARN setting. "The current average value XX has crossed the warning threshold 'XX'" and displays the location of the agent where the event occurred.
Clicking on the link will take you to the graph where the event occurred to understand the current state.
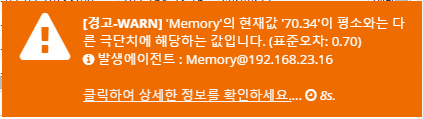
WARN - Extremes
If a value is collected that is an extreme value based on the standard deviation, the following event message will be displayed.
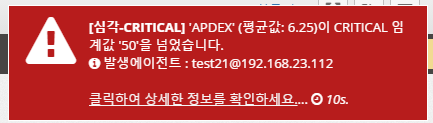
Severe - CRITICAL
Displays the following event message when an item in the alert policy exceeds the CRITICAL setting. "The current average value XX has crossed the warning threshold 'XX'" and displays the location of the agent where the event occurred.
Clicking on the link will take you to the graph where the event occurred to understand the current state.
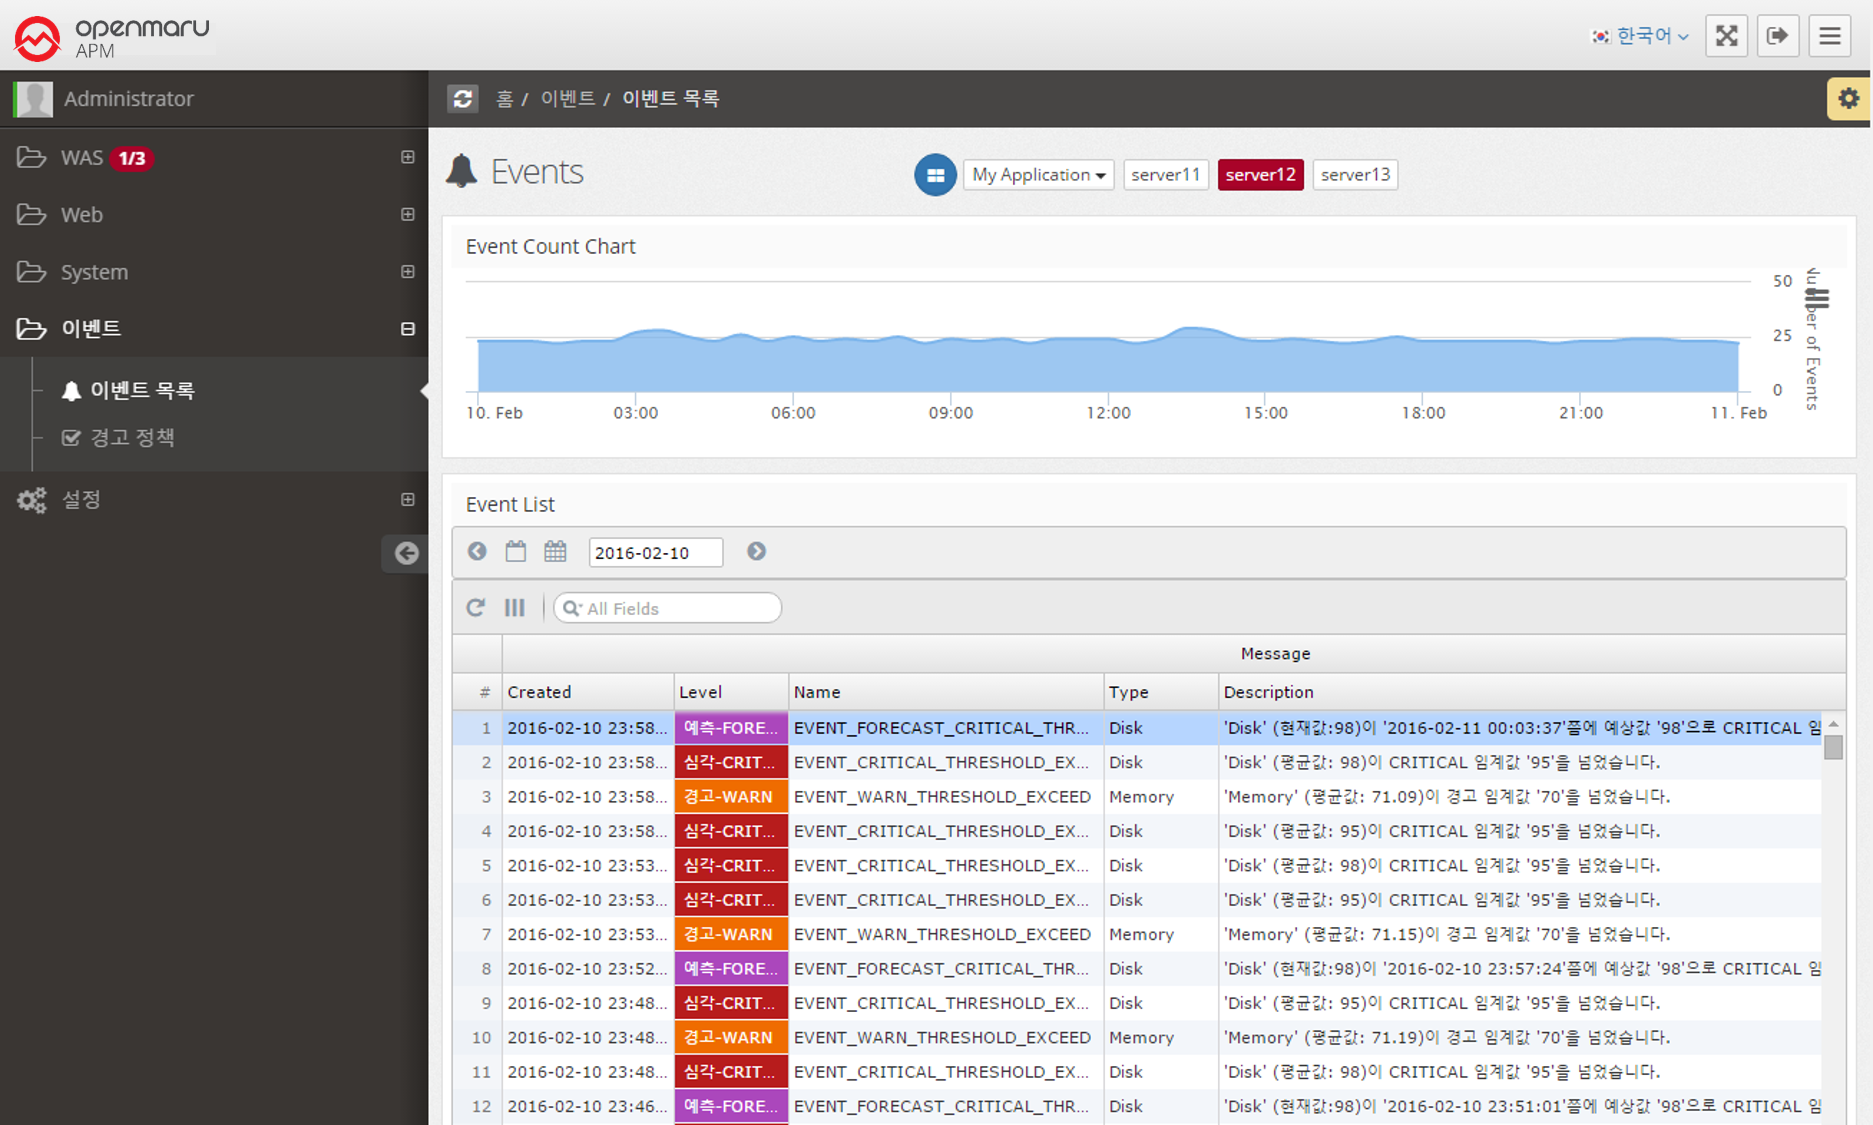
Event list
Provides the ability to search for events that have occurred on a daily basis.
It displays a graph of the number of events over time at the top and a list of events at the bottom.
You can change the date to search for events that occurred on that date, or you can search for events. You can click on a column name in the table to sort by that column to analyze the event data.
How to integrate events
Refer to Event Setup Guide to set up event notifications.