2.1.3 OPENMARU APM Dashboard Screen Configuration
WAS Dashboard
The charts that make up the dashboard of WAS are shown in the following figure. The dashboard is organized by business application.
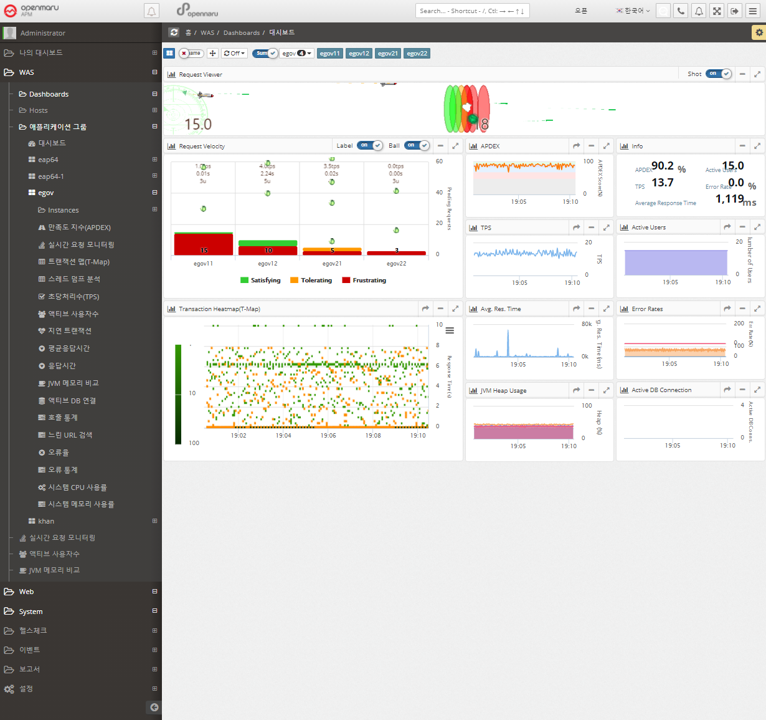
The dashboard displays the Request Velocity Chart, which shows the currently executing requests of individual instances used by the business system, and the Transaction Heatmap (T-Map), User Satisfaction Index (APDEX), Transactions Per Second (TPS), Active Users, Average Response Time, and Error Rate for the entire business system, as well as the Information Widget, which outputs the information as text.
The Request Velocity and Transaction Heatmap (T-Map) information is updated every 2 seconds, and the APDEX, TPS, Active Users, Average Response Time, and Error Rates information is automatically updated every 5 seconds.
Request Velocity Chart
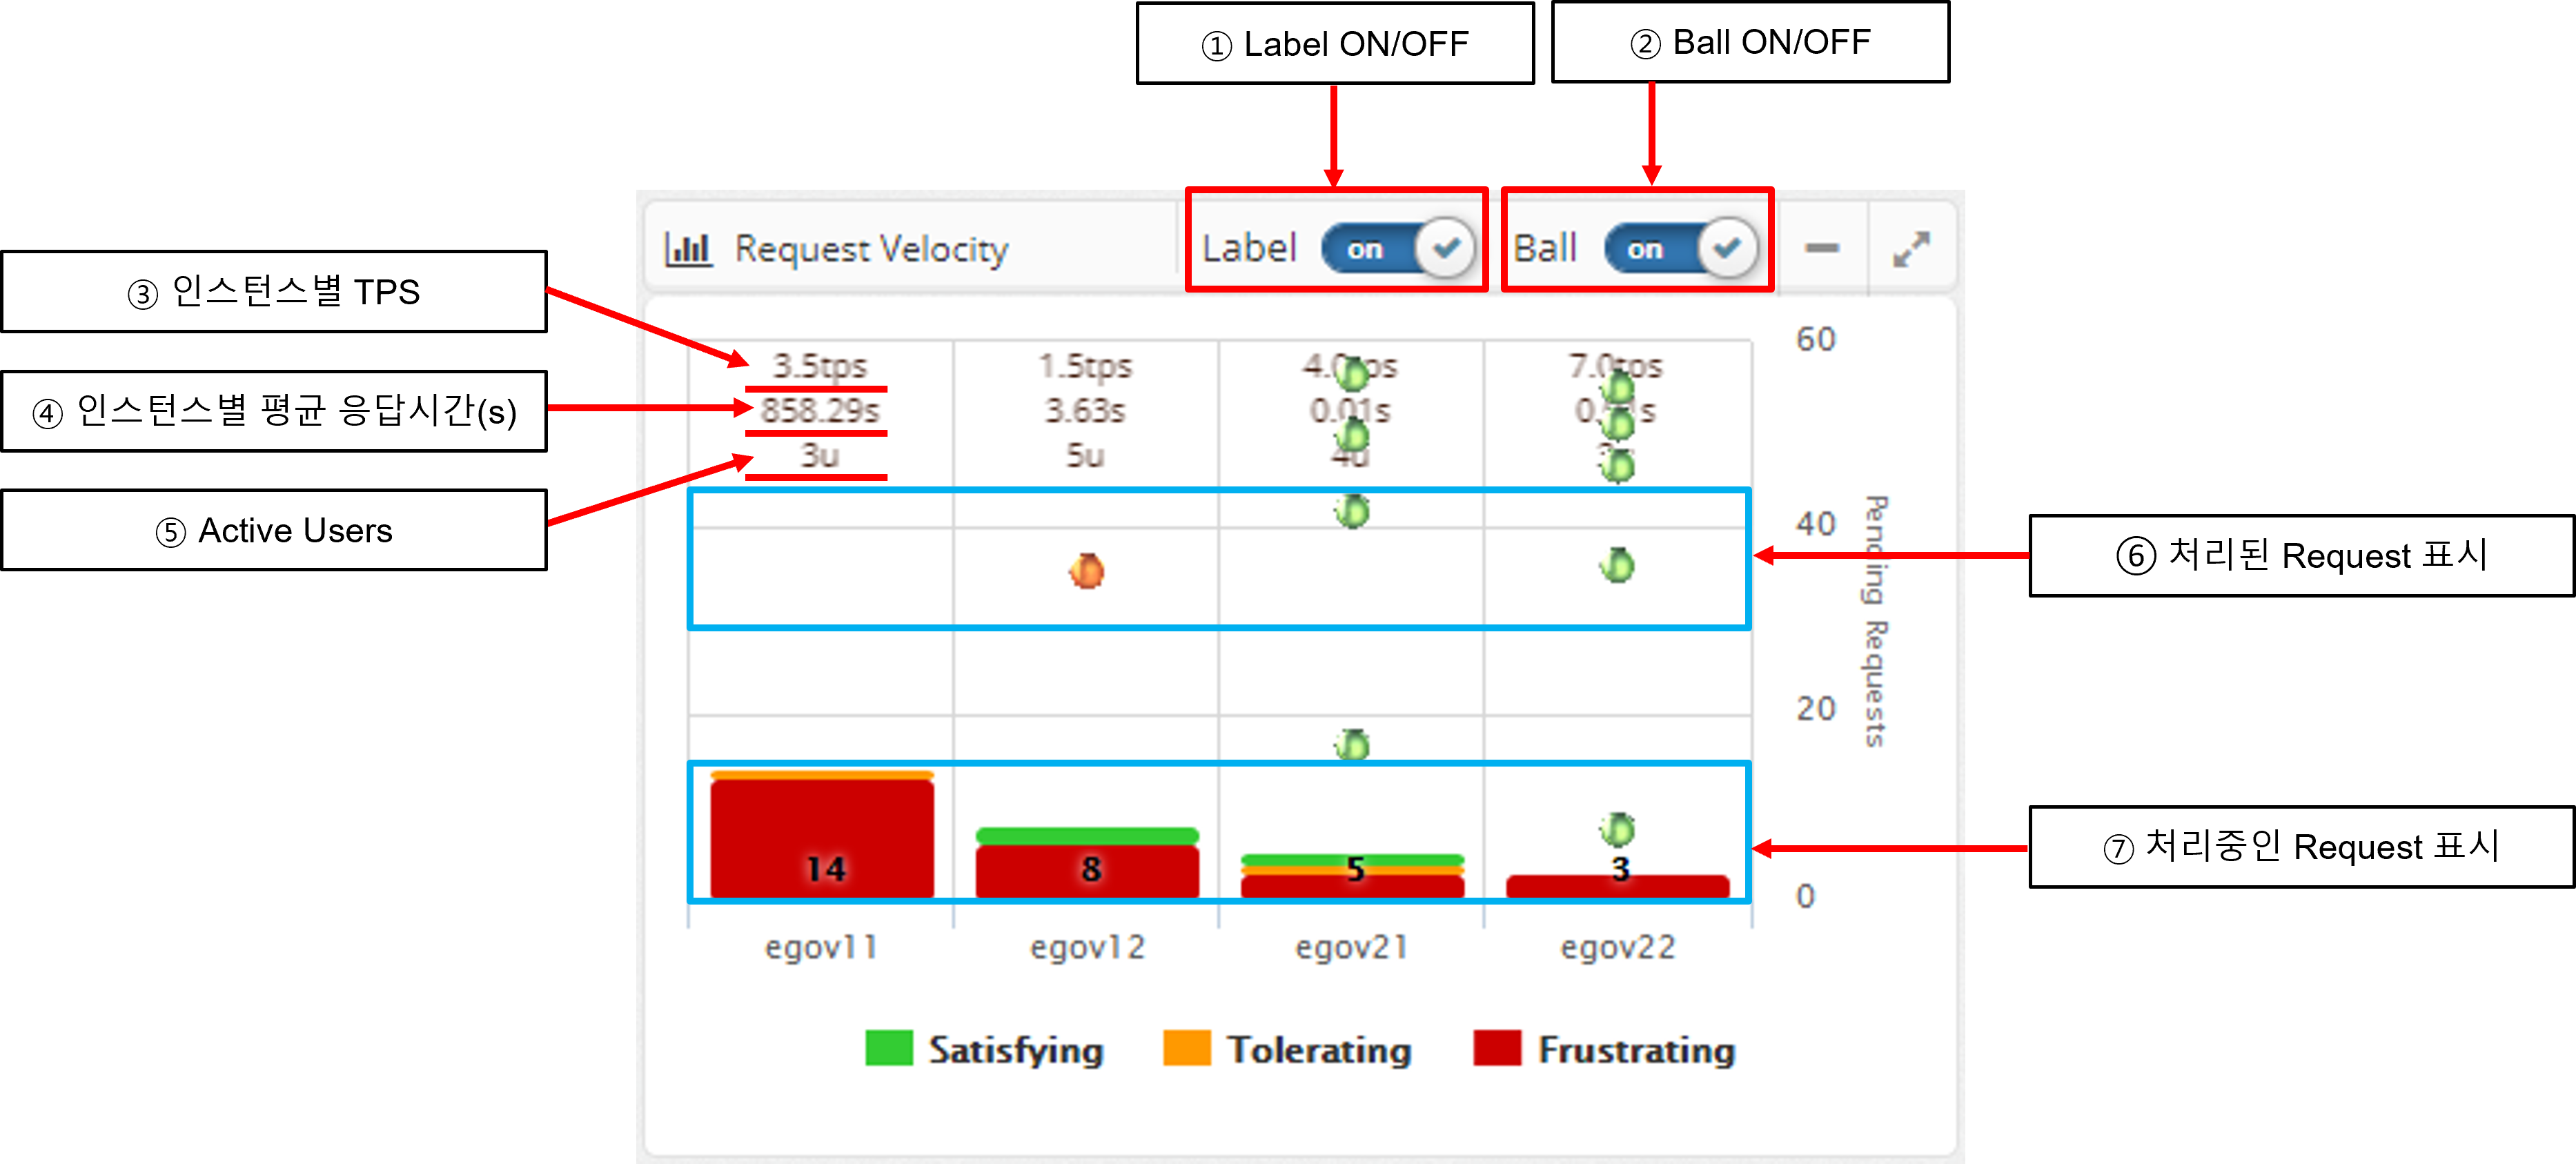
The Request Velocity chart in the dashboard animates the processed requests for each individual instance by displaying them as circles and animating them from top to bottom. It also displays the requests that are currently being processed in the form of a bar.
If Label is turned on, it displays the TPS and average response time per instance as text.
Processing requests are colored green, orange, and red based on the level of user satisfaction index (APDEX) set by WAS Agent: Satisfying, Tolerating, and Frustrating.
When you see the requests being processed, click the BAR to go to the Thread Dump analysis page to get information about the request currently in progress. See Thread Dump Analysis Methods for details on how to analyze thread dumps.
Transaction Heatmap (T-Map)
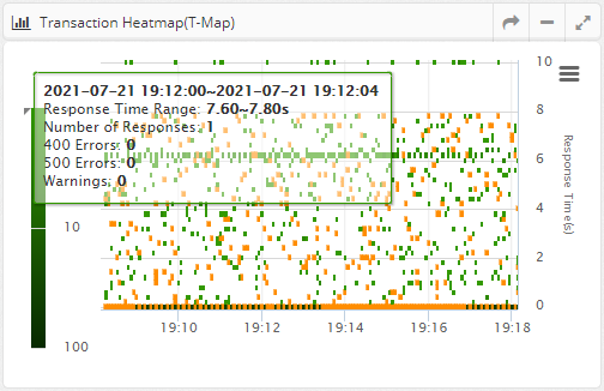
A Transaction Heatmap is a heatmap that shows the distribution of response times over time in a grid, with darker colors indicating more requests processed in a given time/response time grid.
This is shown for all instances belonging to the business application.
Cells with HTTP Status codes of 400 or 500 errors are colored with a red border.
By dragging the mouse to draw a rectangle on the Transaction Heatmap (T-Map), you can analyze the detailed transactions on a method-by-method basis for the requests processed in that area.
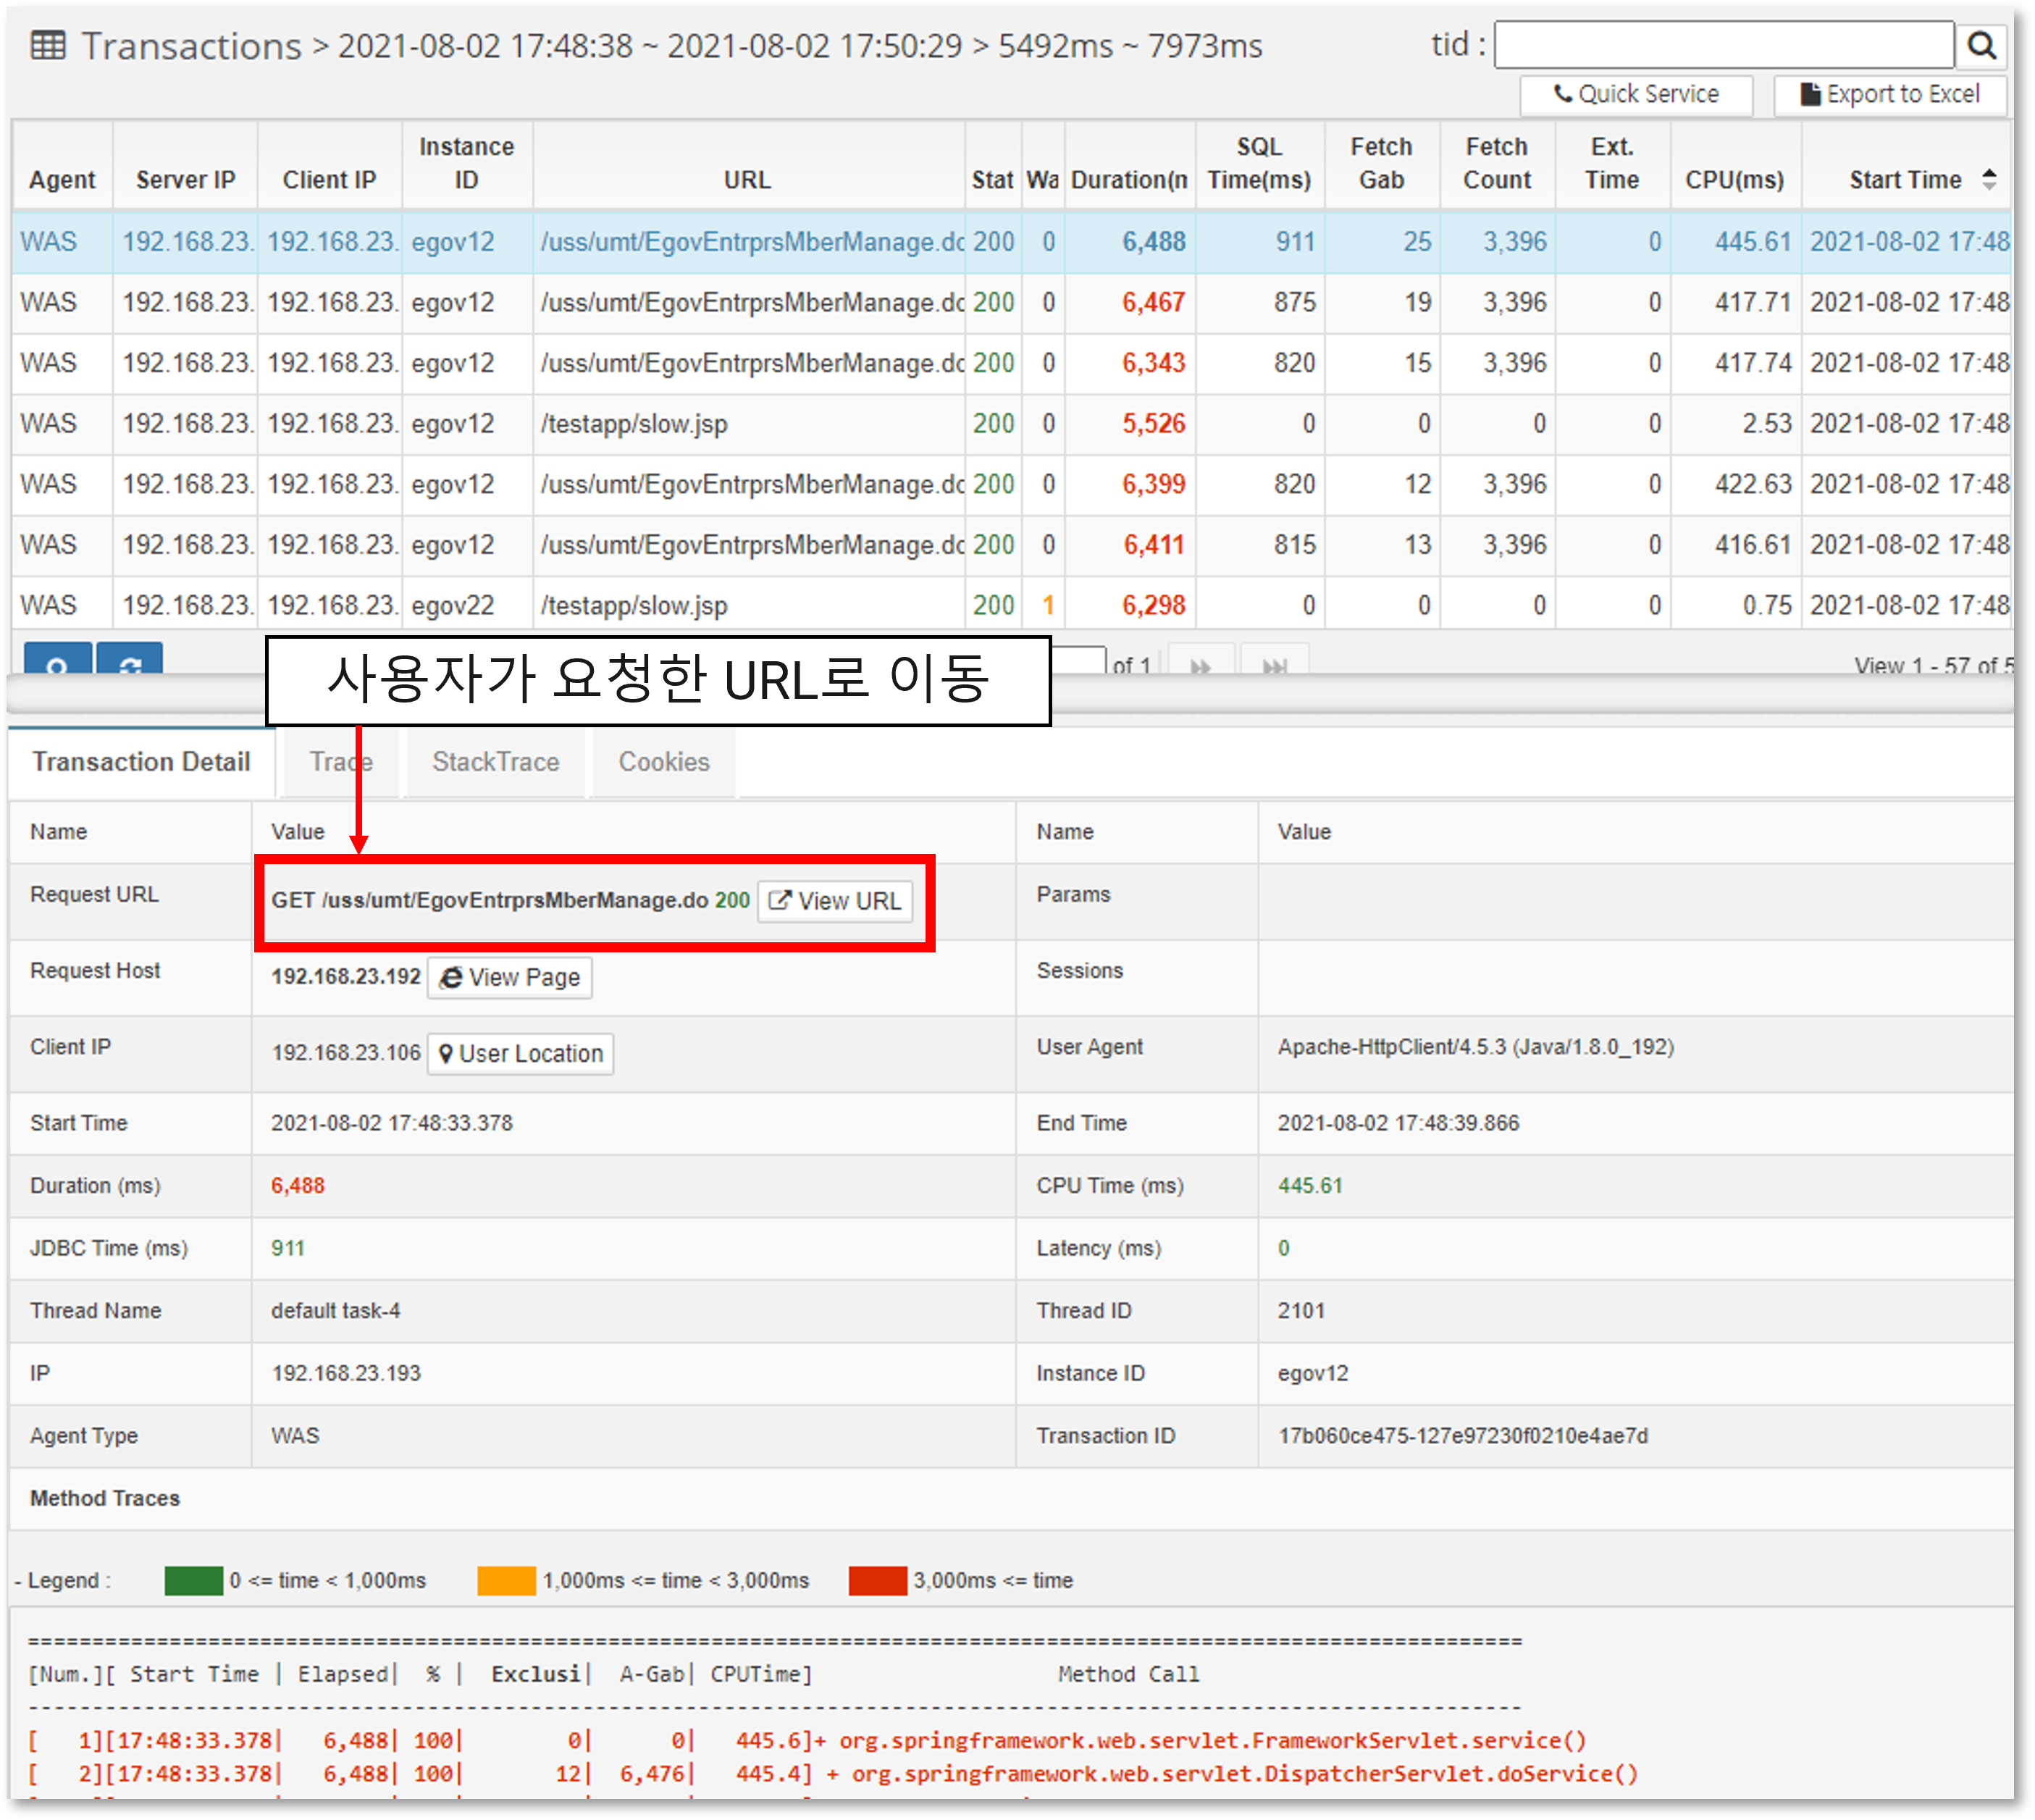
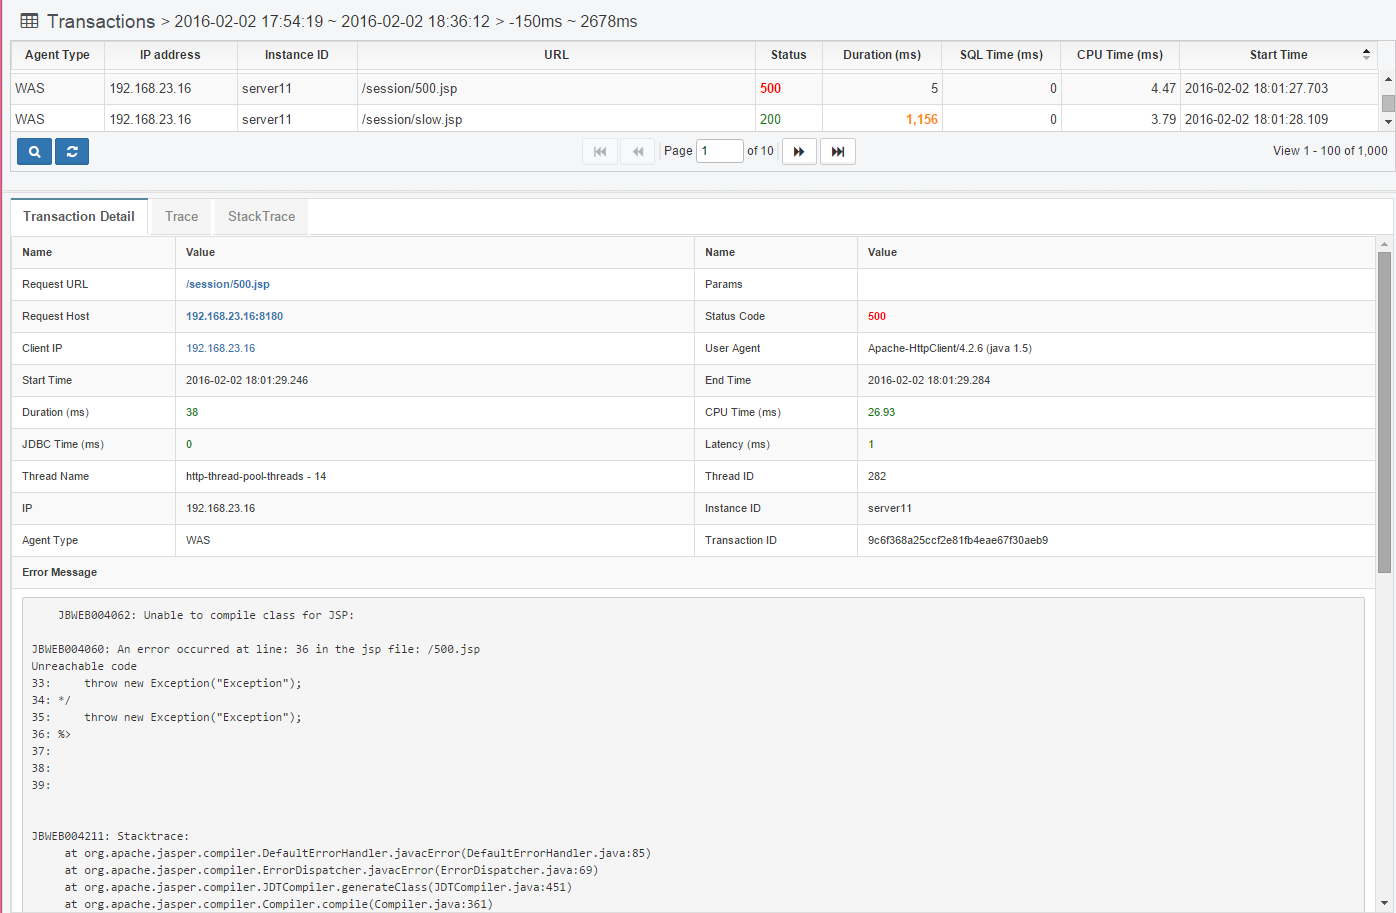
At the top, the requests executed in the selected area are displayed, and if you click Row at the top, the transaction details are displayed at the bottom.
If you click on the link of the Request URL, you can go to the URL that the user requested and see what page was actually requested. In addition, you can check the start time, execution time, sum of execution time related to the database, and CPU time.
Transaction details are displayed in the following format. If the execution time is slow, it is displayed in red.
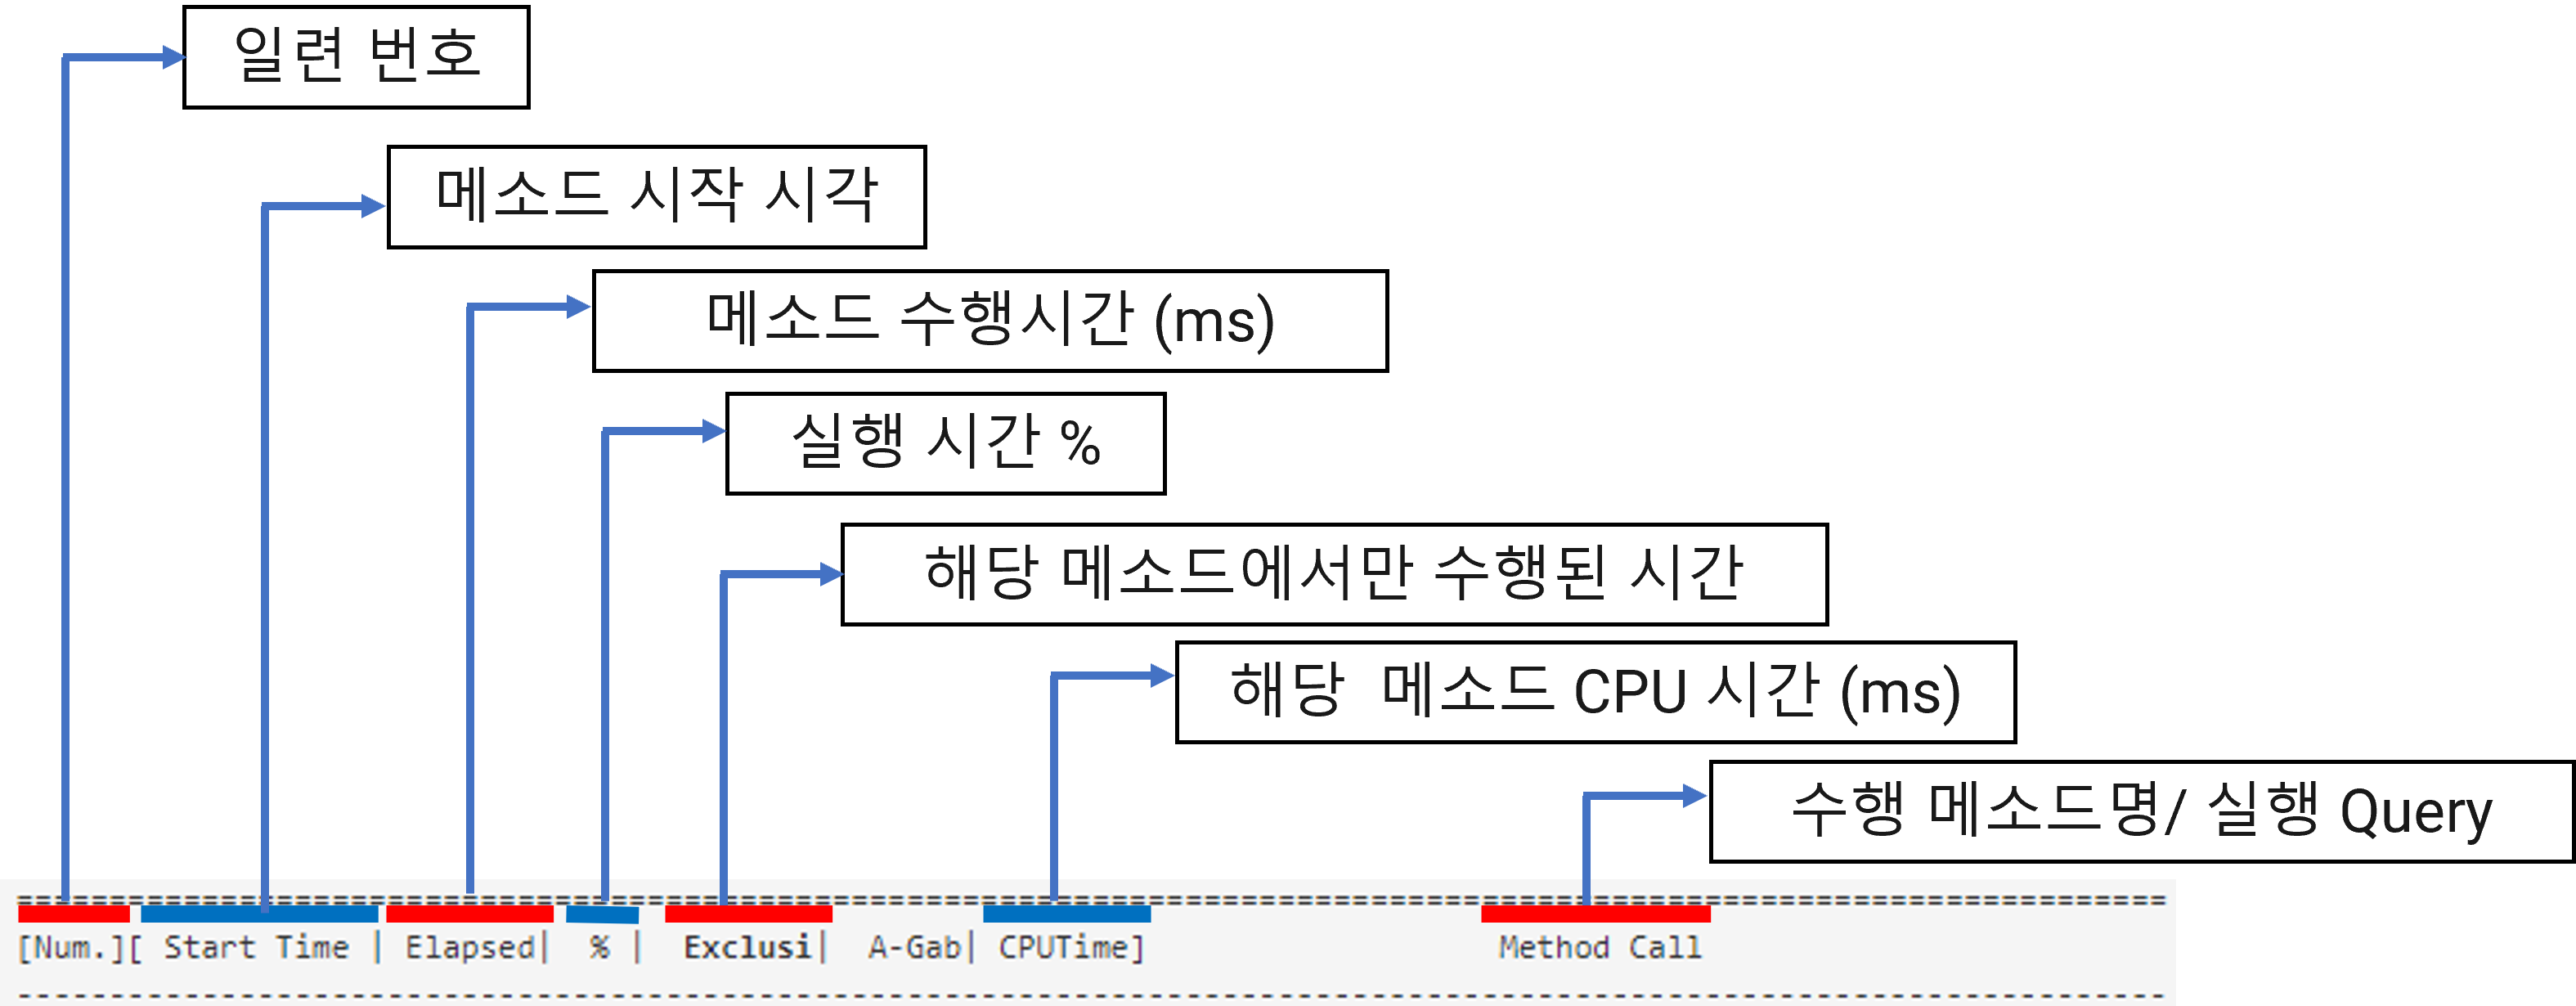
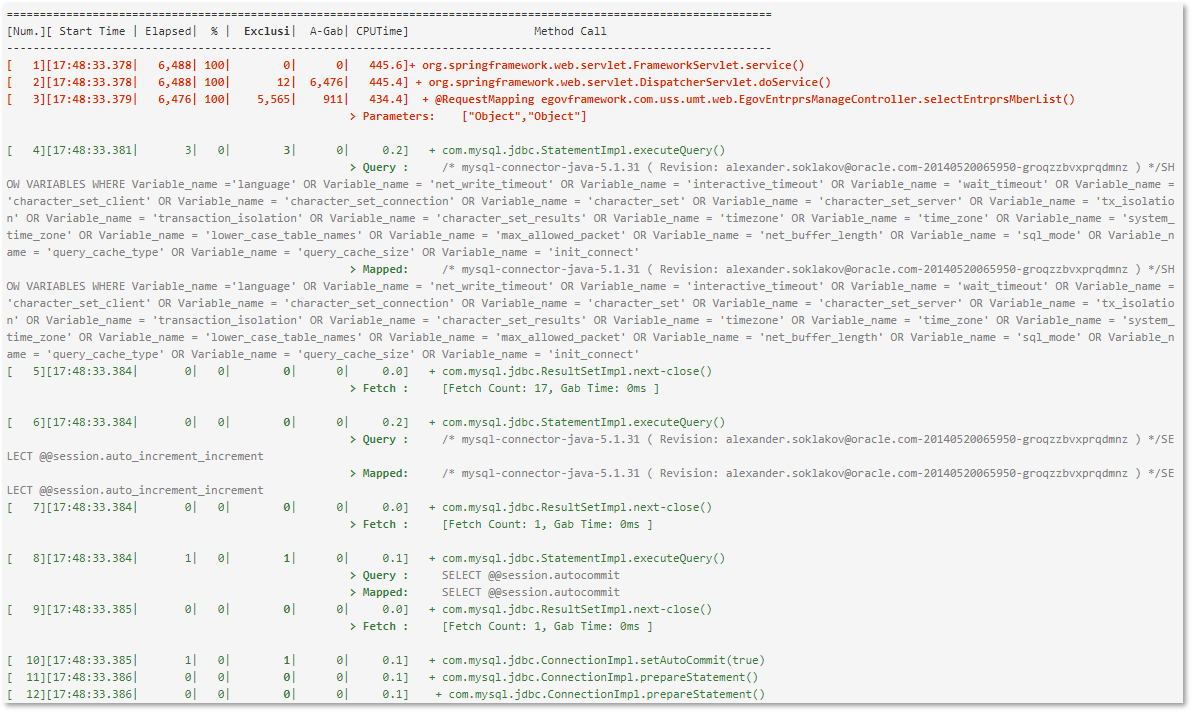
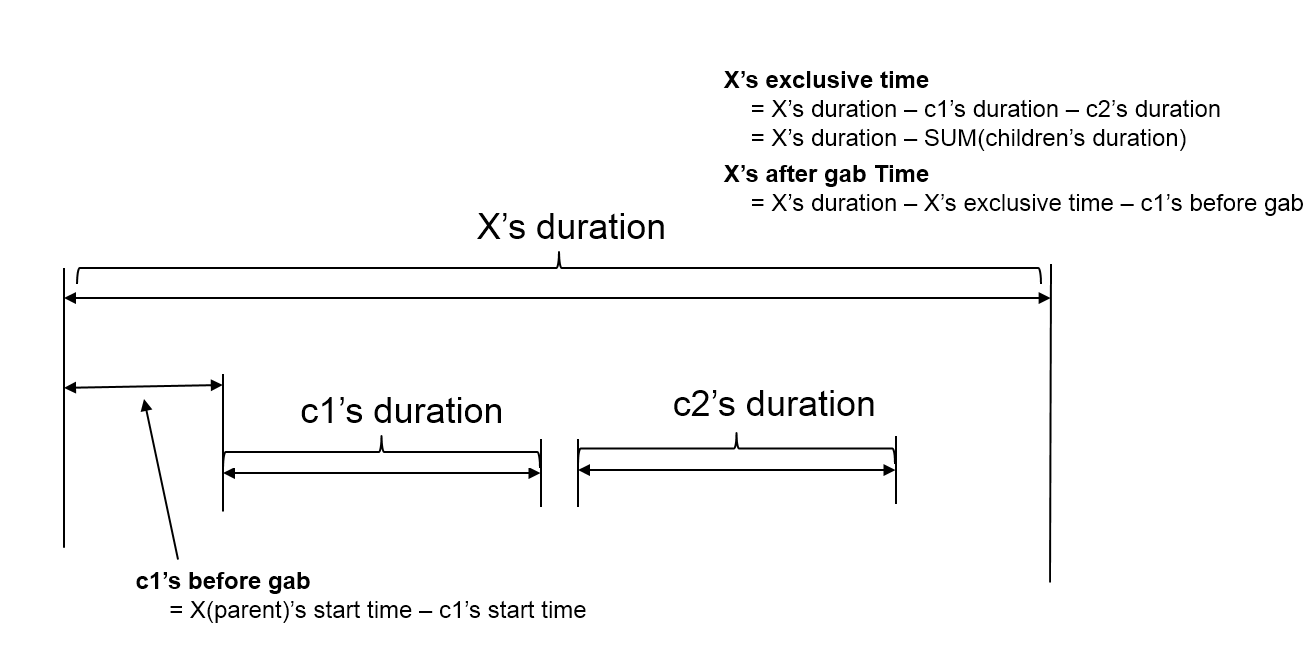
The exclusive time is calculated and displayed by calculating the time spent executing only in that method. The execution relationship of methods is represented in the form of a tree. It also displays B-Gab (Before Gab) and A-Gab (After Gab), and the calculation method is as follows.
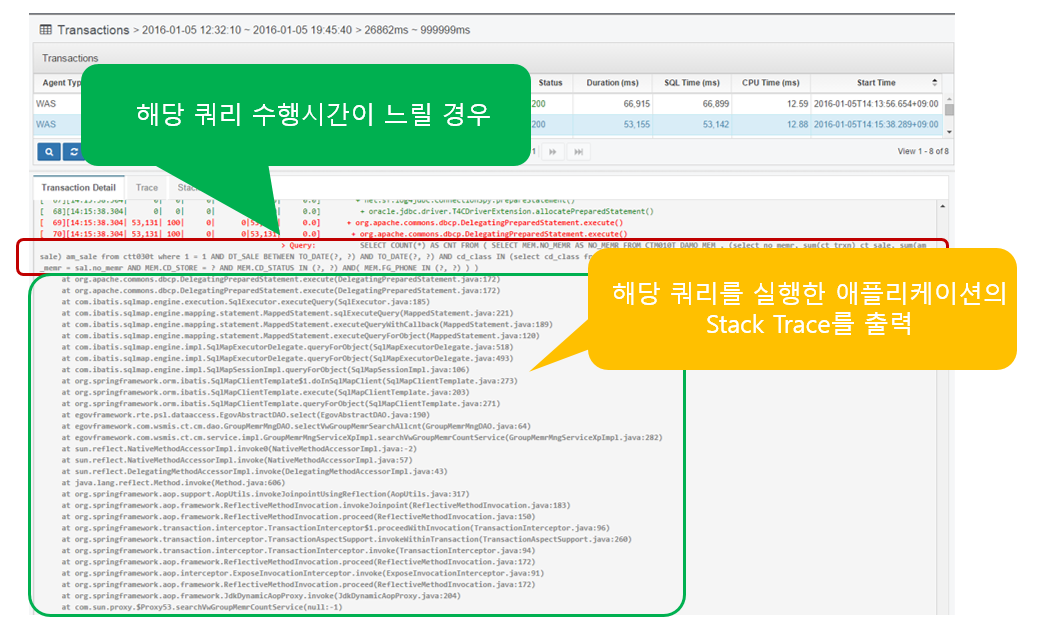
If the SQL query takes a long time to execute as shown above (set in WAS Agent), Stack Trace is output to identify the location of the application that executed the query.
Collect all HTTP Status Code 40x and 50x error information. Among the 500 errors, errors such as JSP compilation errors are collected and displayed as error messages like below.
Analyze the SQL query
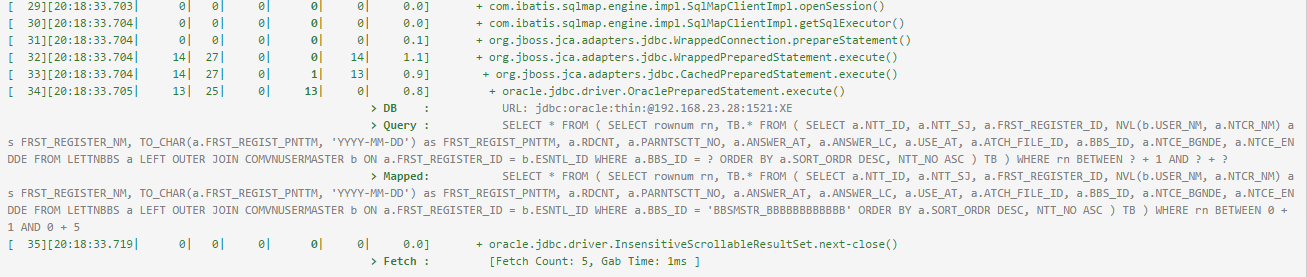
In the case of PreparedStatement, it is executed by setting values for each parameter in the SQL statement written with '?'.
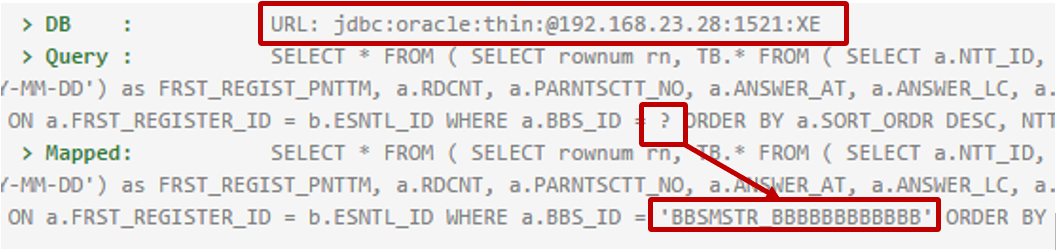
Displays the SQL statement of PreparedStatement or CallableStatement executed in Transaction Trace, replacing '?' with the value set by the program and outputting it to the 'Mapped:' item. item by replacing '?' with the value set by the program.
You can copy the Mapped SQL statement and run it in a database query tool.
The JDBC URL of the database where the query was executed is also displayed.
After executing the SQL statement, the ResultSet’s next() function is used to get the value, which displays the number of hits and the time it took.
![]()
Fetch Count means the number of times the next() function was called, and Gab Time means the time from the first next() function execution until the ResultSet close() function is called.
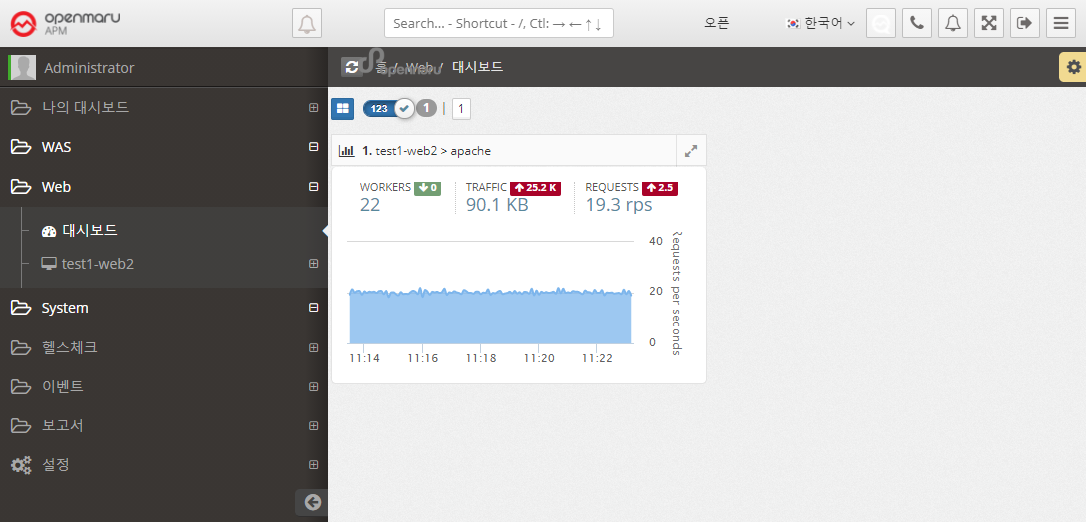
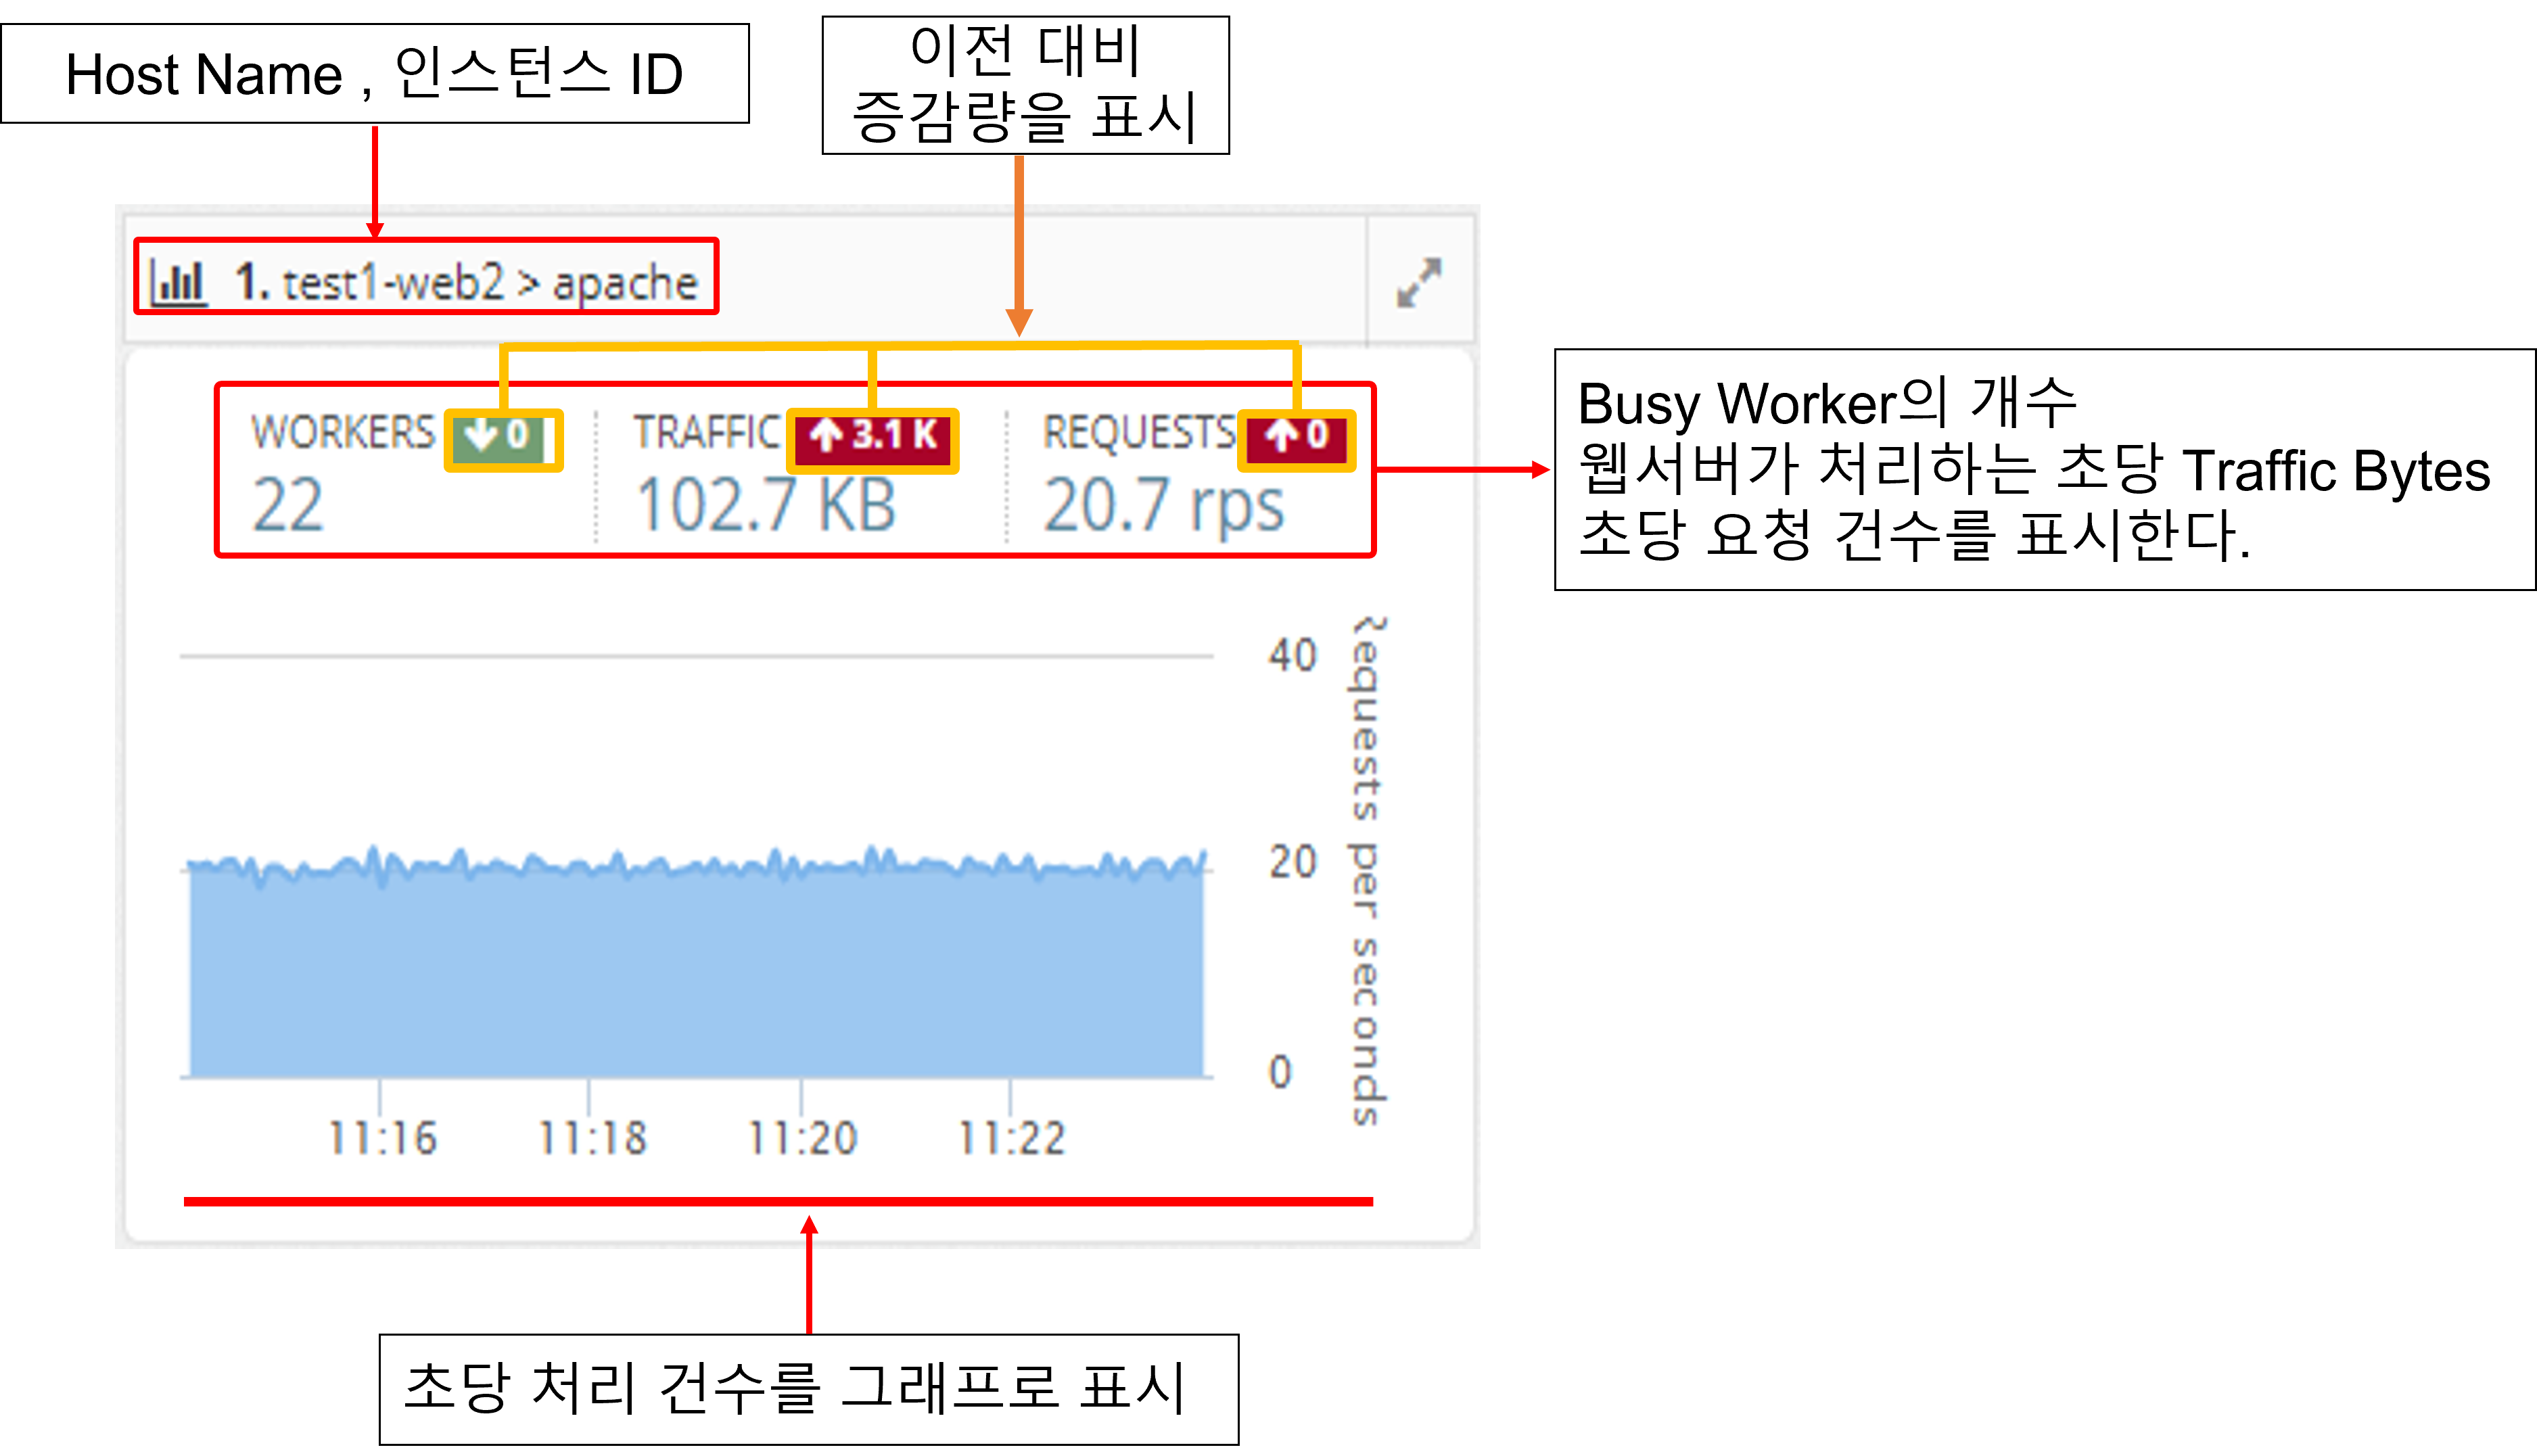
APM WEB Dashboard
It collects the information of the web server through the Apache Plugin in the System Agent on the machine where the Apache web server is installed.
It monitors the number of processes per second, the amount of traffic transferred per second, and the status of worker threads of Apache web servers and displays a dashboard of web servers on the screen.