2.4.10 DBMS Monitoring: Reports
Report
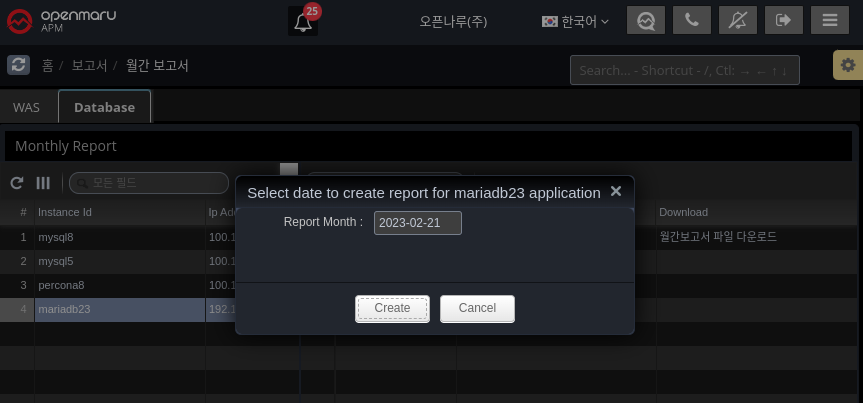
On the first day of every month, it automatically generates a report for the previous month.
Alternatively, you can generate it manually using the "Generate report" button.
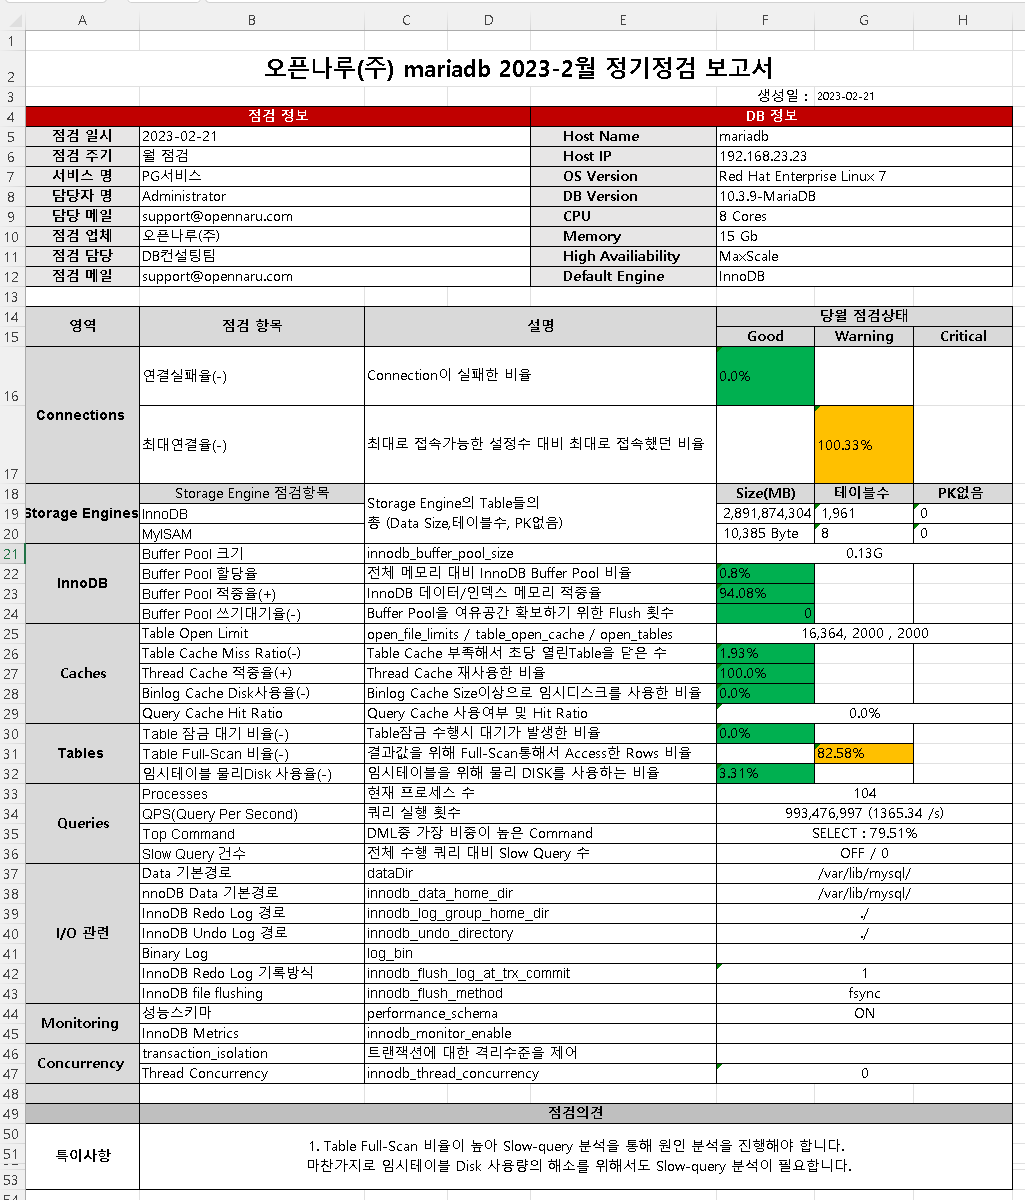
The report is organized by Connections, Storage Engines, InnoDB, Caches, Tables, Queries, I/O related, Monitoring, and Concurrency to give you a quick overview of whether your DBMS is running stably.
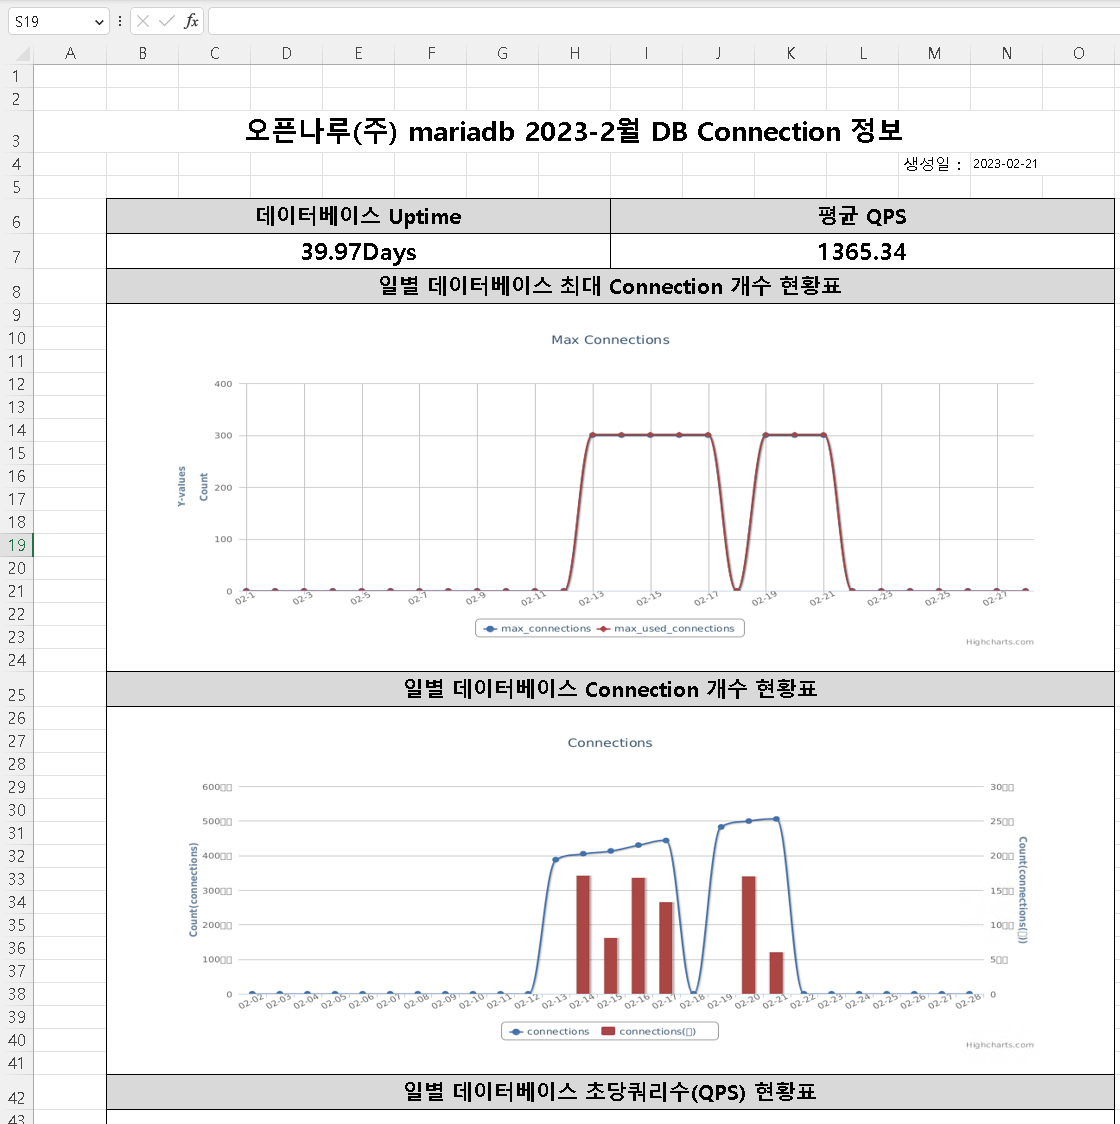
The simplified report shows the daily fluctuations in usage through graphs.
-
Maximum number of database connections
-
Database Connection Count
-
Database Queries Per Second (QPS)
-
Database Command Usage
-
Database innodb buffer pool size
-
Database innodb data activity
-
Database innodb waits
-
Database table locks
-
database full table scan rate