Displays information that is common to all monitored WAS instances.
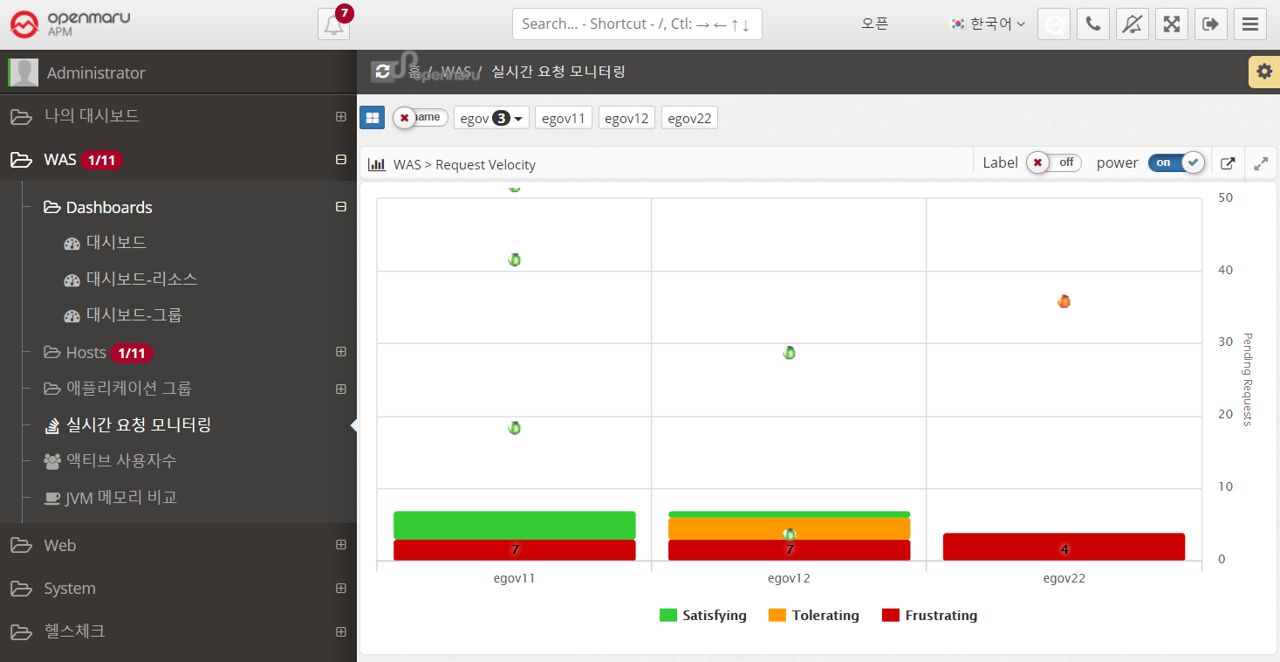
Real-time request monitoring
This is a graphical representation of real-time request monitoring by task, as shown in the dashboard. For detailed usage, see
Request Velocity Chart.
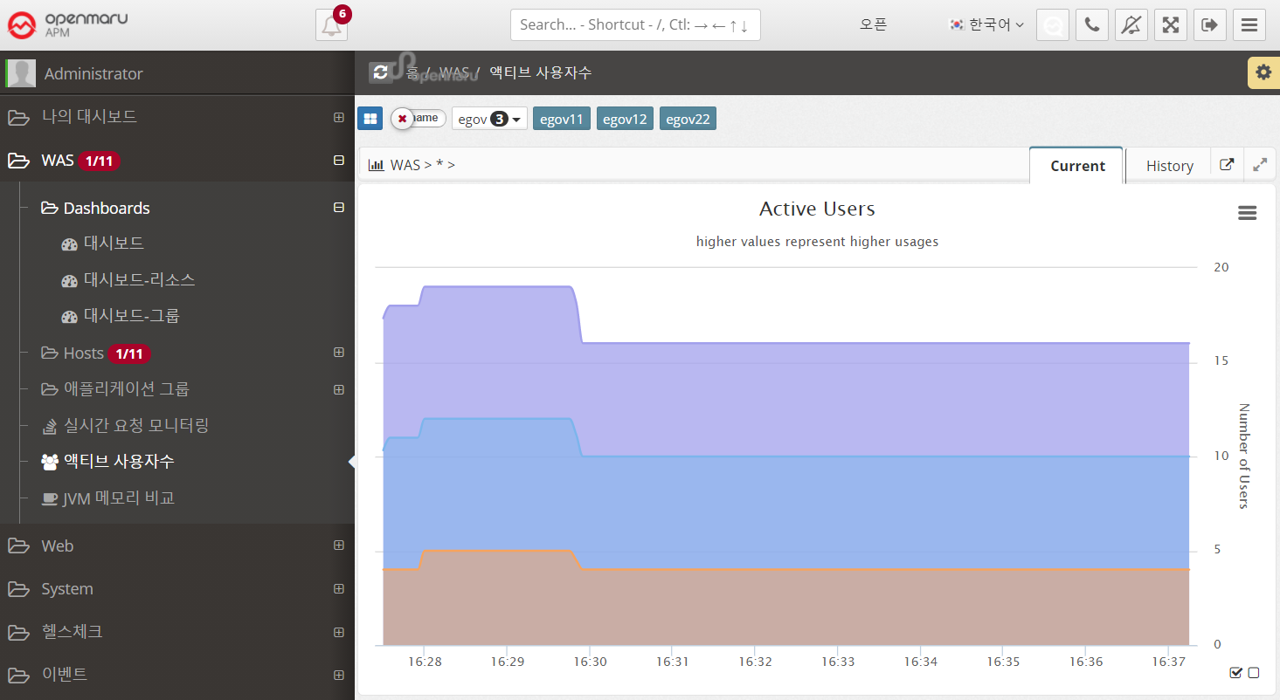
Number of active users
Summarize and graph the number of active users (the only users who have made a request in the last 5 minutes) of all monitored WASs without categorizing them by task.
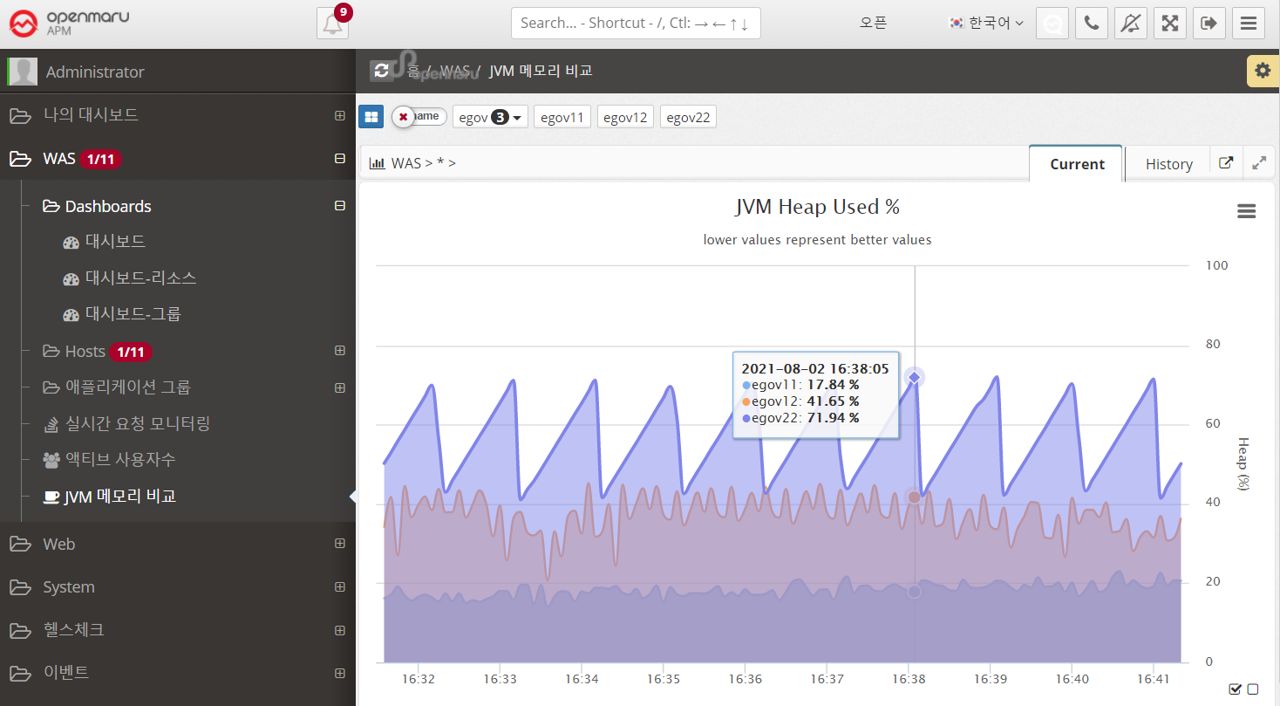
JVM Memory Comparison
Graphs the Java Heap memory utilization of all monitored WASs, not separated by task.