Getting started
What is OPENMARU APM?
OPENMARU APM is an Application Performance Monitoring (APM) tool that provides real-time monitoring of Java-based web applications, which can be used to proactively prevent failures and continuously improve performance.
OPENMARU APM provides not only real-time behavioral monitoring of Java-based web applications, but also features that allow you to apply real-time statistical analysis techniques to determine problems in advance.
About the installation guide
This user guide is for users who want to monitor their Web Application Server (WAS) using OPENMARU APM. It is also a guide for identifying and analyzing failure causes through monitoring of web applications.
Main features
OPENMARU APM is a product for monitoring web application servers and provides the following features.
-
*Provides service satisfaction index (APDEX) * *
It expresses the satisfaction of the service from the user’s point of view in a single number. You can understand the situation of the service at a glance through the index from 0 to 100.
-
'T-Map' Transaction Distribution Map + *T-Map Transactions are represented as a heat map for intuitive analysis of the overall response time of the service, and detailed profiling including SQL queries for selected cells is provided.
-
Real-time Forecast * + *Forecast Real-time statistical analysis alerts you to predictive events that will reach thresholds set by administrators in the next few minutes.
-
WAS Failure Analysis Tool
Provides the JVM Thread Dump analysis tool, which is most commonly used for WAS failure analysis. It provides various data required for WAS Trouble Shooting.
-
*Anomaly monitoring + *Anomaly Monitoring Notifies you through events when anomalies are detected that are out of the ordinary through statistical analysis.
-
OS resource and web server monitoring
Monitor various values such as OS CPU, Memory, Disk usage, Load Average, Network usage, Socket status, Web server traffic, RPS, etc.
-
Sophisticated event handling + *Sophisticated event handling Threshold values are calculated based on the statistical values of the collected values for the monitored indicators, so monitoring events are only triggered when absolutely necessary.
-
HTML 5-based User Interface
Provides an intuitive user interface based on HTML 5 for use on various devices, including mobile.
System Configuration
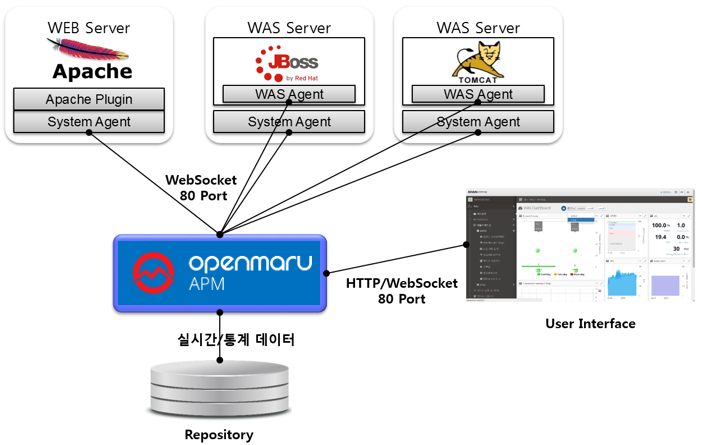
**OPENMARU APM consists of WAS Agent to monitor Web Application Server (WAS) server and SYS Agent to monitor system status and web server status, OPENMARU APM Server to collect and process/store data, and HTML 5-based User Interface (UI).
The web server has a system agent and an Apache web server plug-in of the system agent to monitor system information and web server status.
The WAS server installs the System agent for collecting system information and the WAS agent for monitoring WAS. Both the agent and the connection to the server use the WebSocket protocol.
Supported environments
Supported environments for installing OPENMARU APM Server
OPENMARU APM Server can be installed on the following operating system environments using the OPENMARU APM Provisioning feature.
| Operating System | |
|---|---|
RHEL (Red Hat Enterprise Linux) 6.x / 7.x |
x86_64 |
CentOS 6.x / 7.x |
x86_64 |
The minimum/recommended usage environment for OPENMARU APM Server is as follows.
| Category | Minimum Environment | Recommended Environment |
|---|---|---|
Number of Cores |
4 Cores |
8 Cores or more |
Memory |
8 GB |
16 GB or more |
Disk |
300 GB |
500 GB or more |
The specifications of the system are highly dependent on the number of servers and instances to be monitored.
If you utilize OPENMARU APM’s provisioning feature, OPENMARU APM’s agents are automatically installed/configured, but if this is not possible, you can install them manually as follows.