2.1.1 Getting started
Author |
Version |
Date |
Yu Geunmo |
v1.1 |
2023-05-24 |
Before we get to the
This user guide provides an introduction to OPENMARU Cloud APM and its main features, and is intended for users who want to monitor web application servers (WAS) using OPENMARU Cloud APM. It is also a guide for identifying and analyzing failure causes through monitoring of web applications.
OPENMARU Cloud APM ?
OPENMARU Cloud APM is an application performance monitoring (APM) tool that provides real-time monitoring of Java-based web applications, which can be used to proactively prevent failures and continuously improve performance.
In addition to real-time behavioral monitoring, OPENMARU Cloud APM provides the ability to apply real-time statistical analysis techniques to proactively determine problems.
Main features
OPENMARU Cloud APM is a product for monitoring web application servers and provides the following features.
-
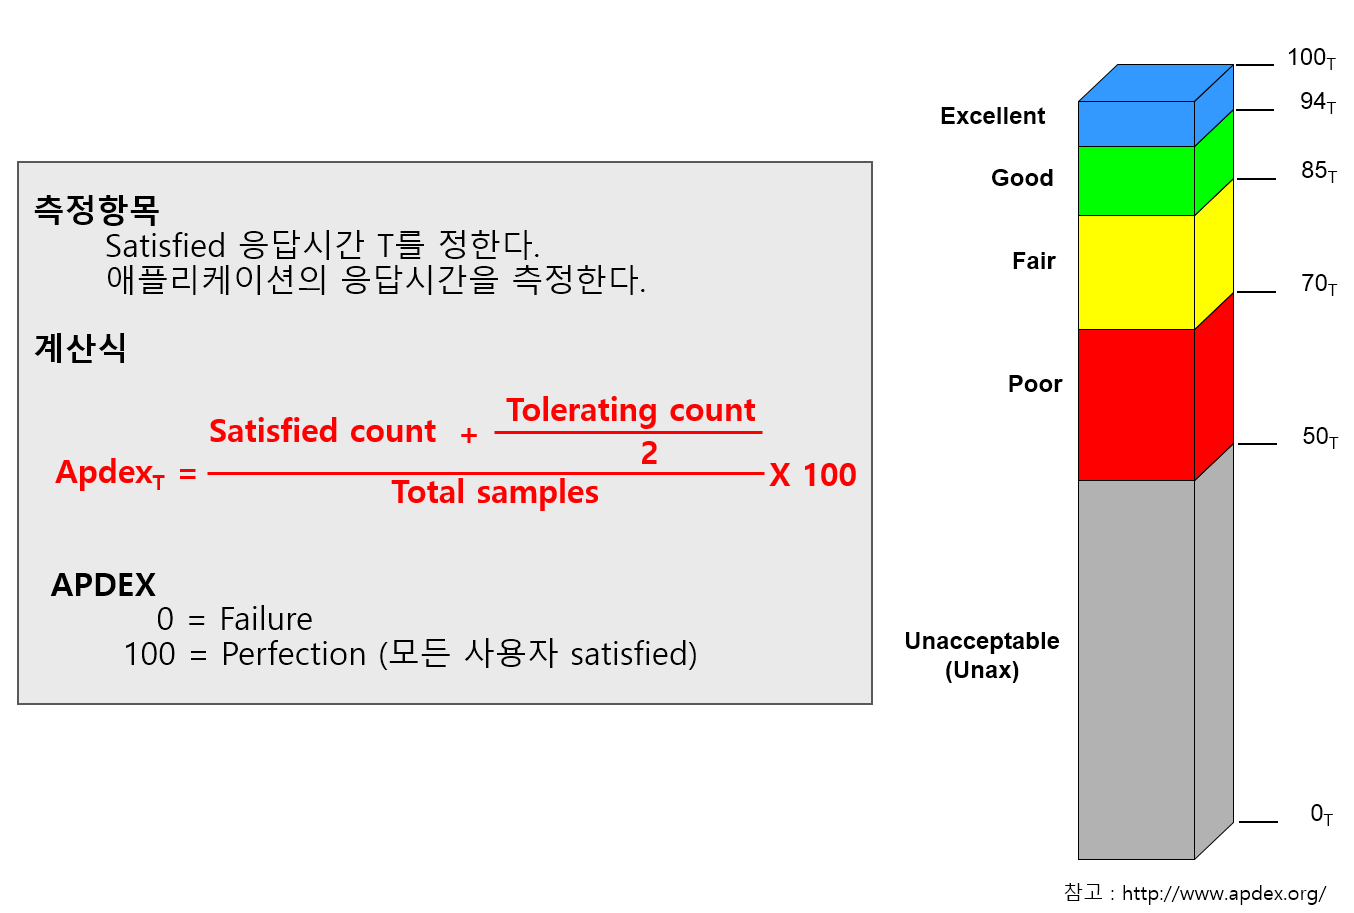
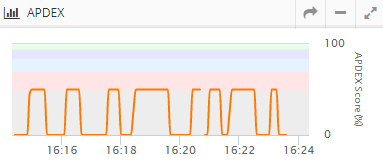
Provides service satisfaction index (APDEX)
It expresses the user’s satisfaction with the provided web application in a single number, and you can understand the service situation at a glance through an index ranging from 0 to 100.
-
‘T-Map’ Transaction Distribution
For intuitive analysis of the overall response time of the service, transactions are represented as a heat map, and detailed profiling including SQL queries for selected cells is provided.
-
Real-time Forecast(Forecast)
Real-time statistical analysis alerts you to predictive events that will reach thresholds set by administrators in the next few minutes.
-
WAS Failure Analysis Tool
Provides JVM Thread Dump analysis tool, which is the most used tool for failure analysis of WAS, and provides various data required for WAS Troubleshooting.
-
Anomaly Monitoring
When anomalous values are detected through statistical analysis, it notifies you through events.
-
OS resource and web server monitoring
Monitor various values such as OS CPU, Memory, Disk usage, Load Average, Network usage, Socket status, Web server traffic, RPS, etc.
-
Sophisticated event handling
Threshold values are calculated based on the statistical values of the collected values for the monitored indicators, so monitoring events are only triggered when absolutely necessary.
-
HTML 5-based User Interface
It provides an intuitive user interface based on HTML 5 for use on various devices, including mobile.
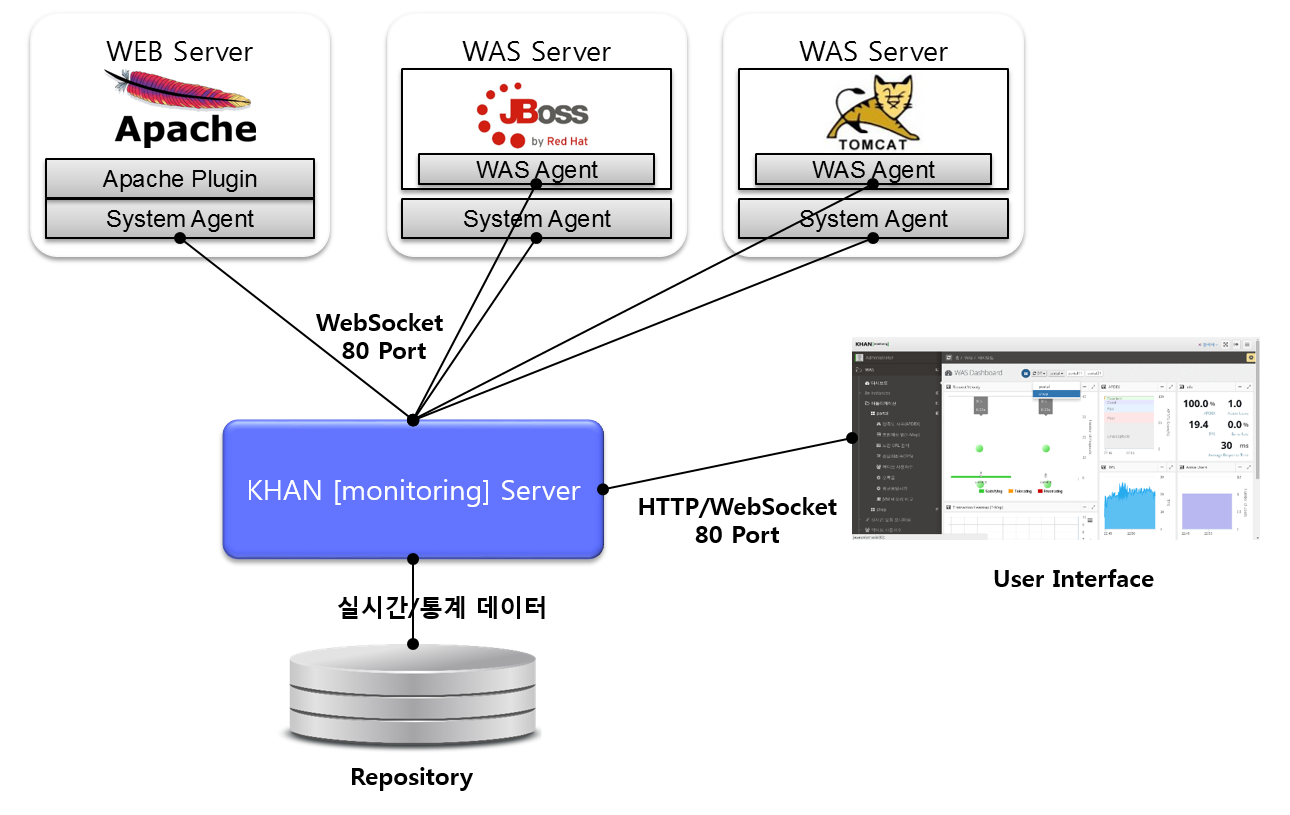
System Configuration
APM consists of WAS Agent to monitor Web Application Server (WAS) server and SYS Agent to monitor system status and web server status, APM Server to collect and process/store data, and HTML 5-based user interface (UI).
The web server includes the SYS Agent and the SYS Agent’s Apache web server plugin to monitor system information and web server status.
The WAS server installs the System agent for collecting system information and the WAS agent for monitoring WAS. Both the agent and the connection to the server use the WebSocket protocol.

2.1.3 OPENMARU APM Dashboard Screen Configuration
WAS Dashboard
The charts that make up the dashboard of WAS are shown in the following figure. The dashboard is organized by business application.
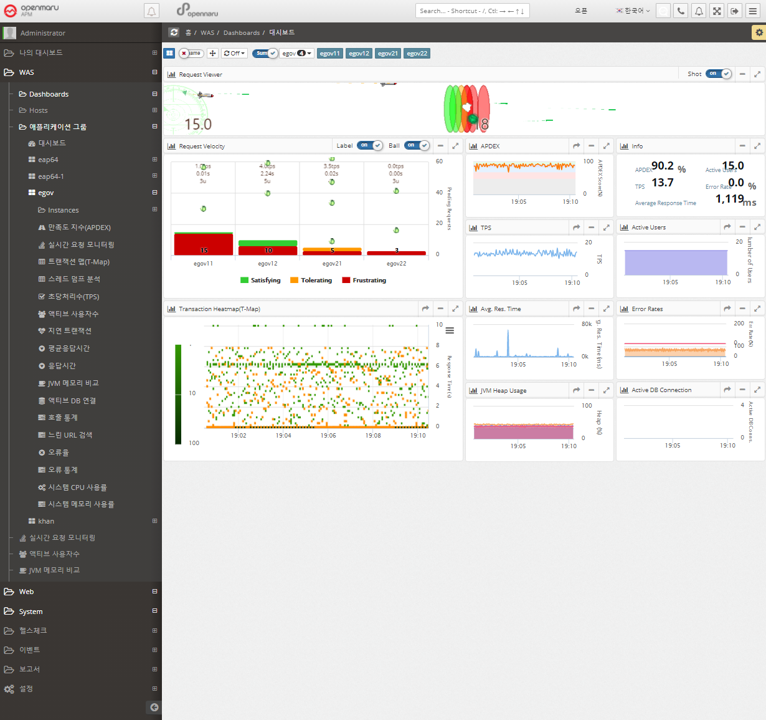
The dashboard displays the Request Velocity Chart, which shows the currently executing requests of individual instances used by the business system, and the Transaction Heatmap (T-Map), User Satisfaction Index (APDEX), Transactions Per Second (TPS), Active Users, Average Response Time, and Error Rate for the entire business system, as well as the Information Widget, which outputs the information as text.
The Request Velocity and Transaction Heatmap (T-Map) information is updated every 2 seconds, and the APDEX, TPS, Active Users, Average Response Time, and Error Rates information is automatically updated every 5 seconds.
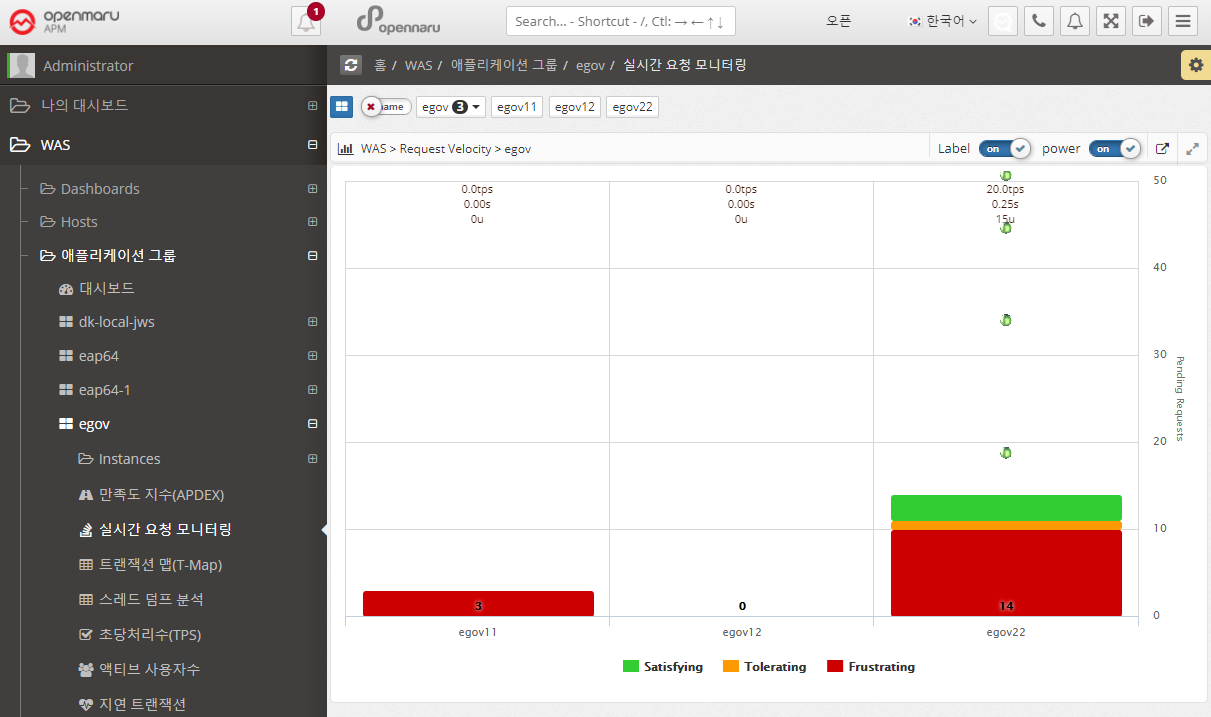
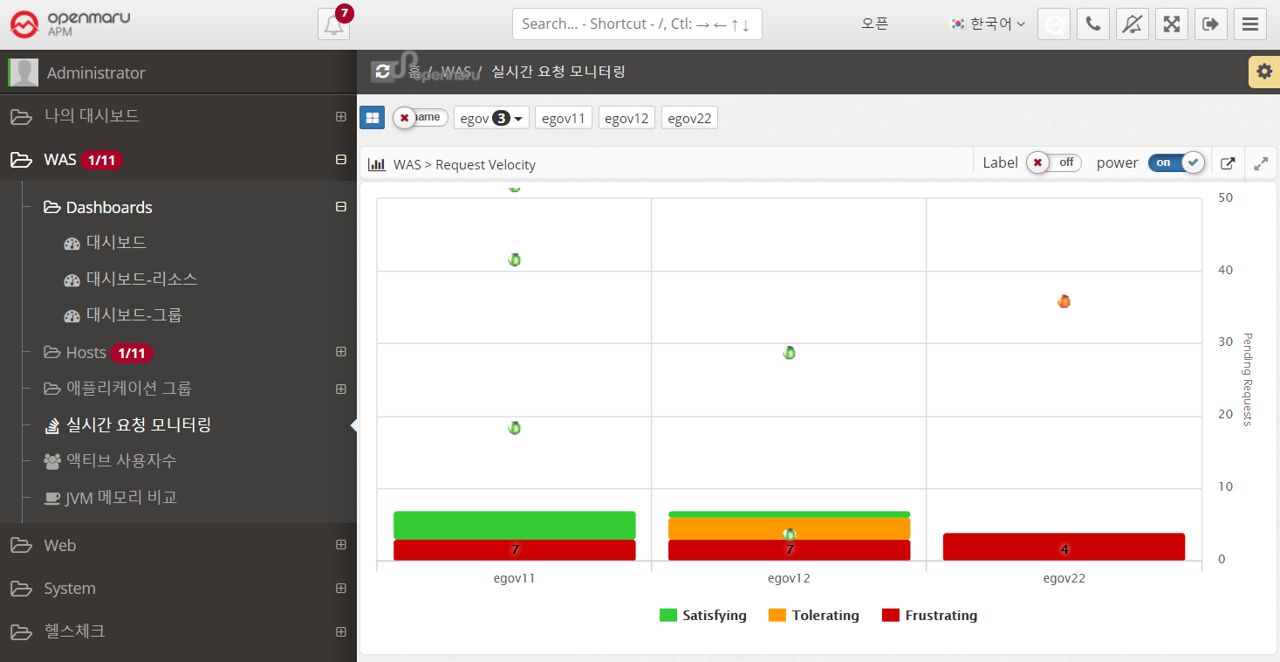
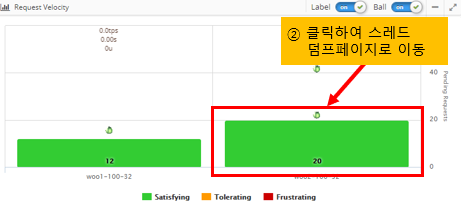
Request Velocity Chart
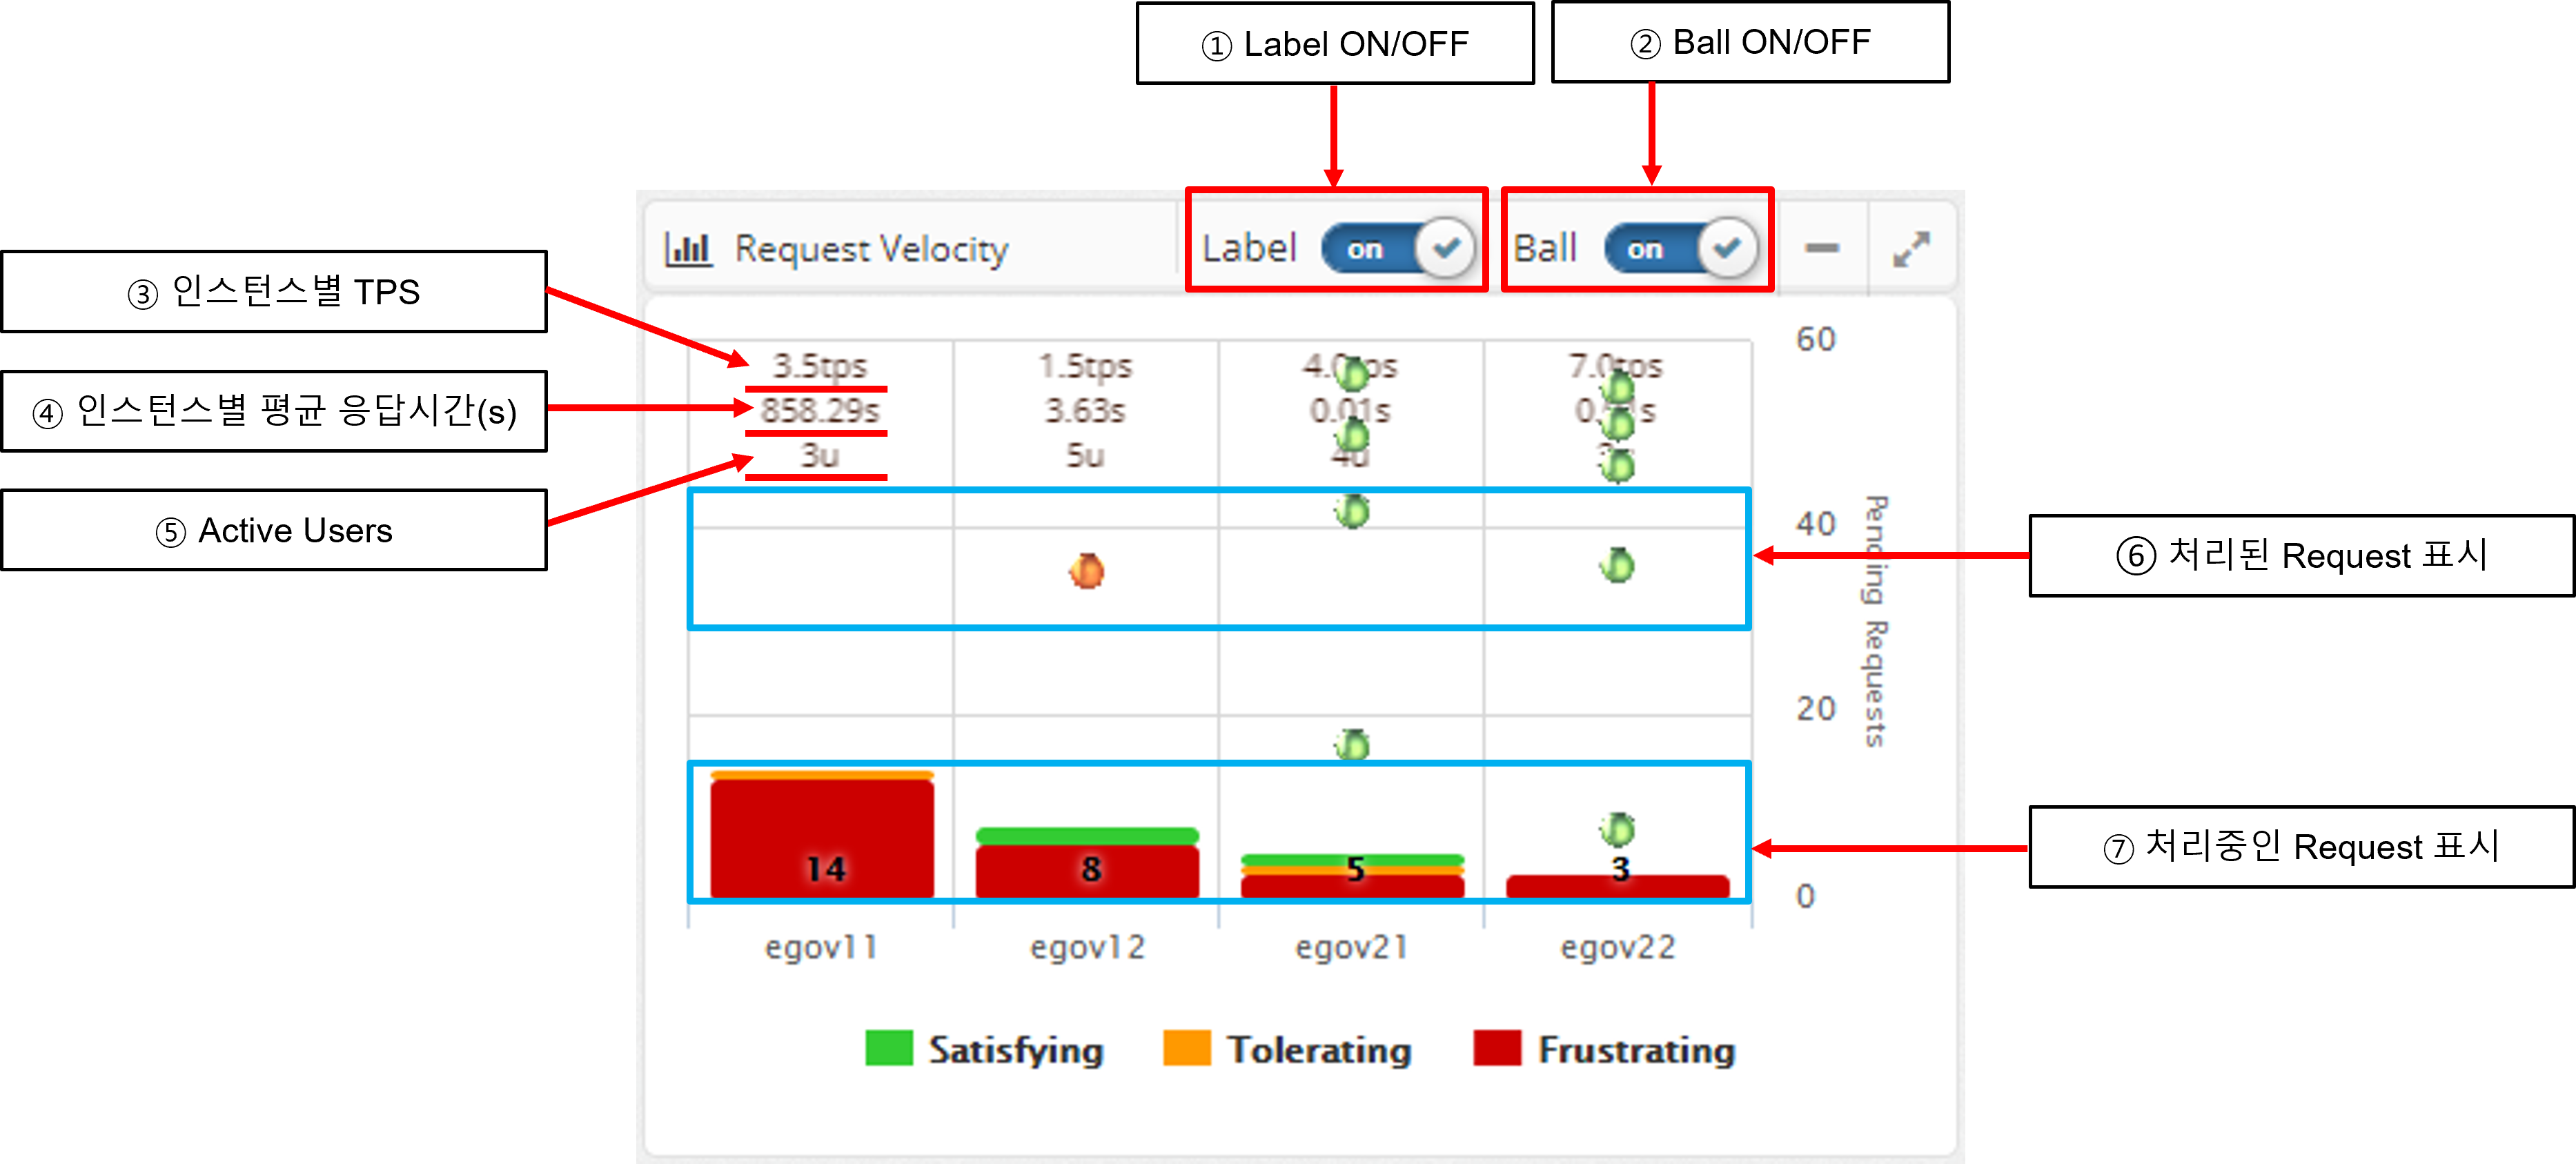
The Request Velocity chart in the dashboard animates the processed requests for each individual instance by displaying them as circles and animating them from top to bottom. It also displays the requests that are currently being processed in the form of a bar.
If Label is turned on, it displays the TPS and average response time per instance as text.
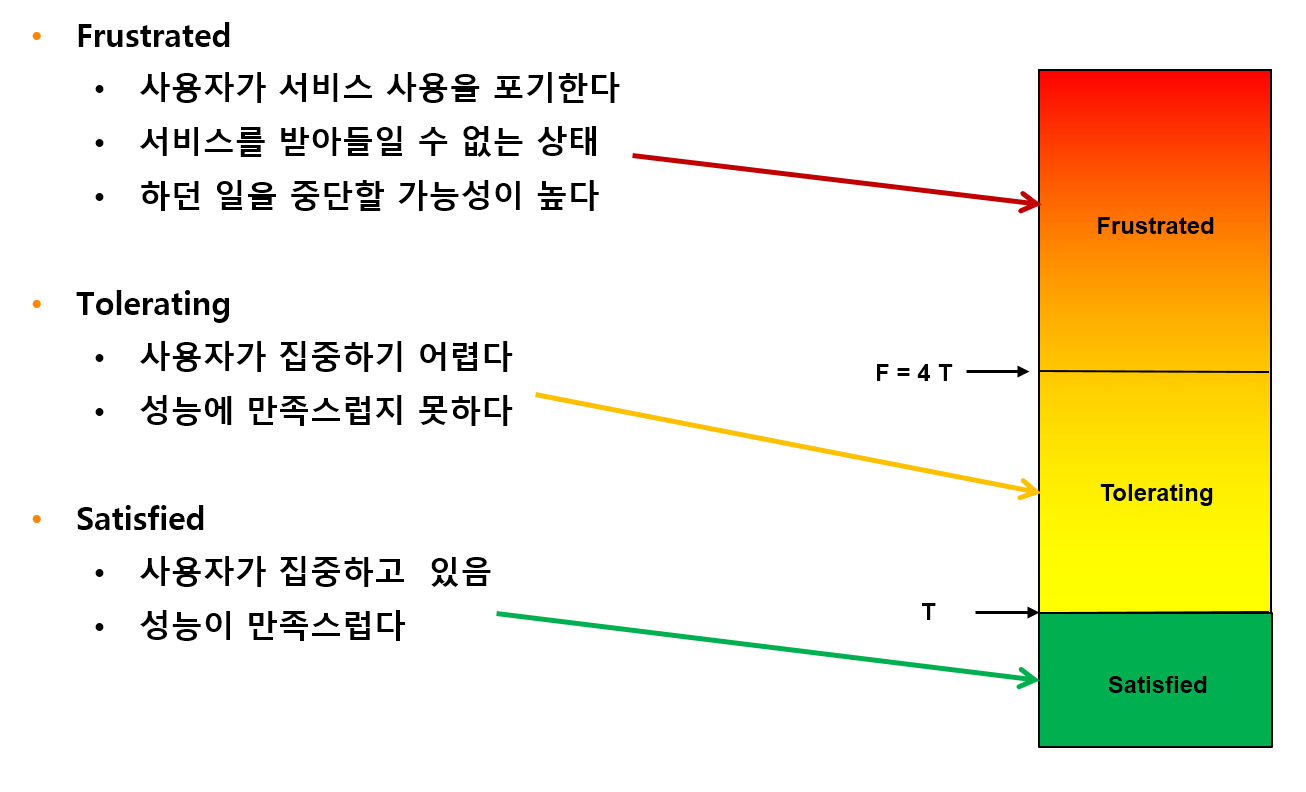
Processing requests are colored green, orange, and red based on the level of user satisfaction index (APDEX) set by WAS Agent: Satisfying, Tolerating, and Frustrating.
When you see the requests being processed, click the BAR to go to the Thread Dump analysis page to get information about the request currently in progress. See Thread Dump Analysis Methods for details on how to analyze thread dumps.
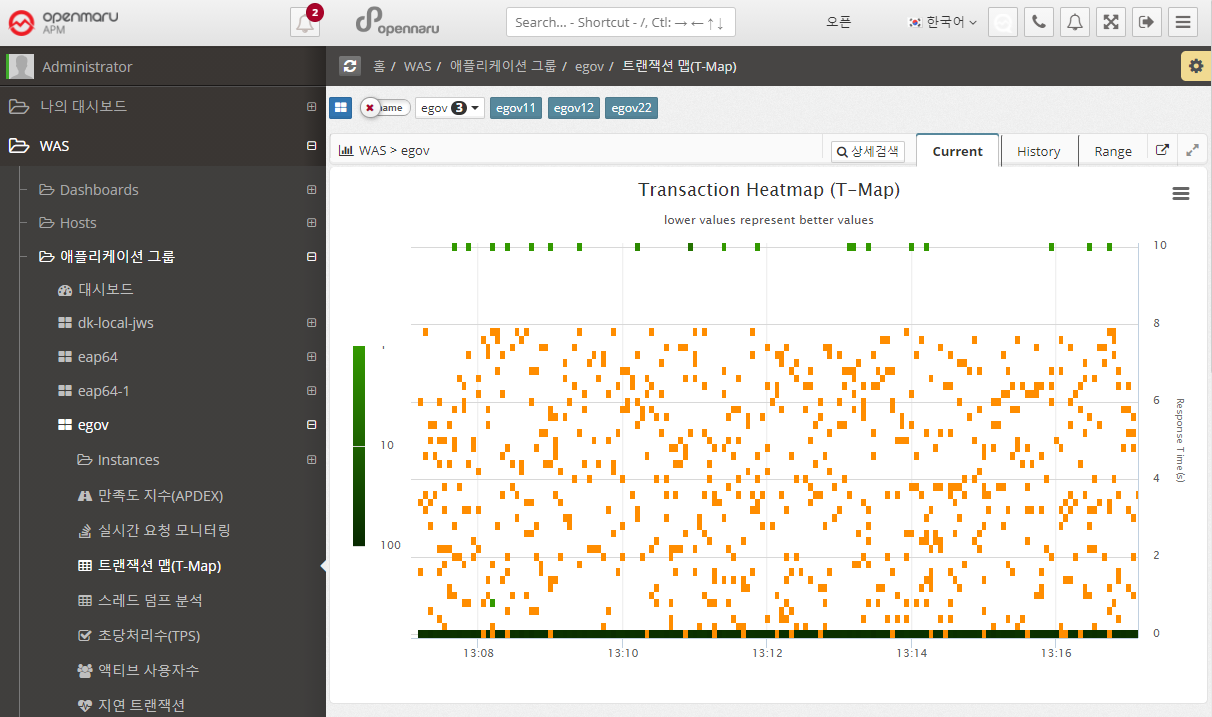
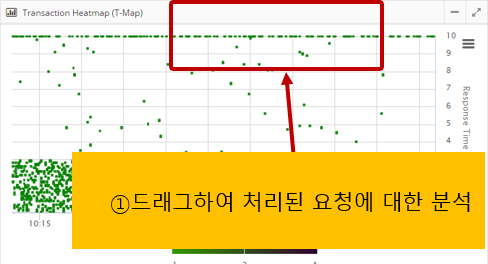
Transaction Heatmap (T-Map)
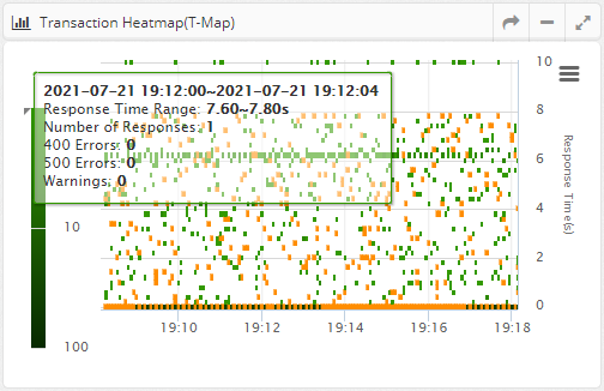
A Transaction Heatmap is a heatmap that shows the distribution of response times over time in a grid, with darker colors indicating more requests processed in a given time/response time grid.
This is shown for all instances belonging to the business application.
Cells with HTTP Status codes of 400 or 500 errors are colored with a red border.
By dragging the mouse to draw a rectangle on the Transaction Heatmap (T-Map), you can analyze the detailed transactions on a method-by-method basis for the requests processed in that area.
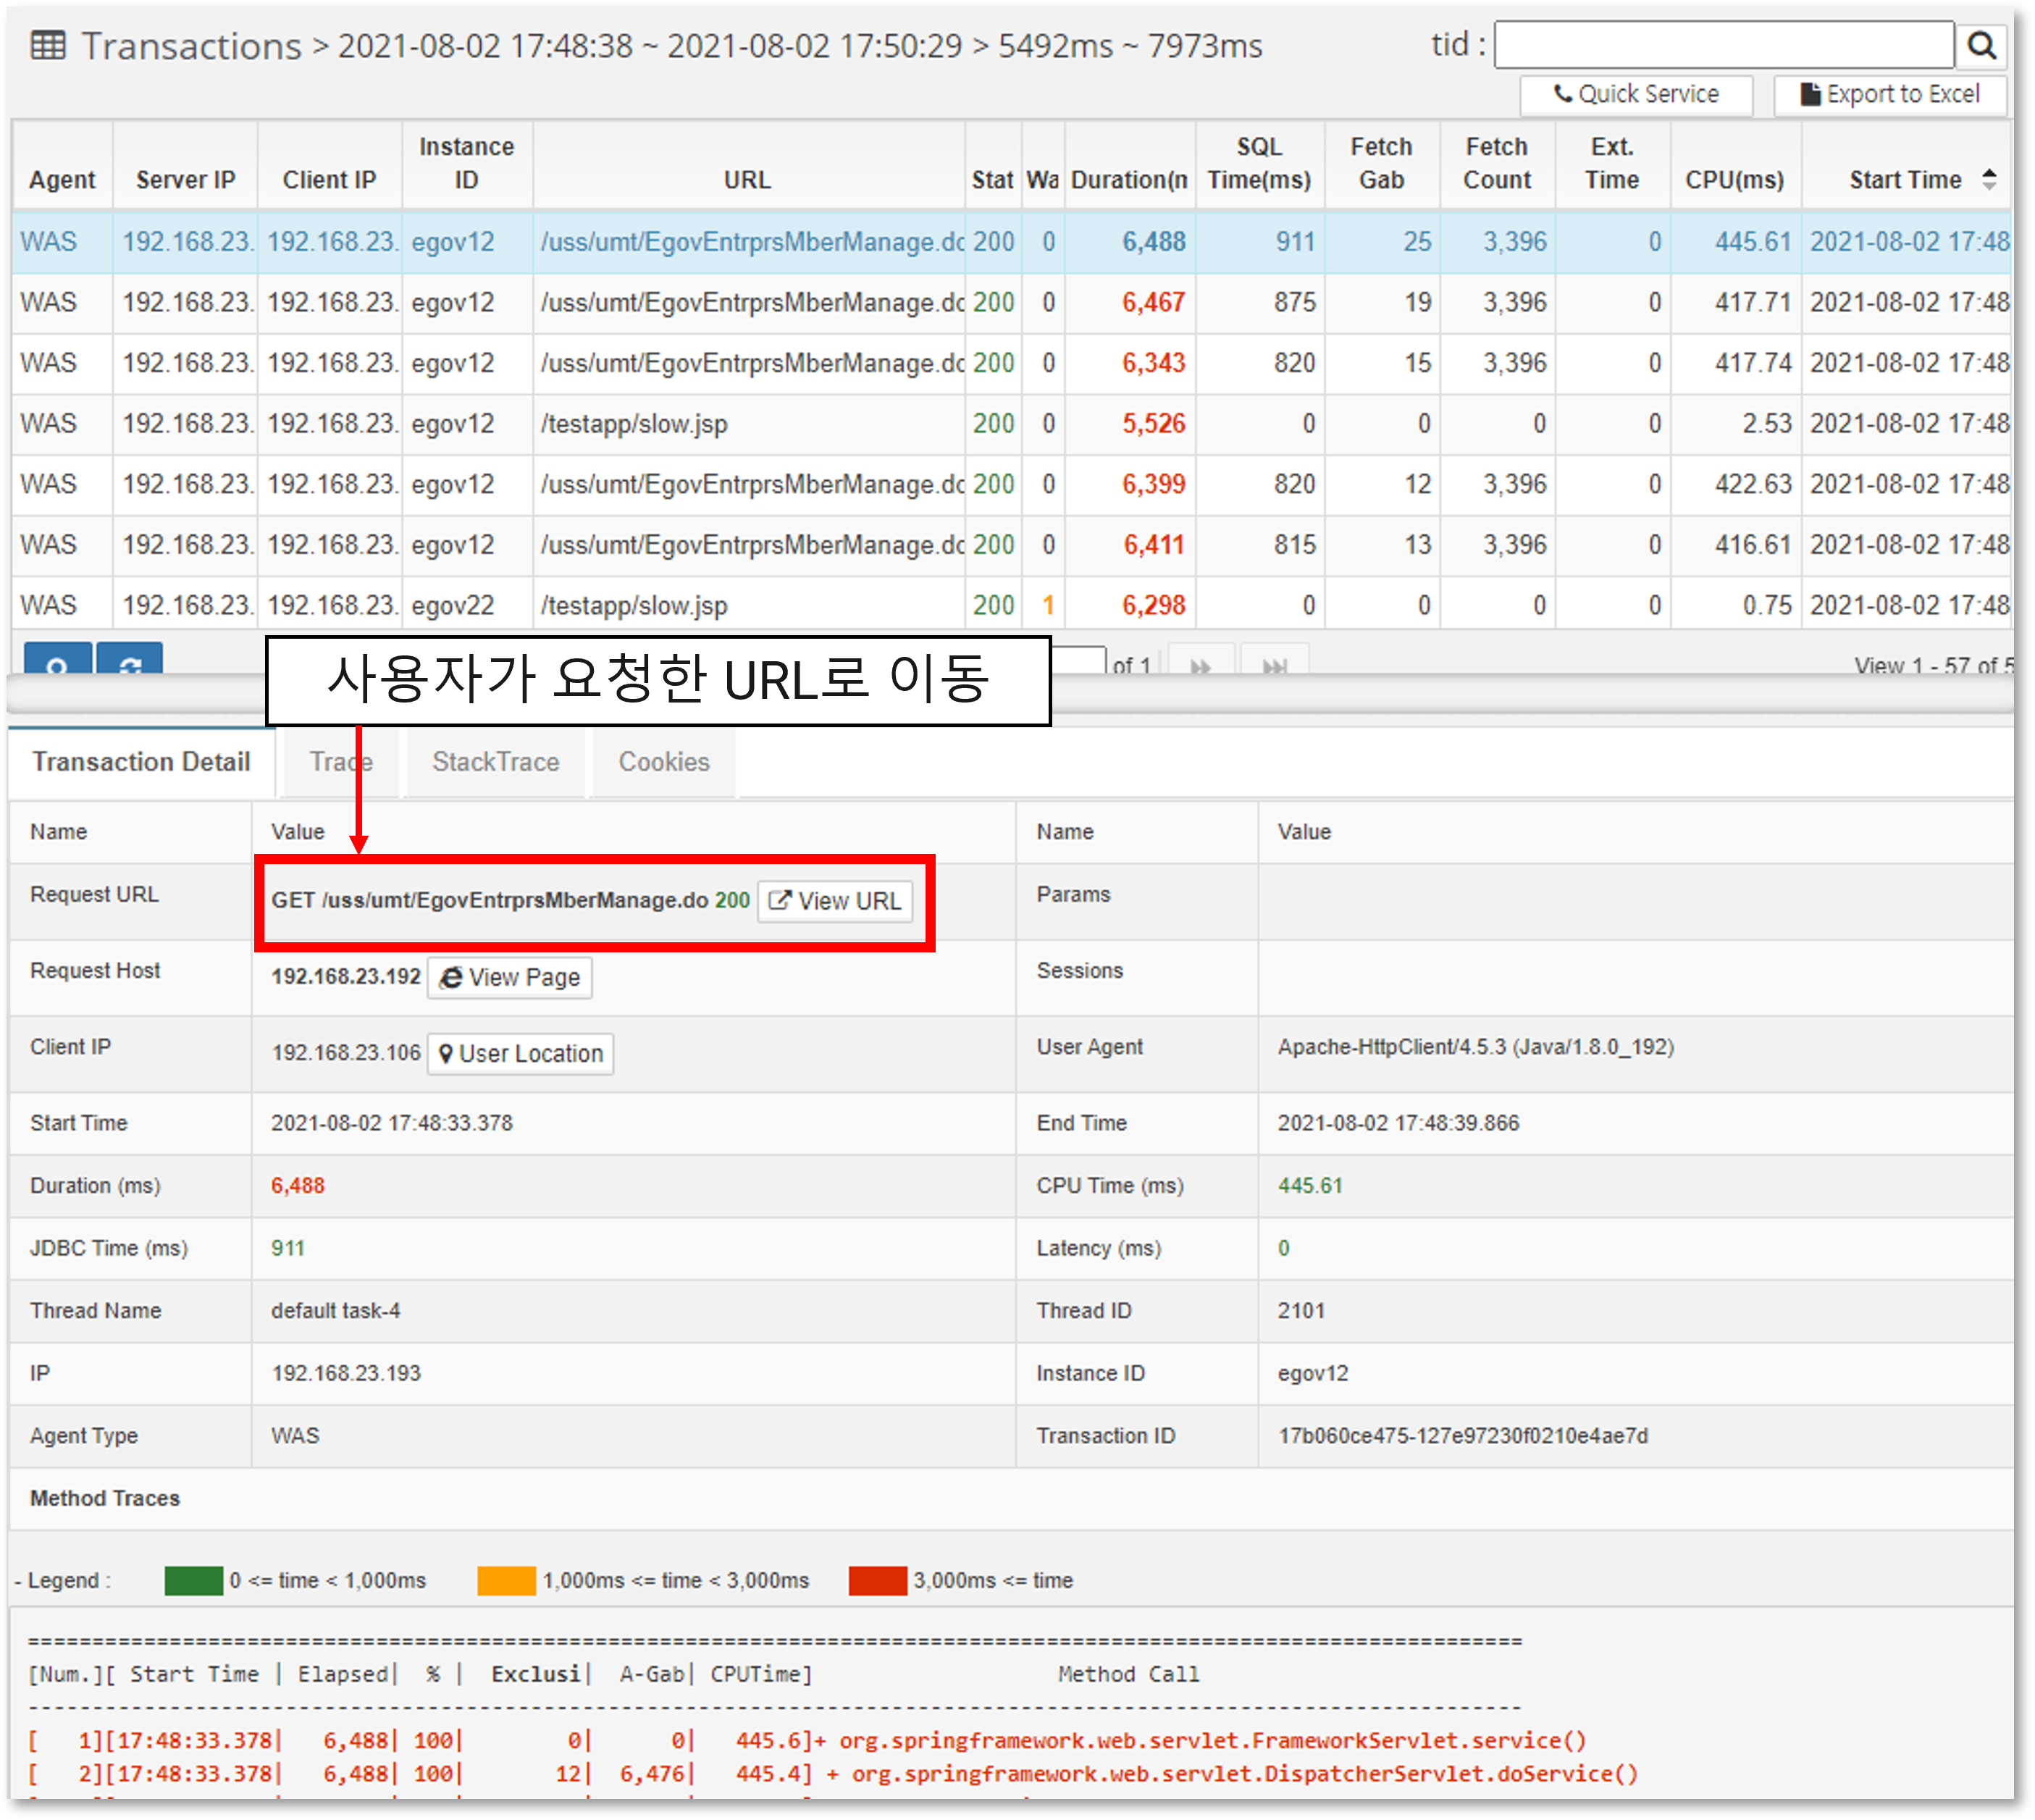
At the top, the requests executed in the selected area are displayed, and if you click Row at the top, the transaction details are displayed at the bottom.
If you click on the link of the Request URL, you can go to the URL that the user requested and see what page was actually requested. In addition, you can check the start time, execution time, sum of execution time related to the database, and CPU time.
Transaction details are displayed in the following format. If the execution time is slow, it is displayed in red.
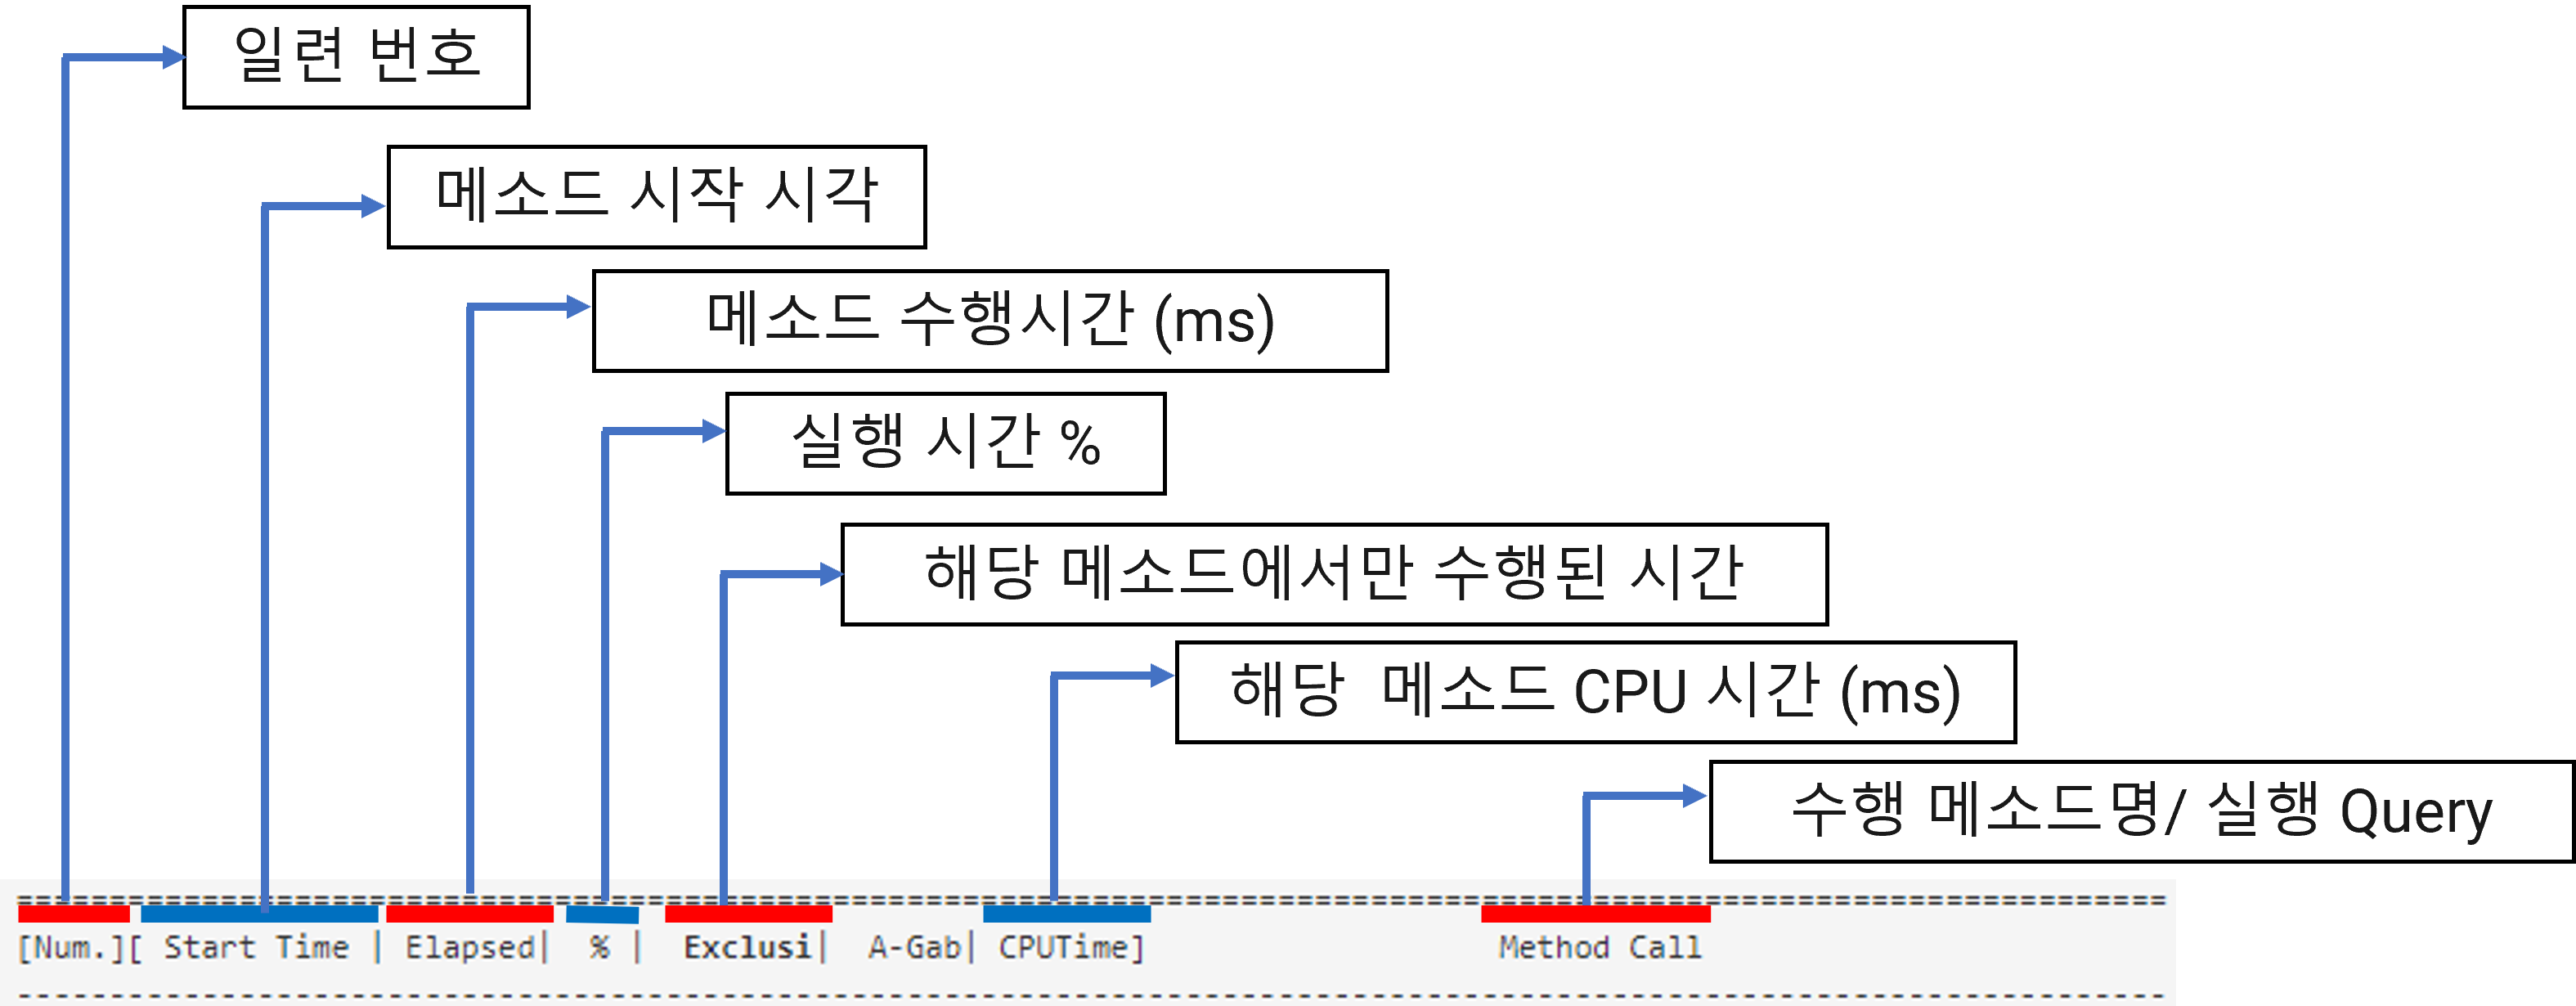
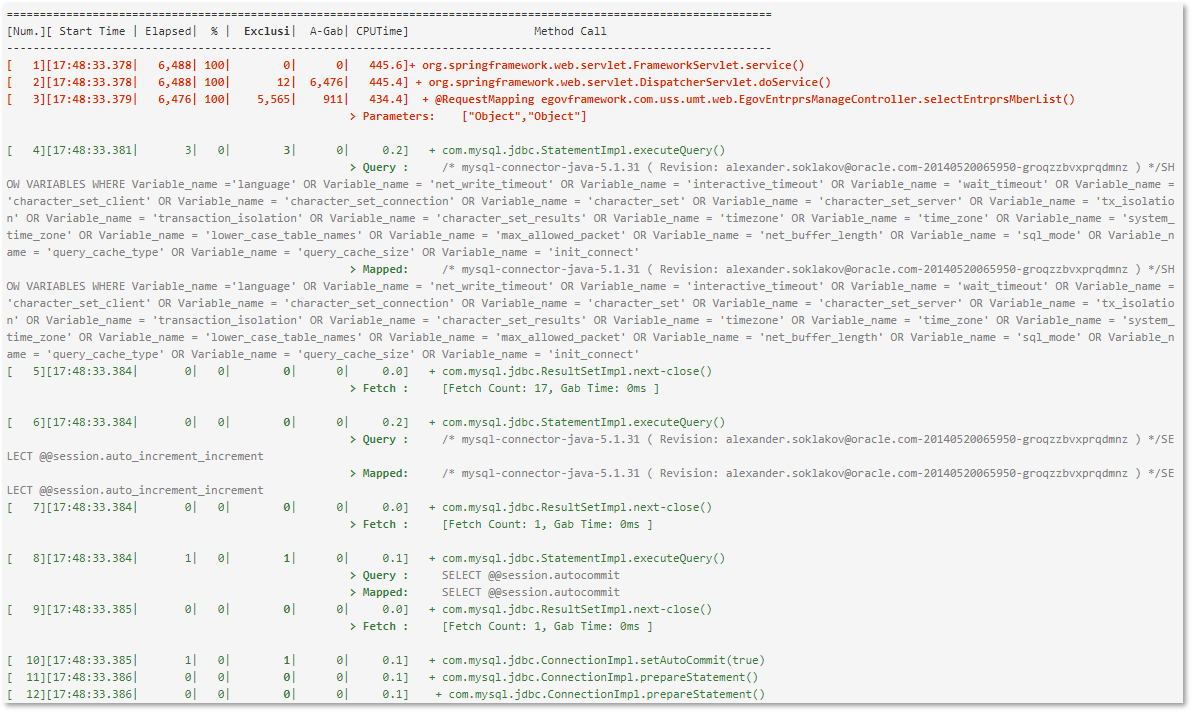
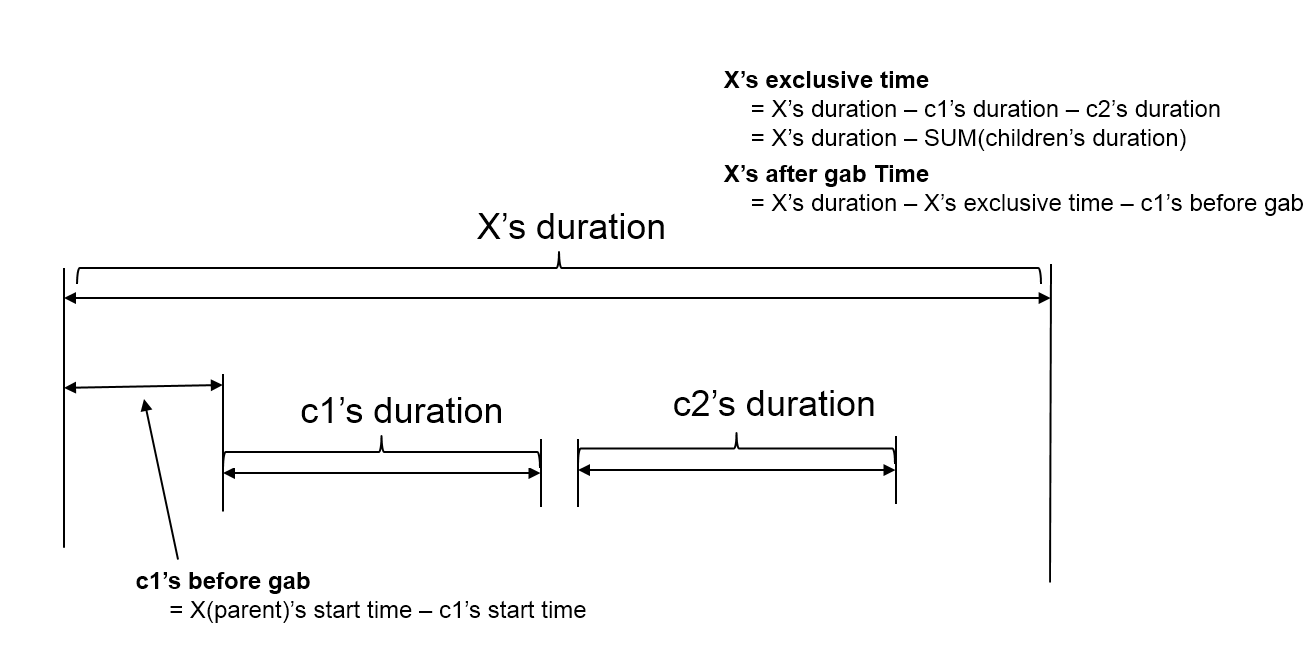
The exclusive time is calculated and displayed by calculating the time spent executing only in that method. The execution relationship of methods is represented in the form of a tree. It also displays B-Gab (Before Gab) and A-Gab (After Gab), and the calculation method is as follows.
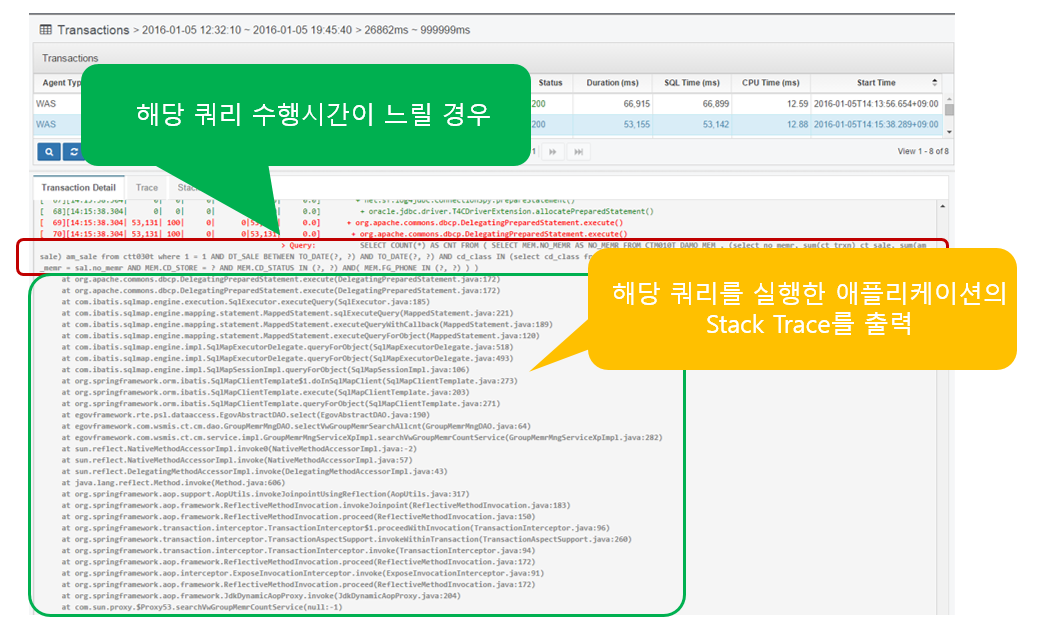
If the SQL query takes a long time to execute as shown above (set in WAS Agent), Stack Trace is output to identify the location of the application that executed the query.
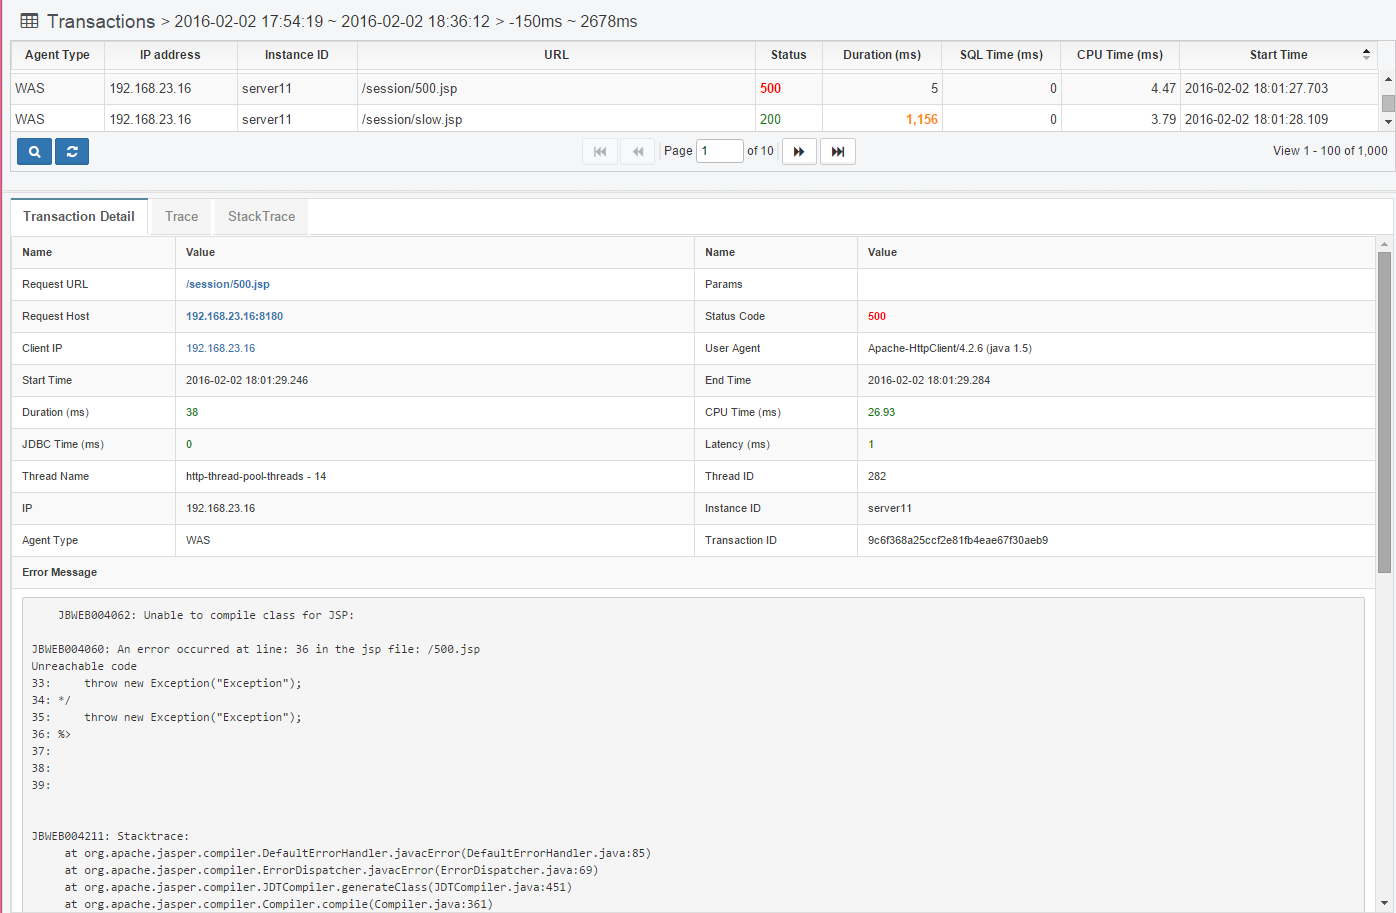
Collect all HTTP Status Code 40x and 50x error information. Among the 500 errors, errors such as JSP compilation errors are collected and displayed as error messages like below.
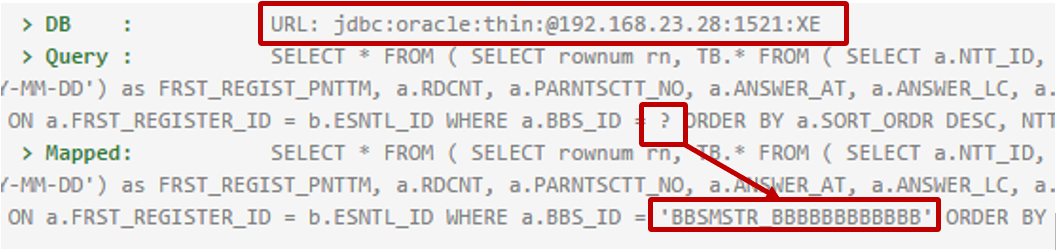
Analyze the SQL query
In the case of PreparedStatement, it is executed by setting values for each parameter in the SQL statement written with '?'.
Displays the SQL statement of PreparedStatement or CallableStatement executed in Transaction Trace, replacing '?' with the value set by the program and outputting it to the 'Mapped:' item. item by replacing '?' with the value set by the program.
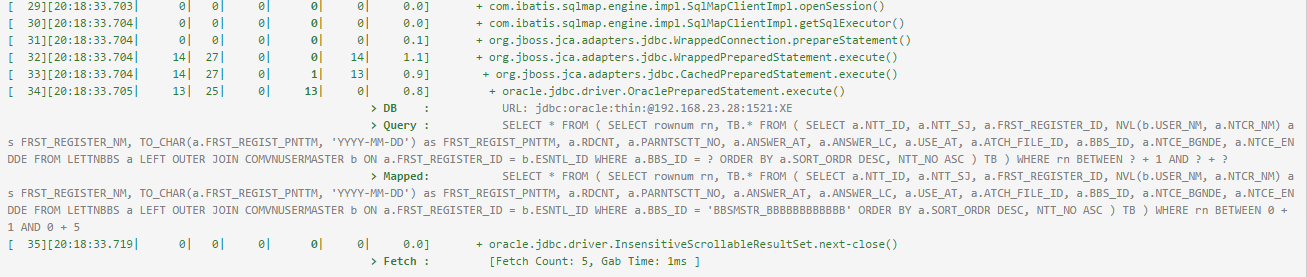
You can copy the Mapped SQL statement and run it in a database query tool.
The JDBC URL of the database where the query was executed is also displayed.
After executing the SQL statement, the ResultSet’s next() function is used to get the value, which displays the number of hits and the time it took.
![]()
Fetch Count means the number of times the next() function was called, and Gab Time means the time from the first next() function execution until the ResultSet close() function is called.
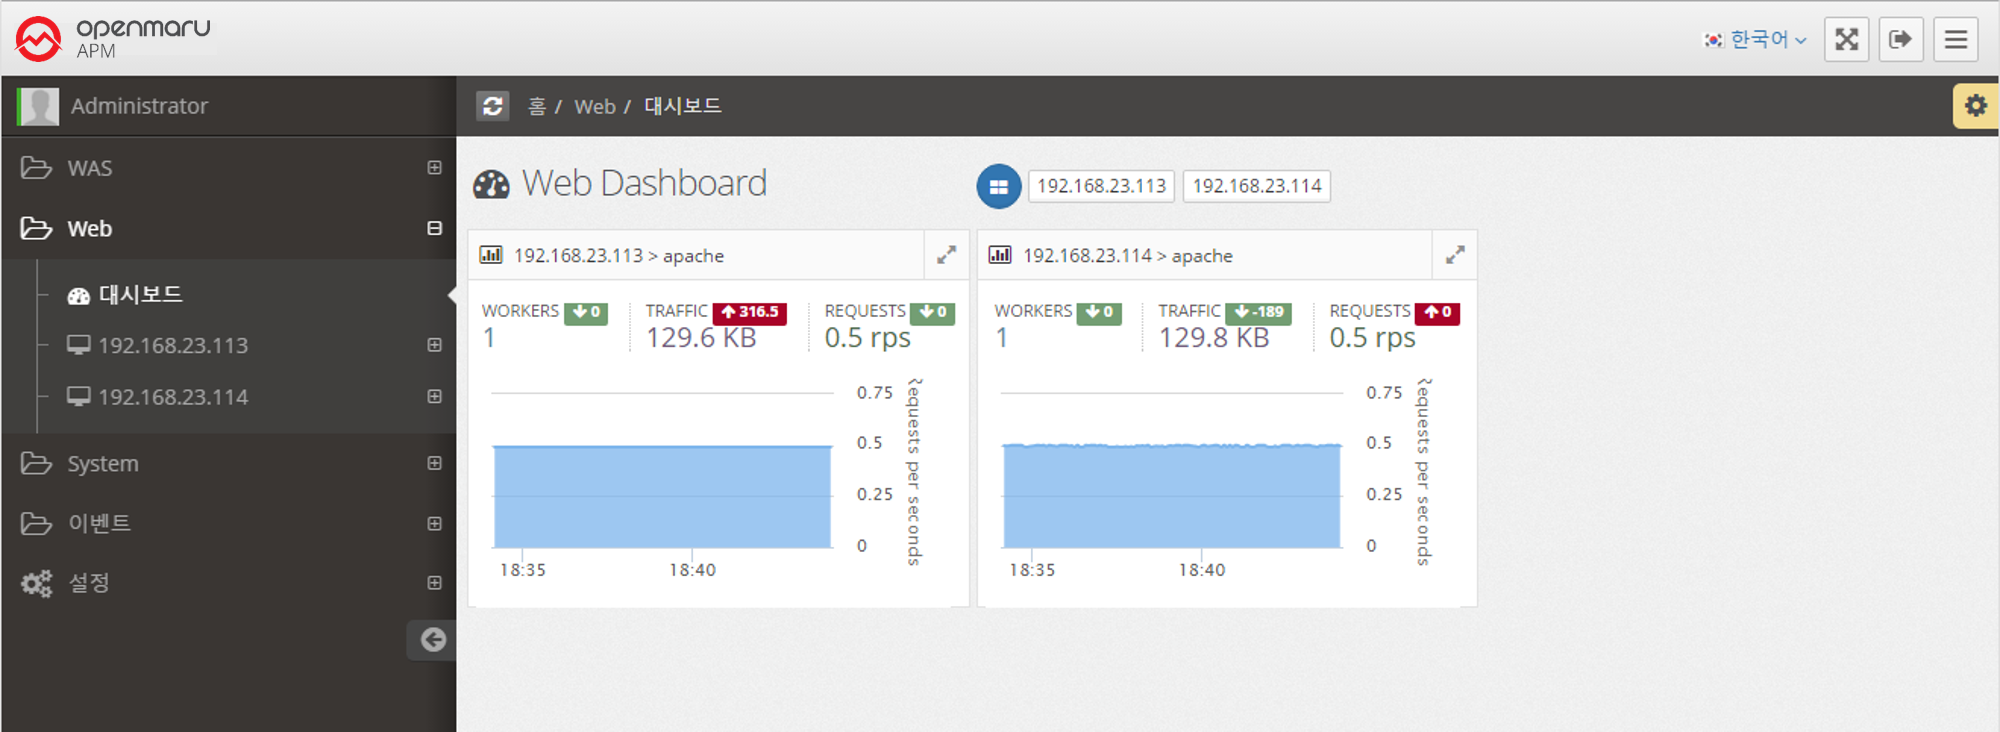
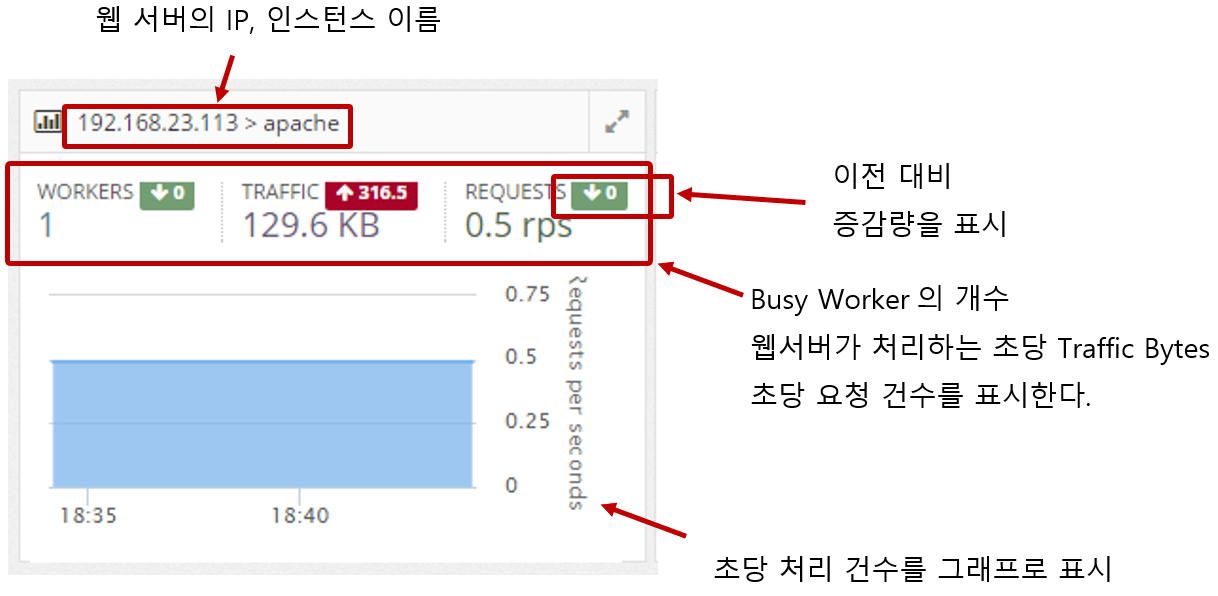
APM WEB Dashboard
It collects the information of the web server through the Apache Plugin in the System Agent on the machine where the Apache web server is installed.
It monitors the number of processes per second, the amount of traffic transferred per second, and the status of worker threads of Apache web servers and displays a dashboard of web servers on the screen.
2.2.1 Server information by WAS instance
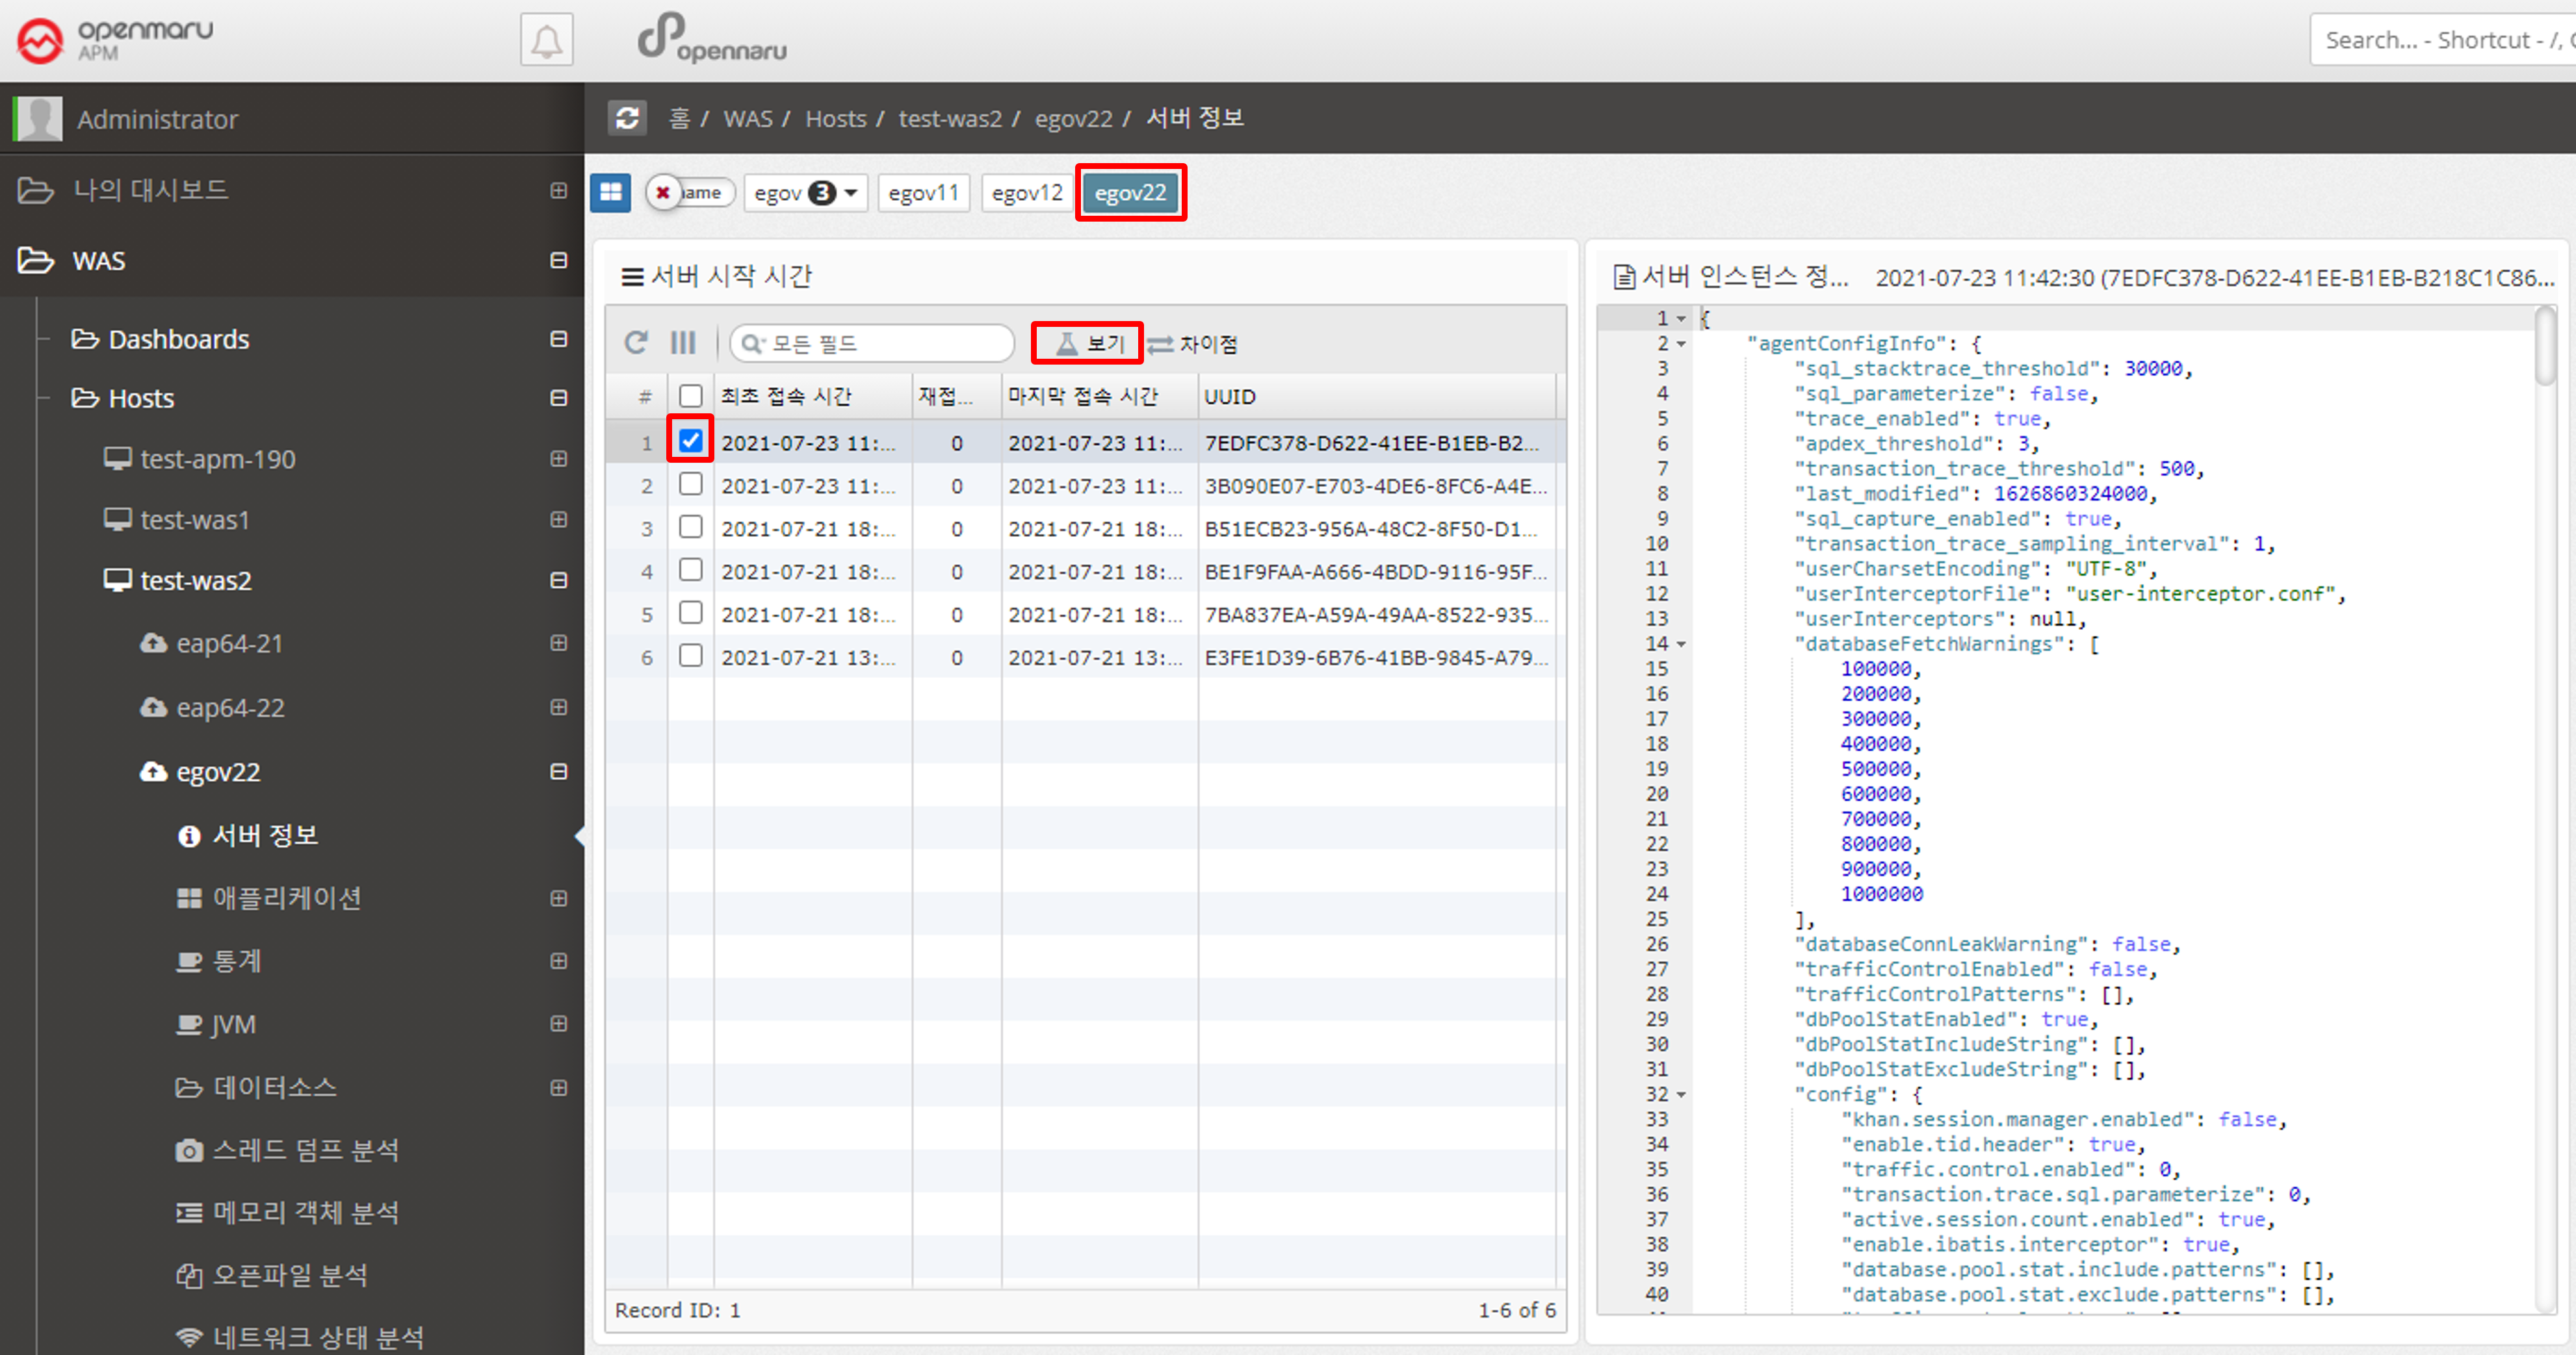
Displays the information of the WAS instance.
You can check the version of Java used when running WAS, classpath, values set in System Property, OS environment variable settings, and APM WAS Agent’s main settings.
Because WAS collects and stores information each time it runs, you can see when WAS ran and what values were changed. If you press 'Ctrl + F' on the displayed text, you can search the text.
2.2.2 Application by WAS Instance
User Satisfaction Index (APDEX).
-
Problems.
-
TPS, Response Time, Sessions There are so many numbers to look at, it’s hard to know what to look at.
-
Response Time numbers alone are meaningless without context.
-
Communication between IT and business is difficult.
-
User satisfaction with the system is unknown.
-
-
Solution.
-
Apdex can provide a numerical representation of user satisfaction with the application.
-
Multiple metrics can be expressed in a single number.
-
Application performance index can be expressed as a number from 0 to 100 for easy viewing.
-
OPENMARU APM calculates and displays the user satisfaction index (APDEX) by task and the user satisfaction index by instance.
It also displays pending requests according to the level of the user satisfaction index.
The response time to satisfy a user varies depending on the type and nature of the business system. You can specify the response time that satisfies the user in the WAS Agent’s configuration file.
Application > Satisfaction Index (APDEX)
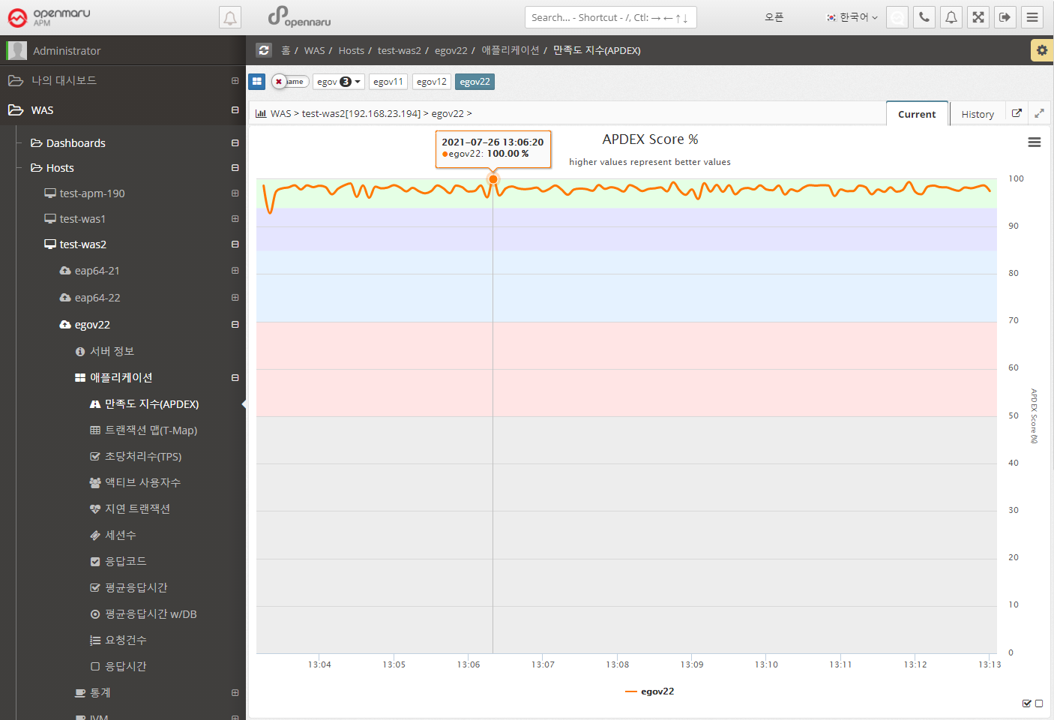
Displays the instance-specific user satisfaction index (APDEX). For the calculation method, see "3.4 What is APDEX?".
Application > Transaction Map (T-Map)
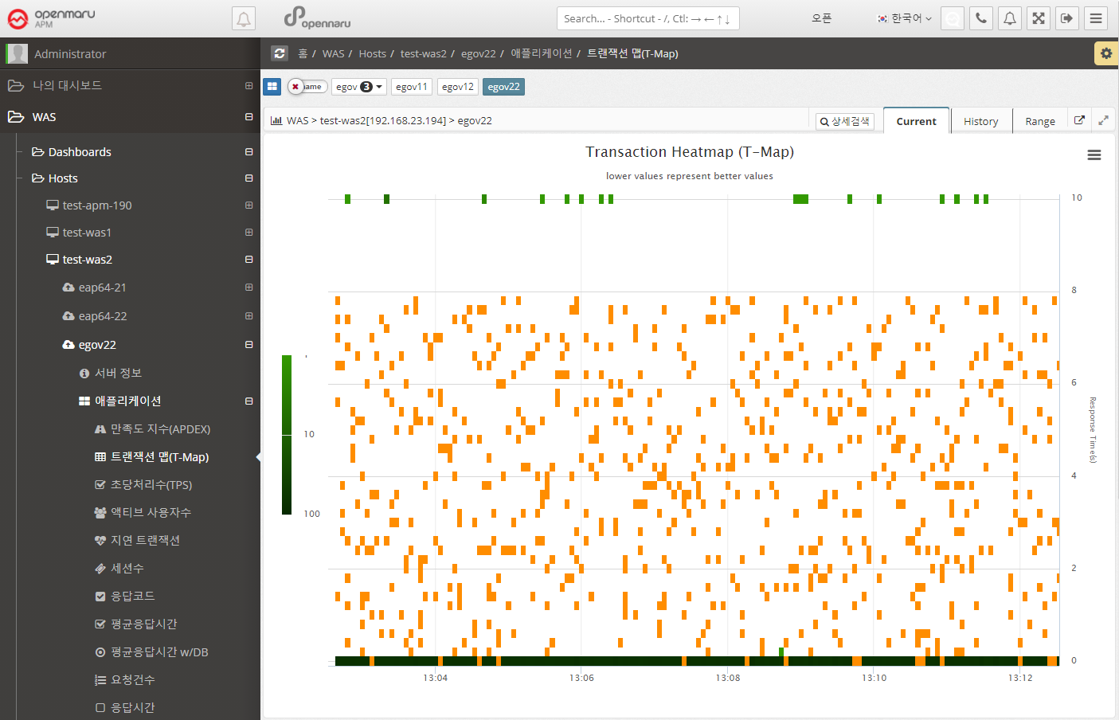
A chart that displays a scatter plot of user requests by response time per instance. Similar to the Transaction Map (T-Map) in the dashboard, you can drag the mouse to pop up the transactions that were executed at that time and analyze the detailed execution time.
For more information, see "APM Dashboard Screen Configuration - Transaction Heatmap (T-Map)".
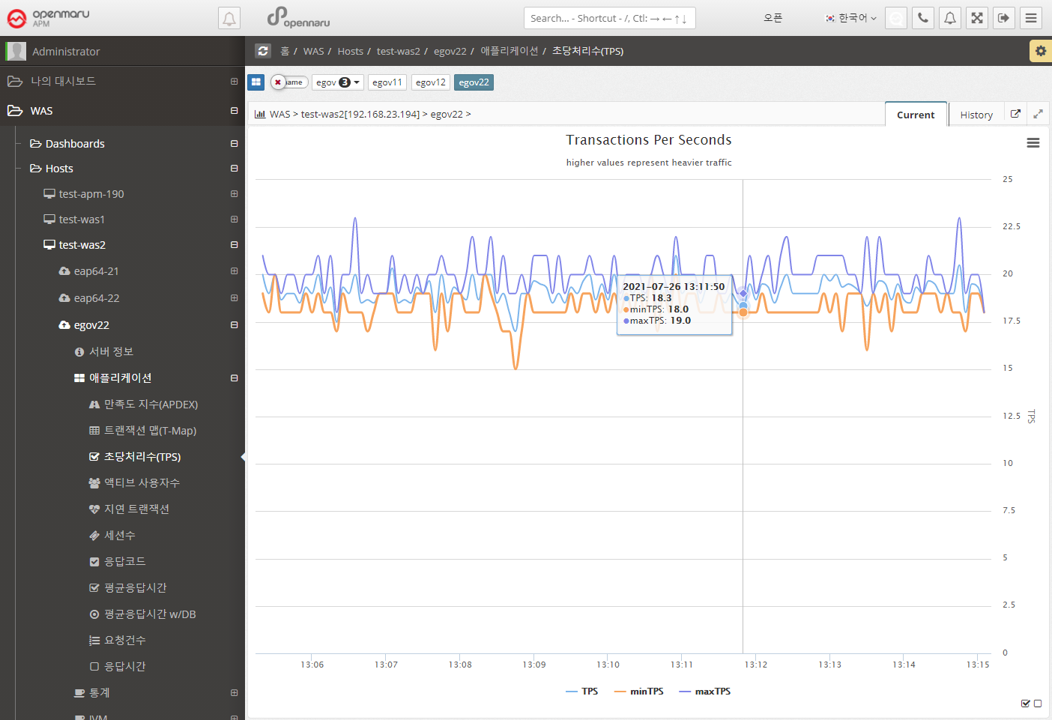
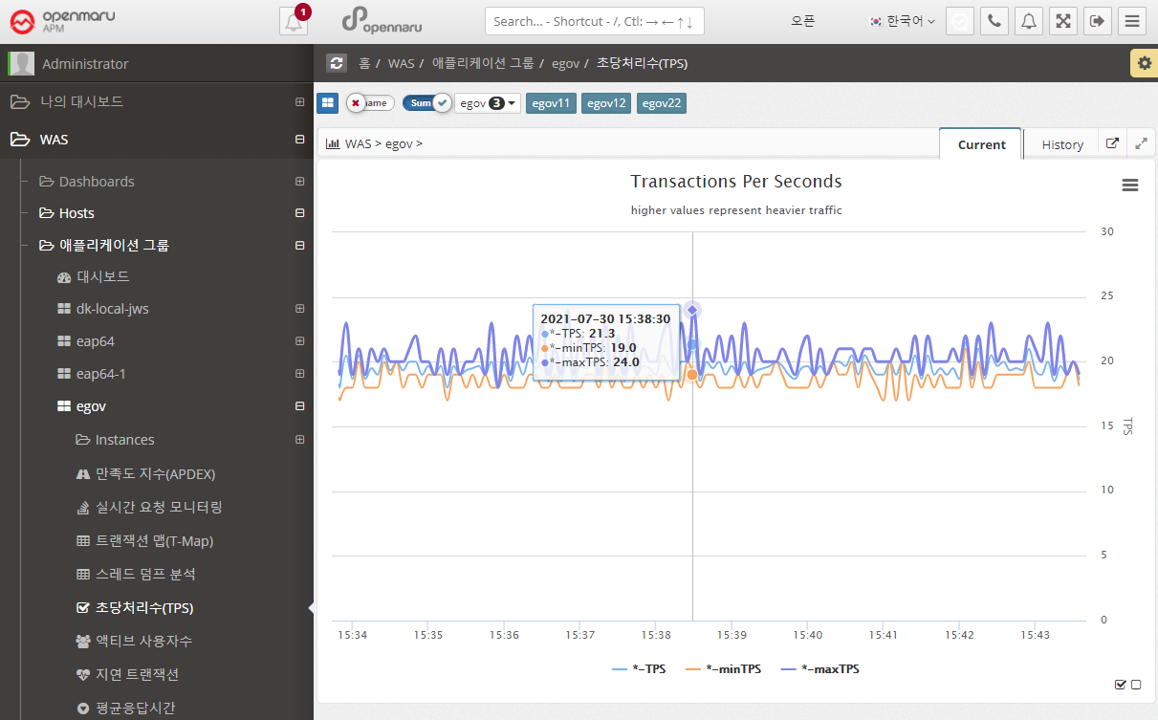
Applications > Transactions Per Second (TPS)
Displays a graph of the number of transactions per second per instance.
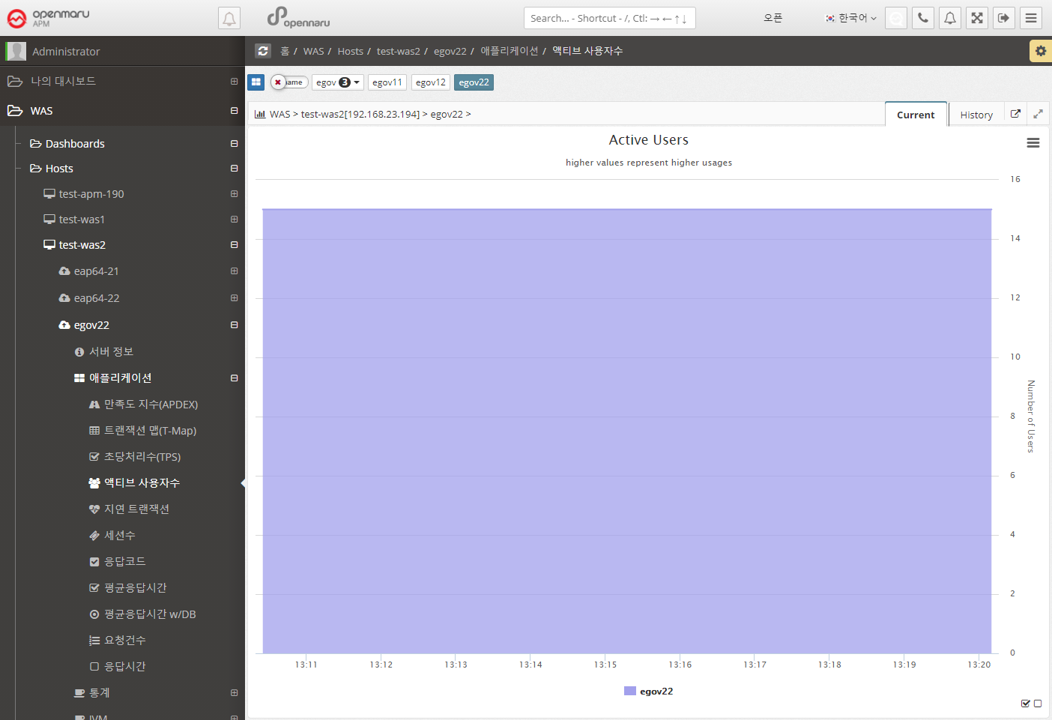
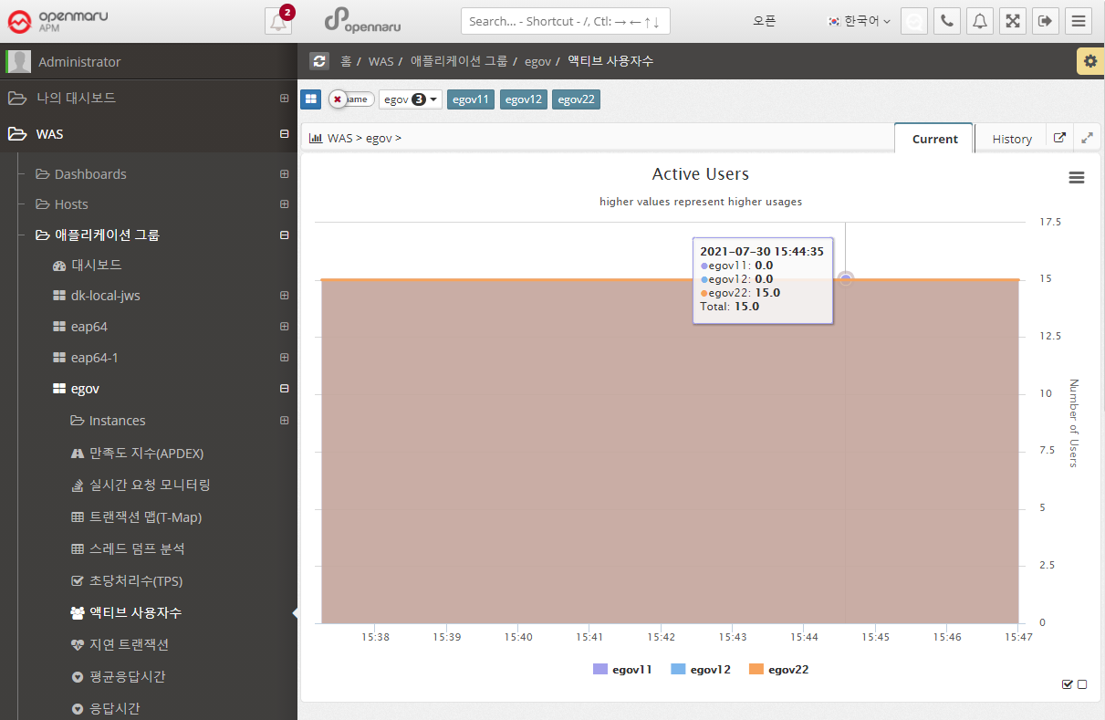
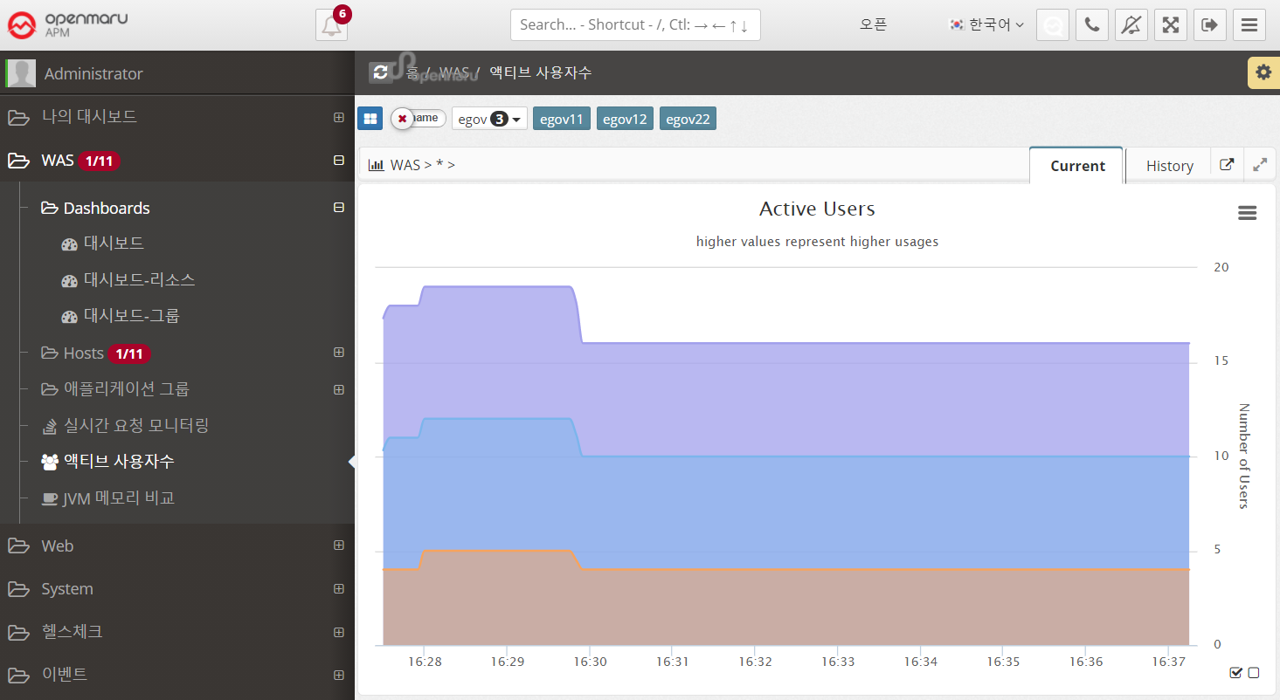
Application > Active Users
Displays the number of active users per instance in a graph. The number of active users uses cookies to identify unique users and is calculated by summing the number of users with unique cookie values who have sent requests within 5 minutes.
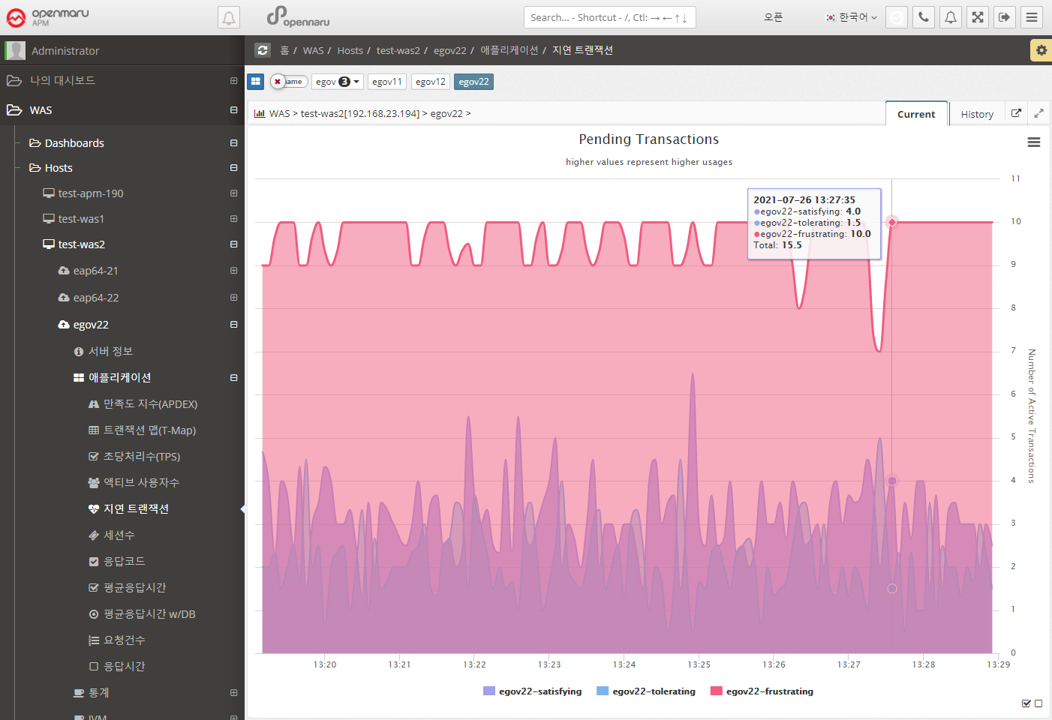
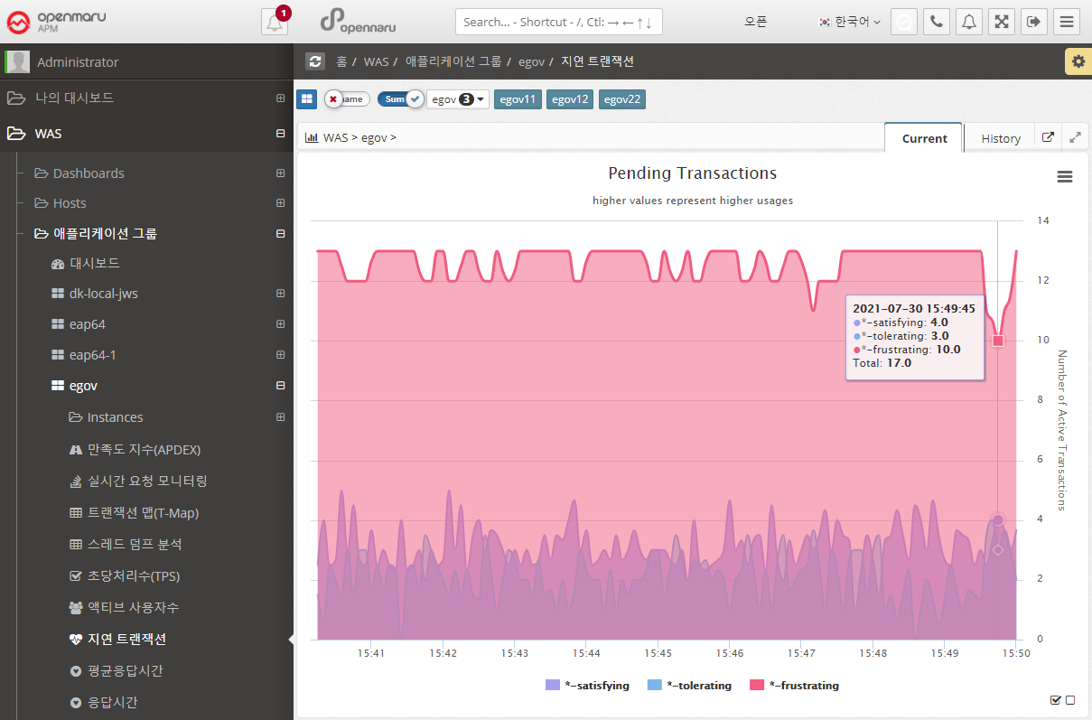
Applications > Lazy Transactions
Displays the latency information of all WAS instances in the business system in the form of Satisfying, Tolerating, and Frustrating statistics.
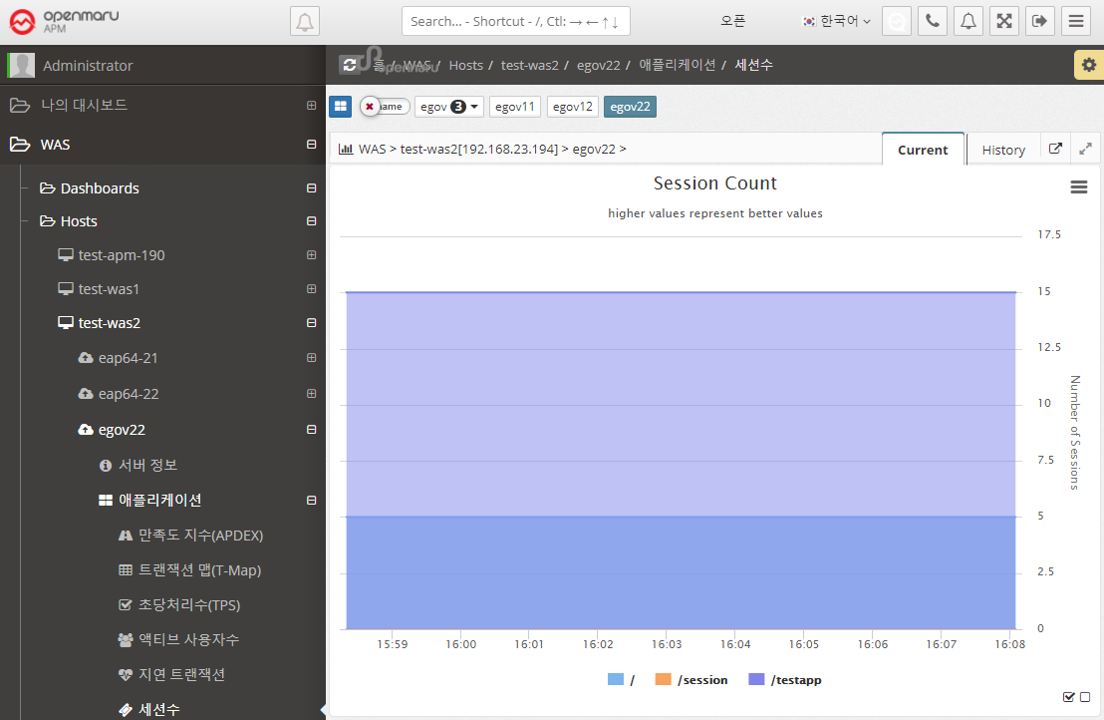
Application > Sessions
Graphically displays the number of sessions created in WAS per WAS instance, by web application context. Sessions in WAS are set by the session-timeout value in the application web.xml configuration file, as follows. The time unit is minutes.
<session-config>
    <session-timeout>30</session-timeout>
</session-config>
In the Sessions graph, you can see which applications are deployed in WAS.
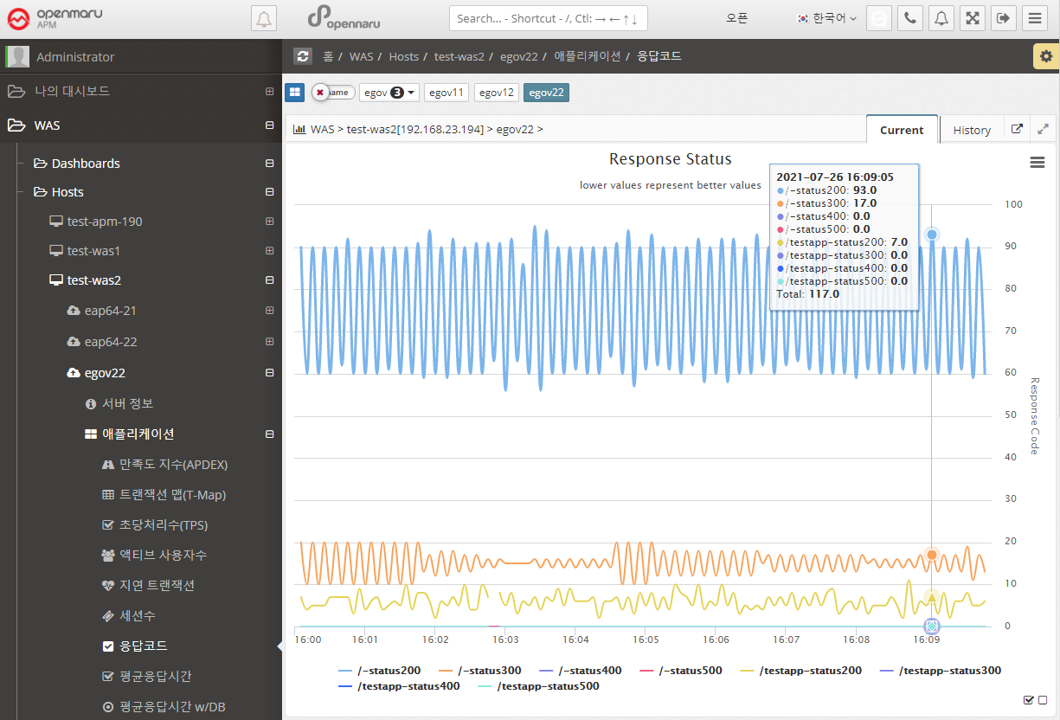
Applications > Response Codes
Summarize the number of HTTP Status response codes by WAS instance and application context by 20x, 30x, 40x, and 50x numbers and display the number in a graph.
2.2.3 Statistics by WAS Instance
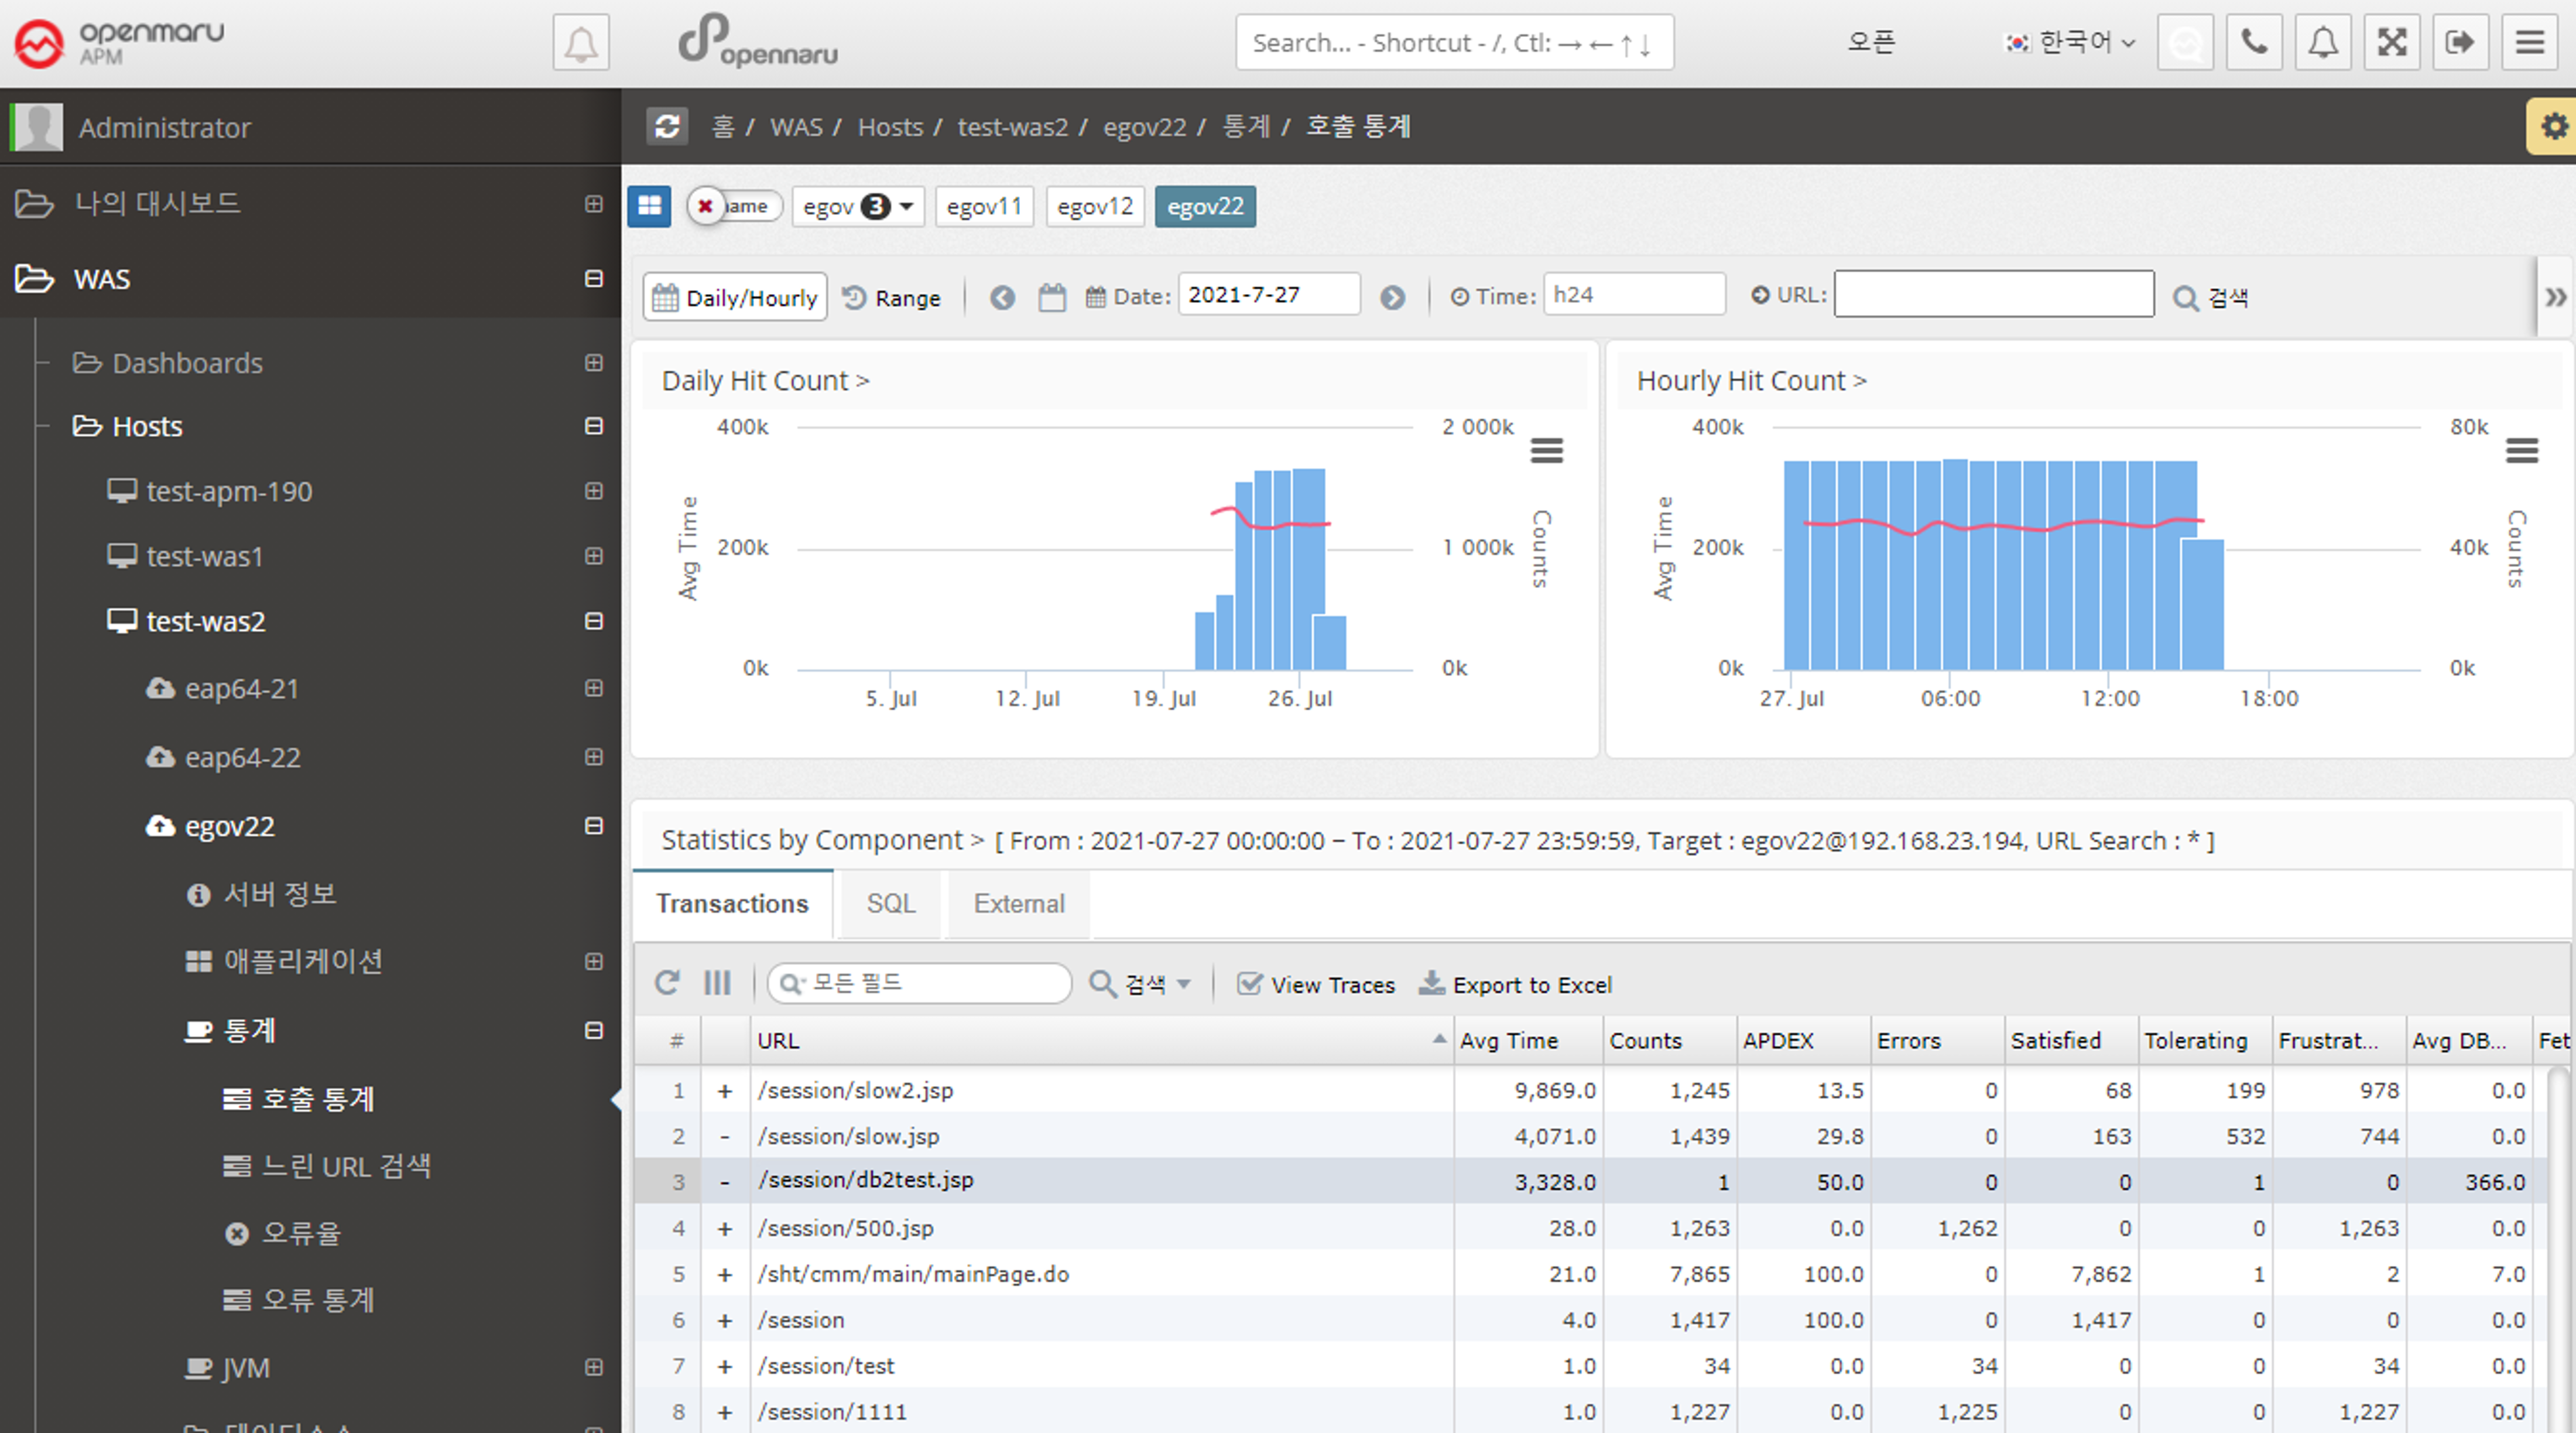
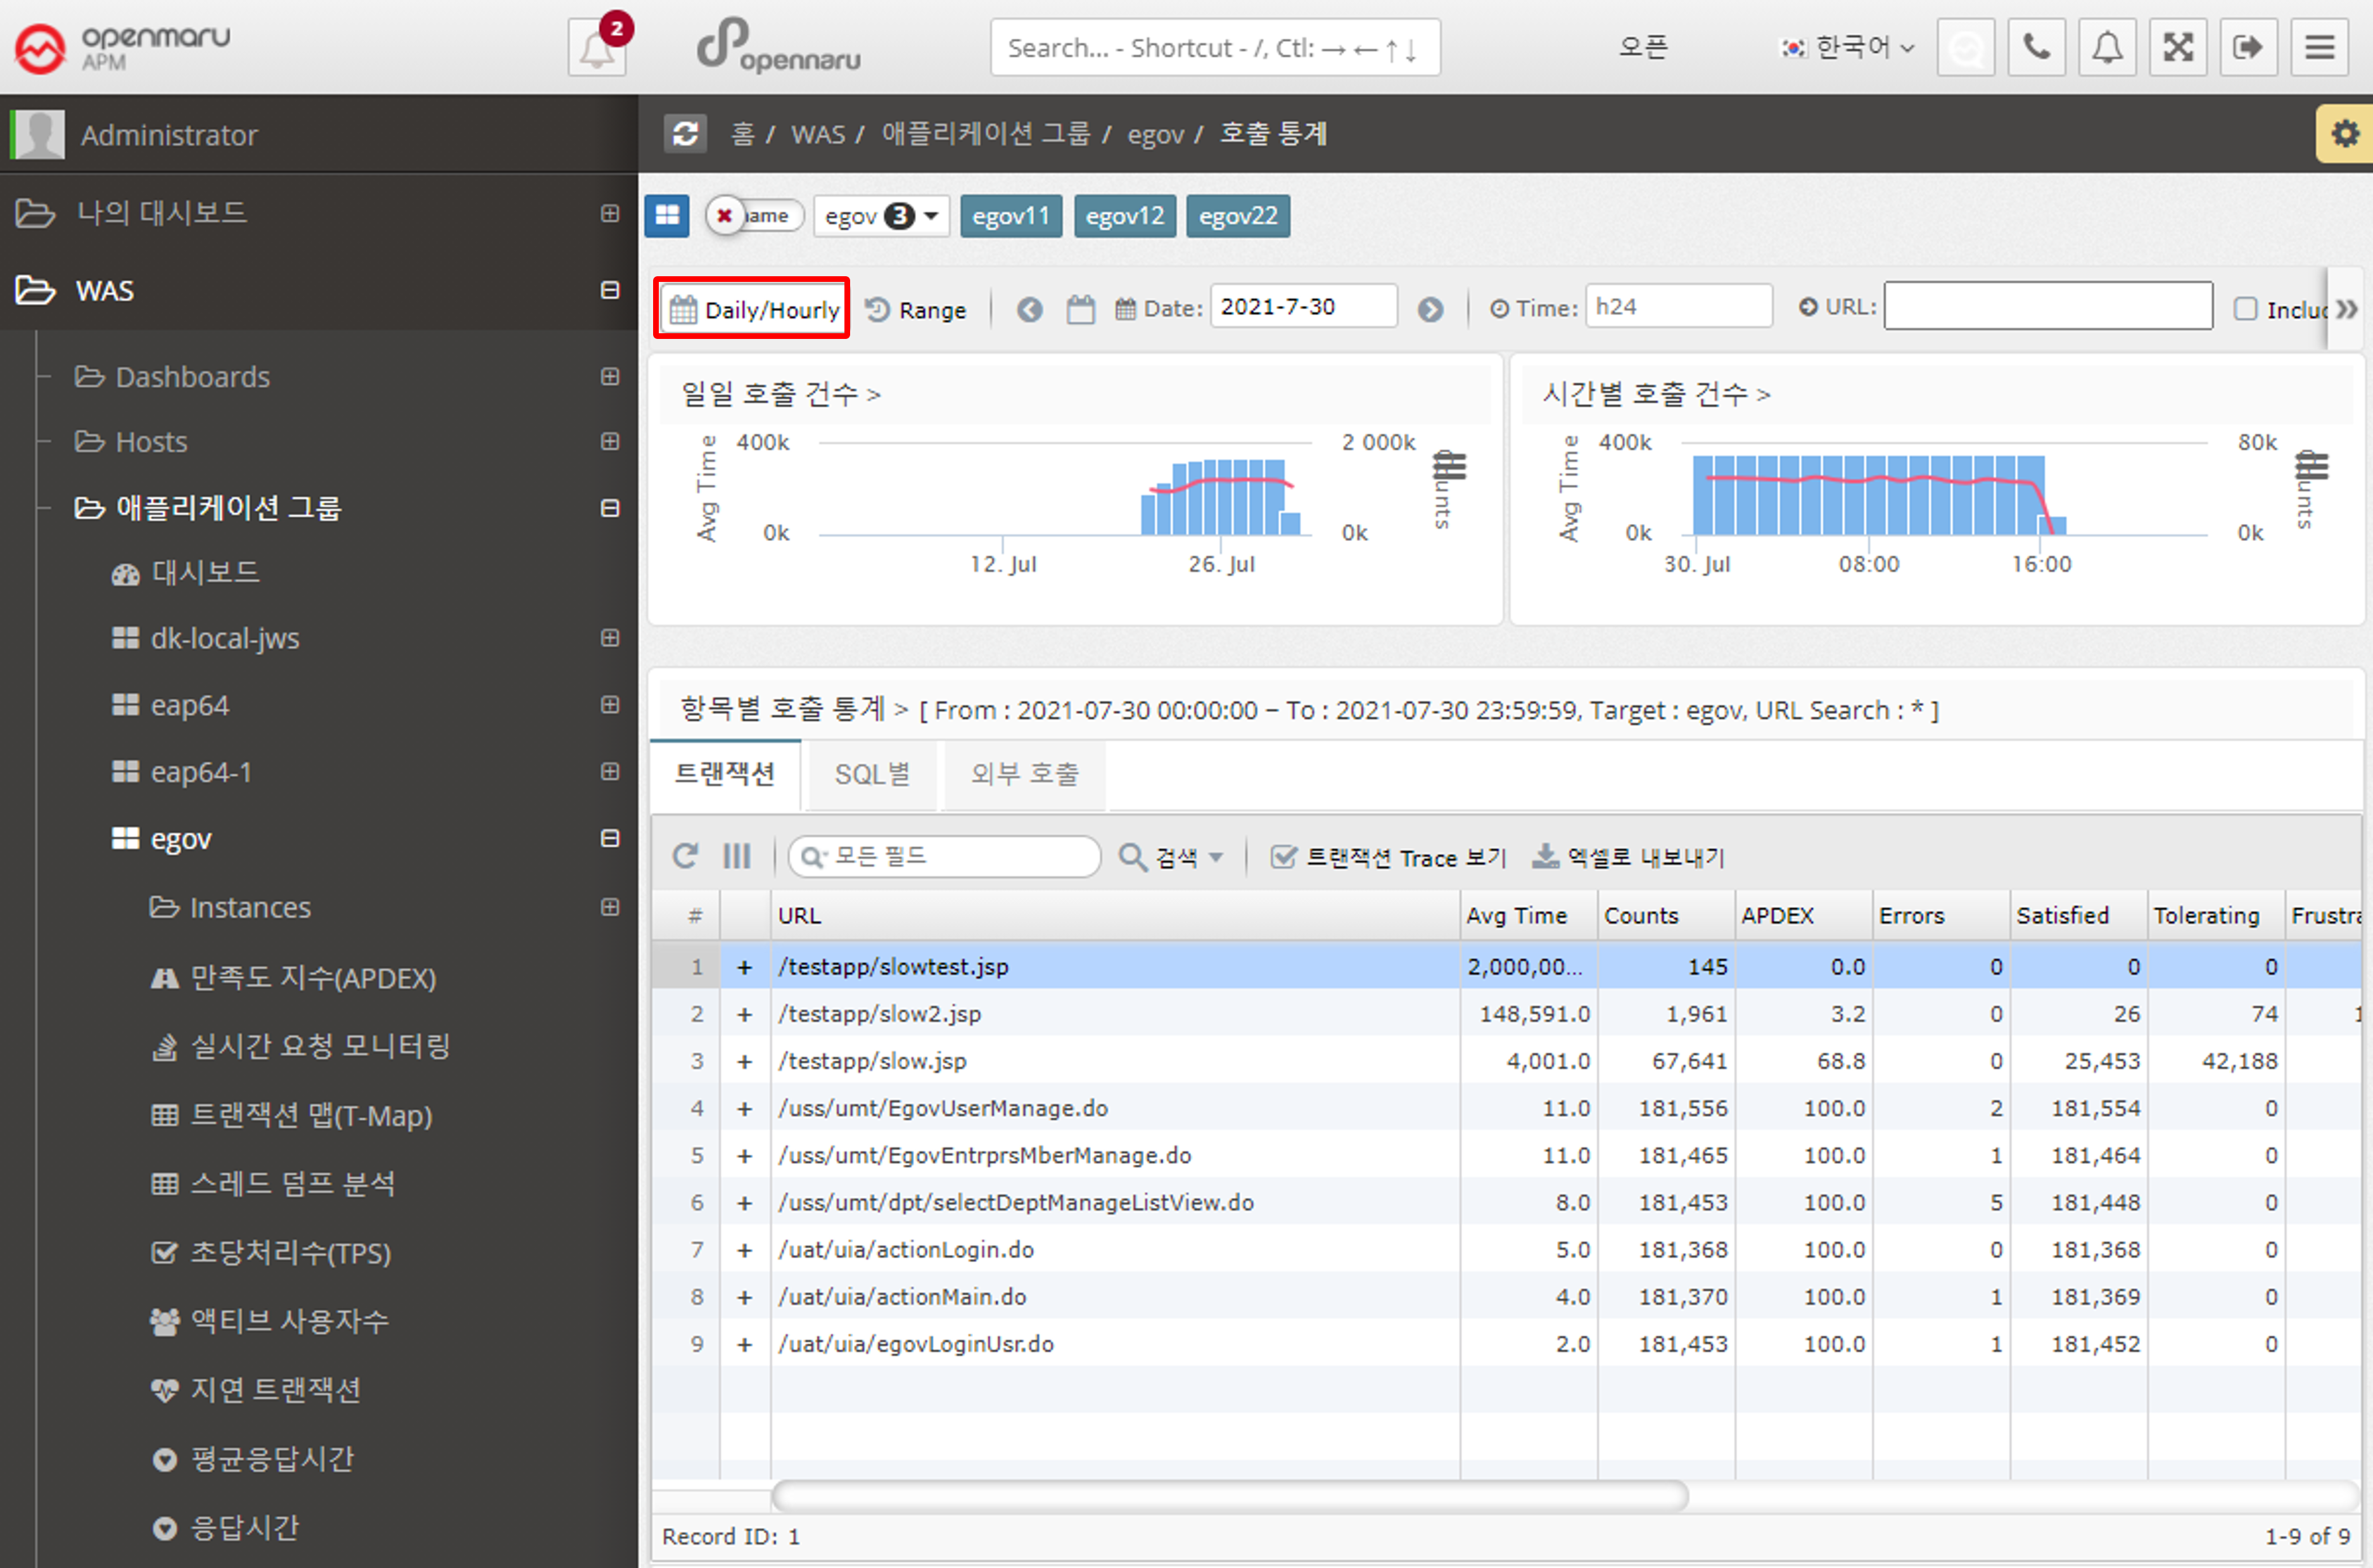
Statistics > Call Statistics
Displays the number of URL calls, SQL query executions, and external calls using HTTP Client by day and hour.
-
When a date is selected as 'Daily/Hourly', the number of daily and hourly calls for the month is displayed in a graph with the APDEX index.
-
Displays the URLs with the slowest average response time on that day in a list at the bottom.
-
Displays information such as average response time, number of calls, number of errors, number of satisfaction ratings, and average SQL query execution time for a given URL.
-
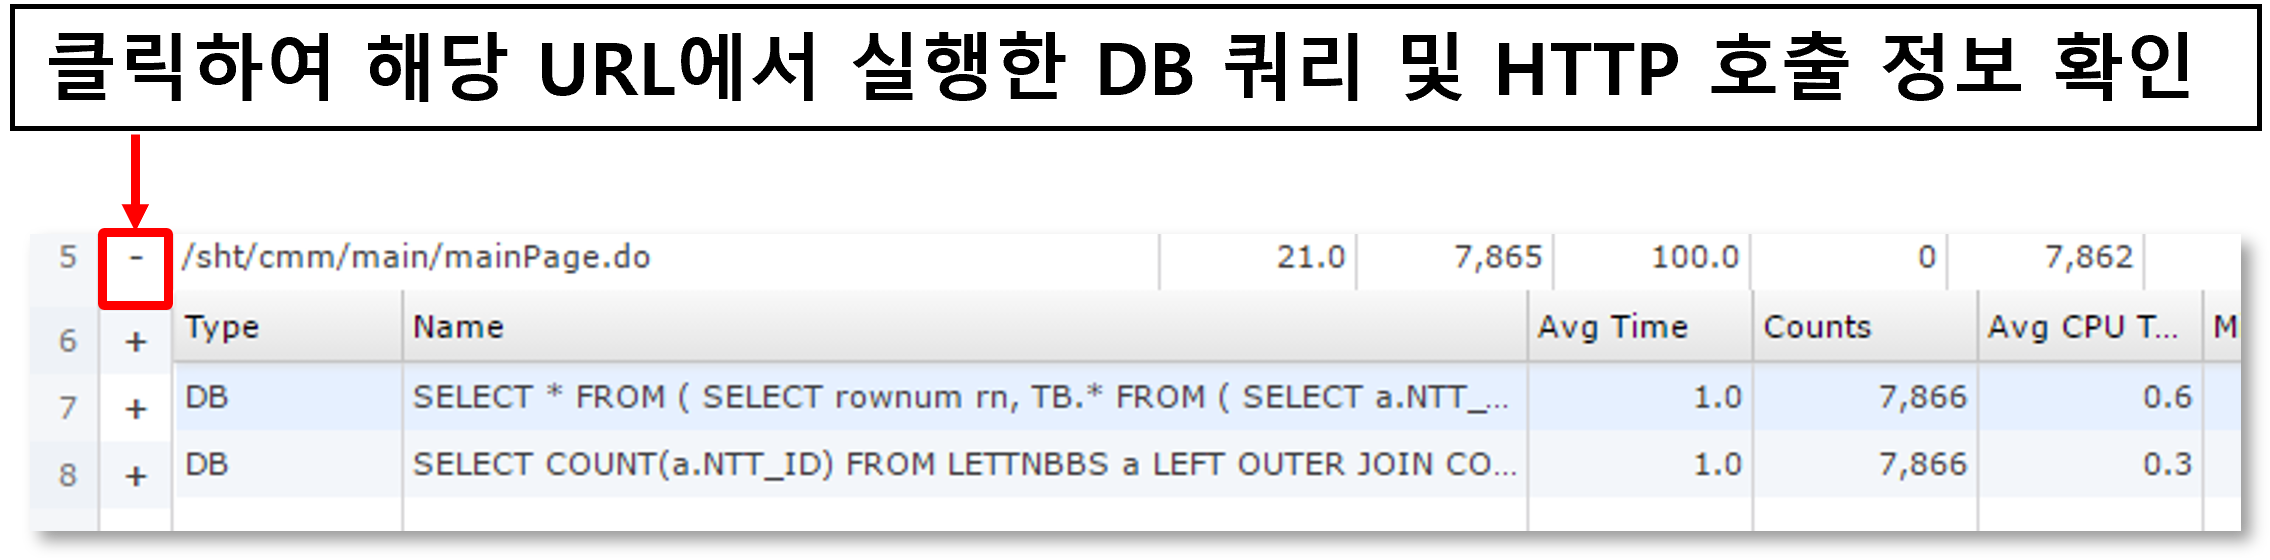
You can check the statistics of SQL and HTTP calls called within a URL.
-
See below for how to search for a specific date, time, or URL.
![]()
-
You can search by selecting a date range.
![]()
-
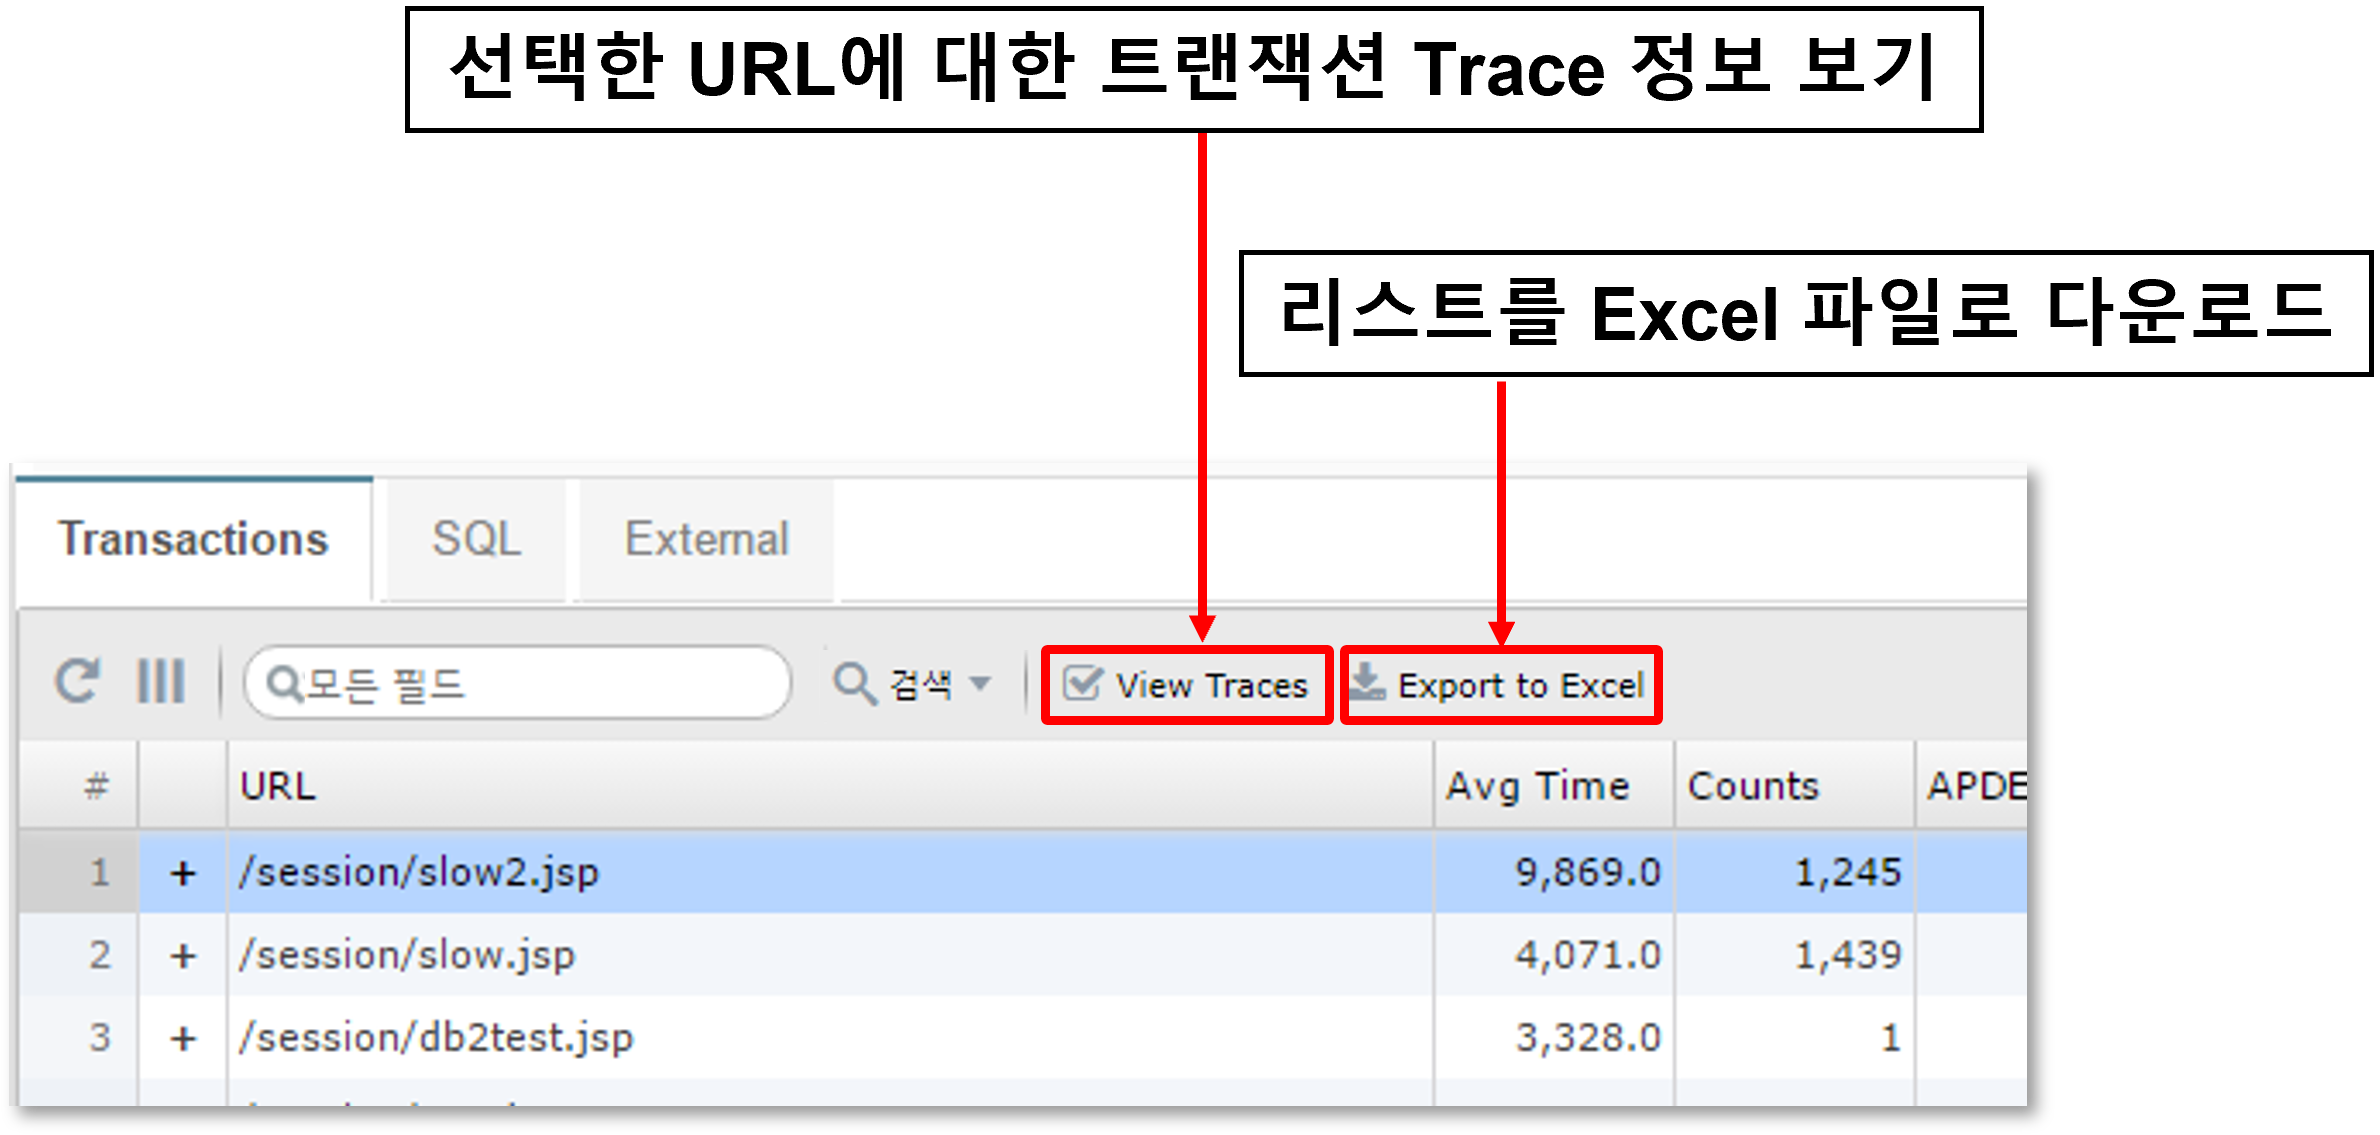
You can check the transaction trace information for the URL.
-
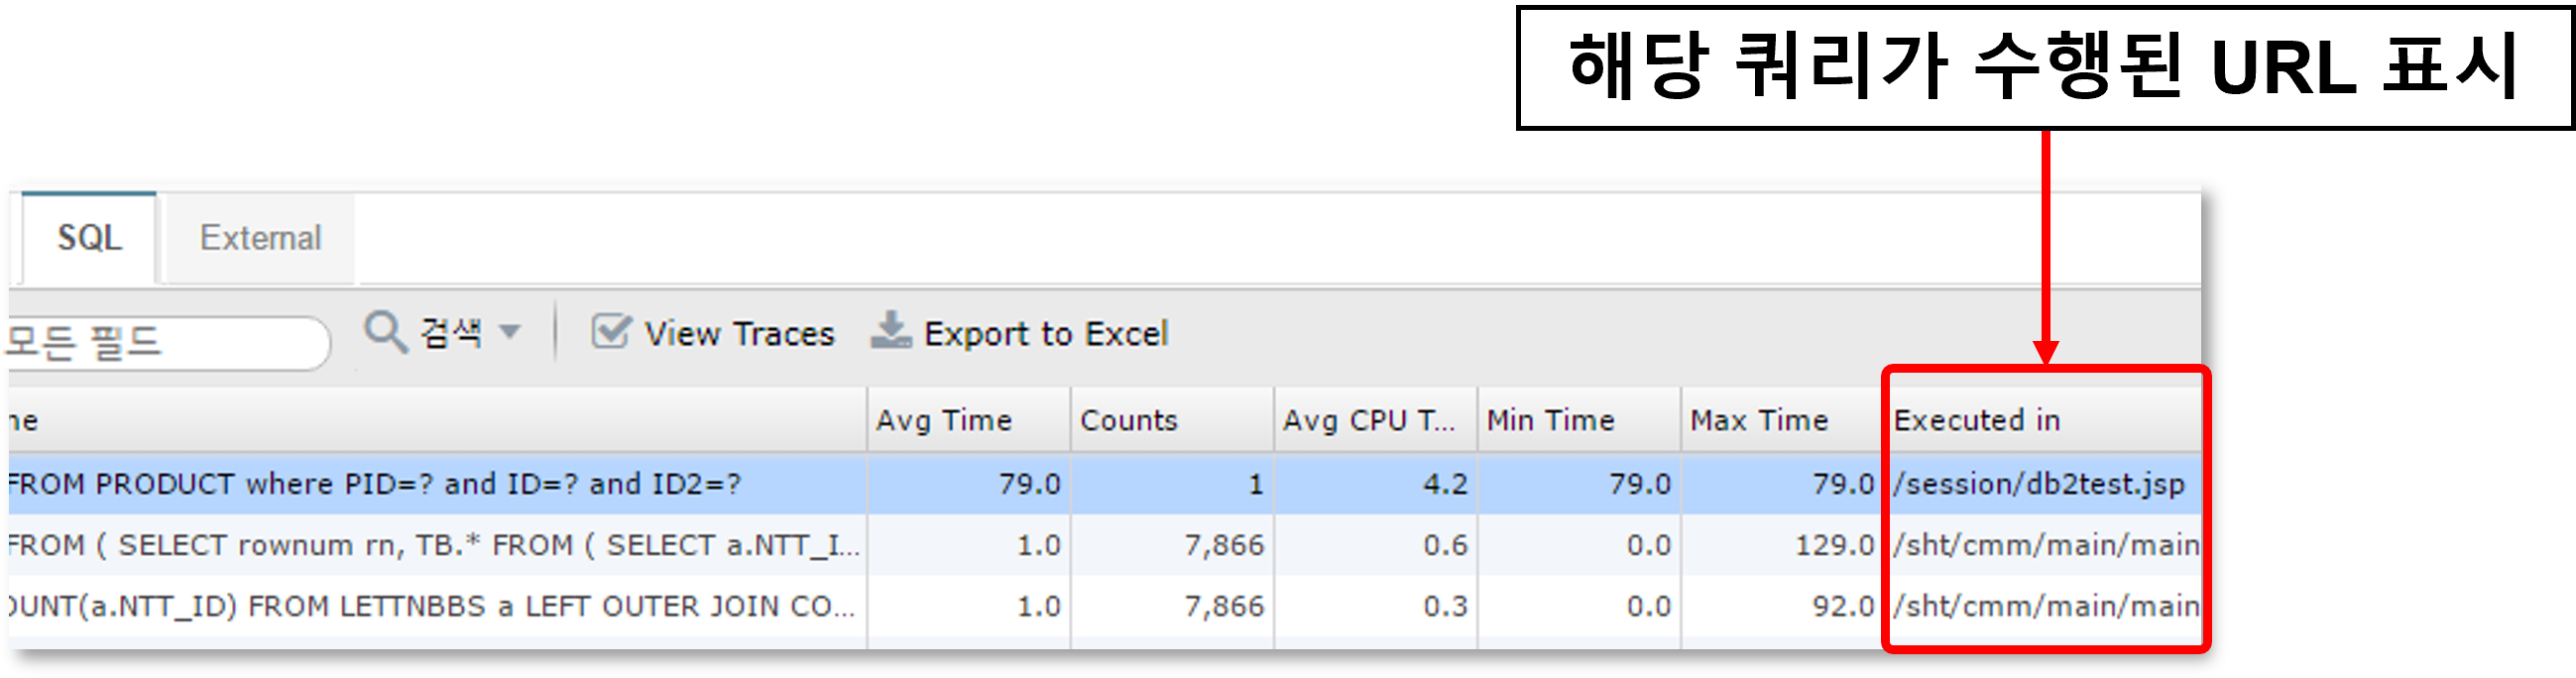
For SQL or HTTP calls, the URL where the query was executed is also displayed.
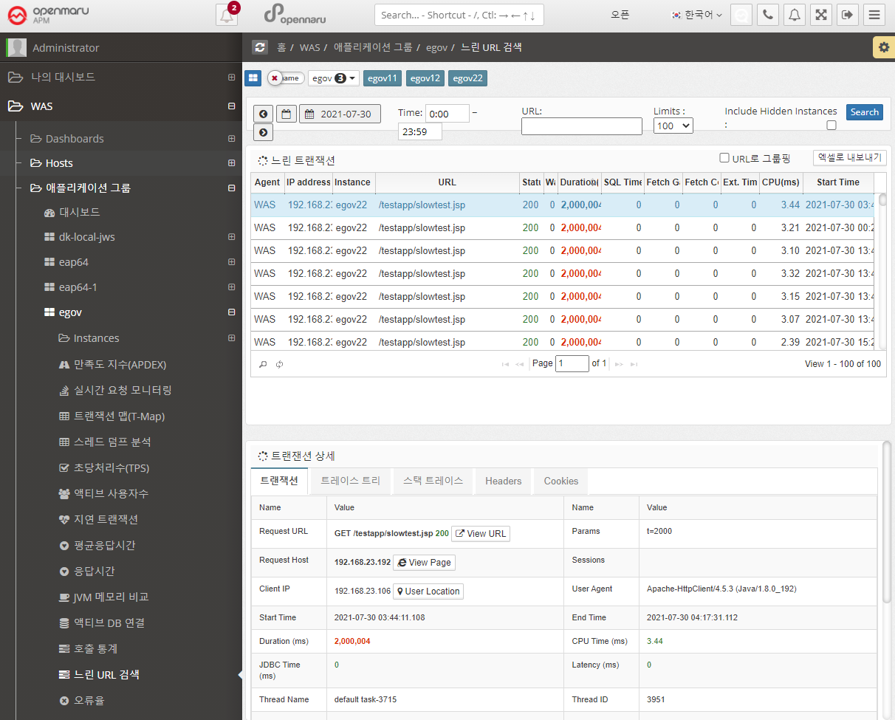
Statistics > Slow URL Retrieval
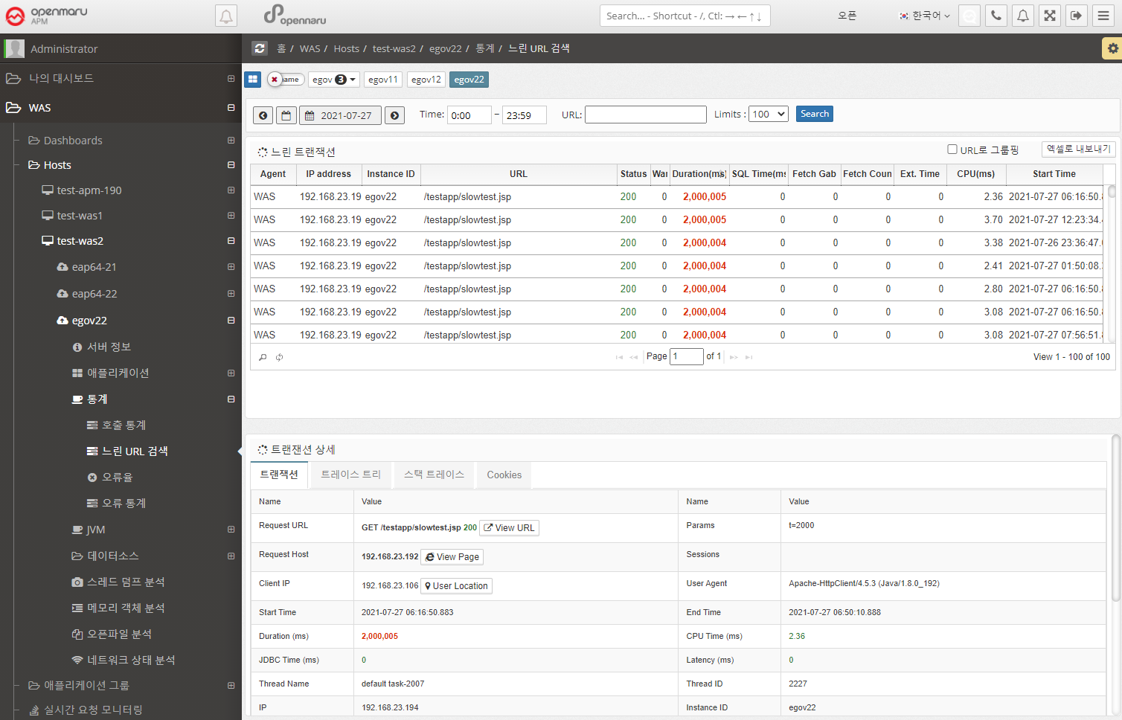
Retrieve a list of the slowest URLs on a per-instance, per-day basis. You can specify the time and number of results using the time slider. Click a URL to display detailed transaction information by method.
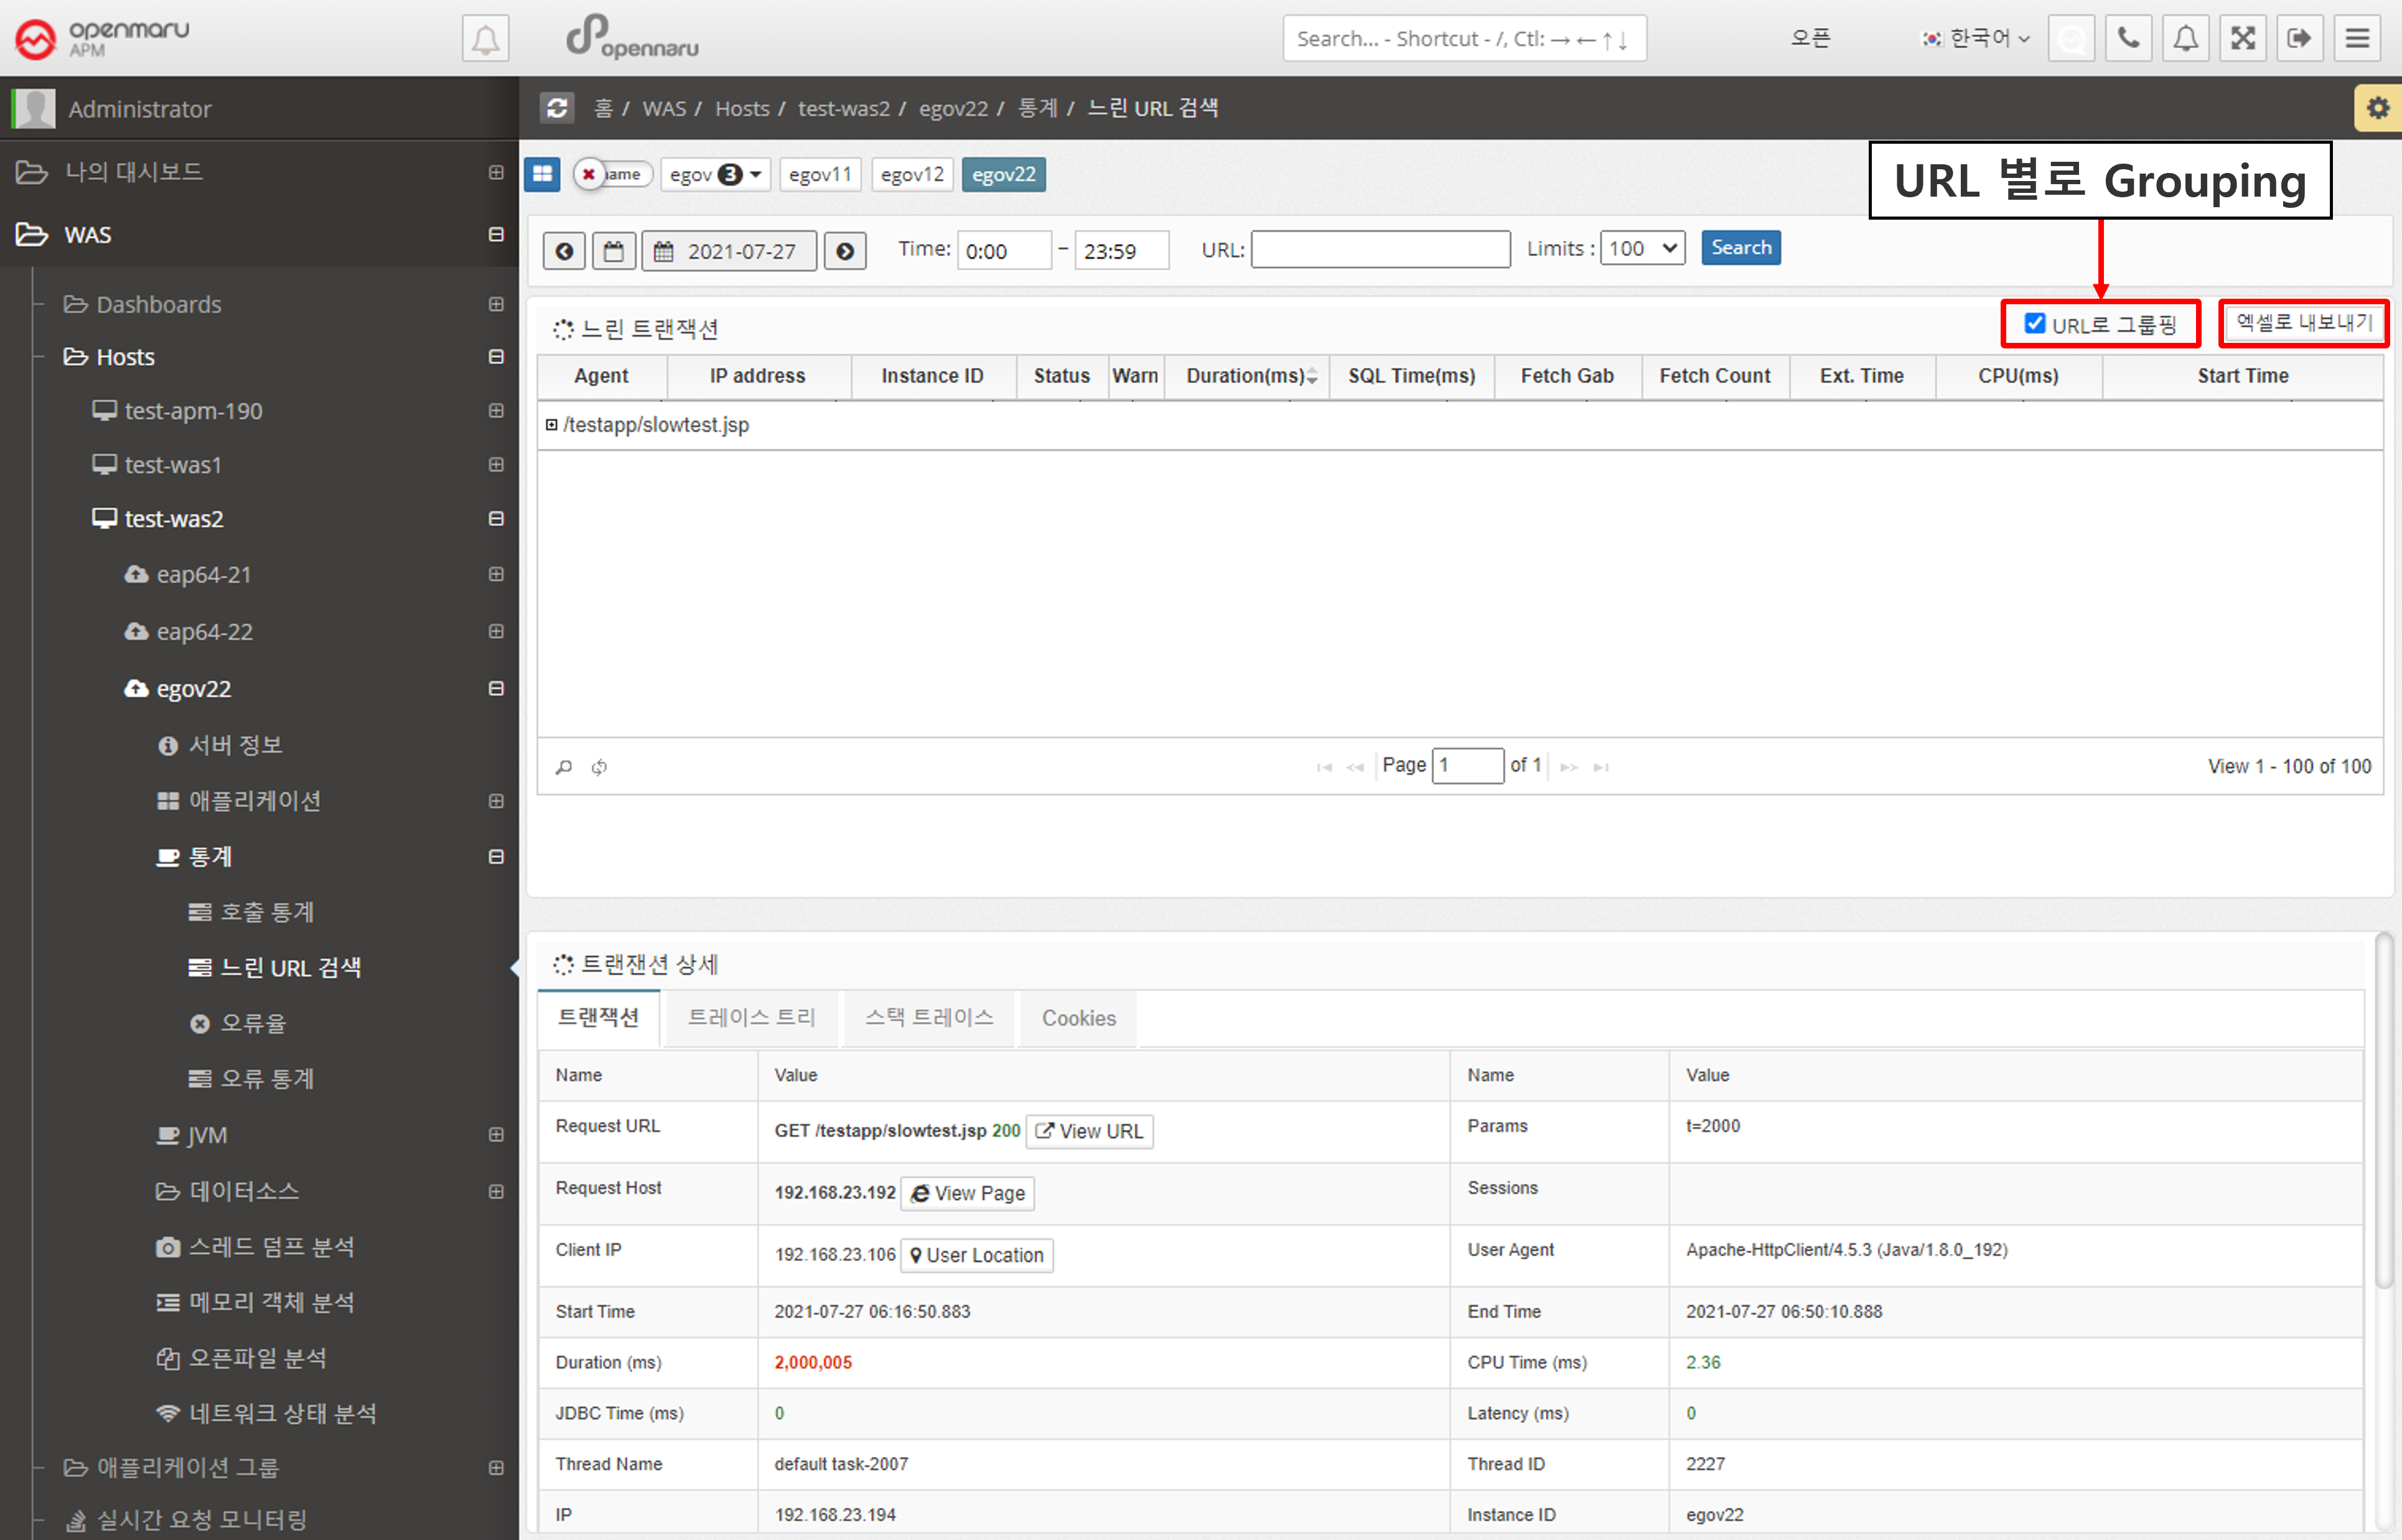
If you check the 'Group by URL' checkbox, the searched URLs will be displayed grouped by URL.
You can also download the search results as an Excel file.
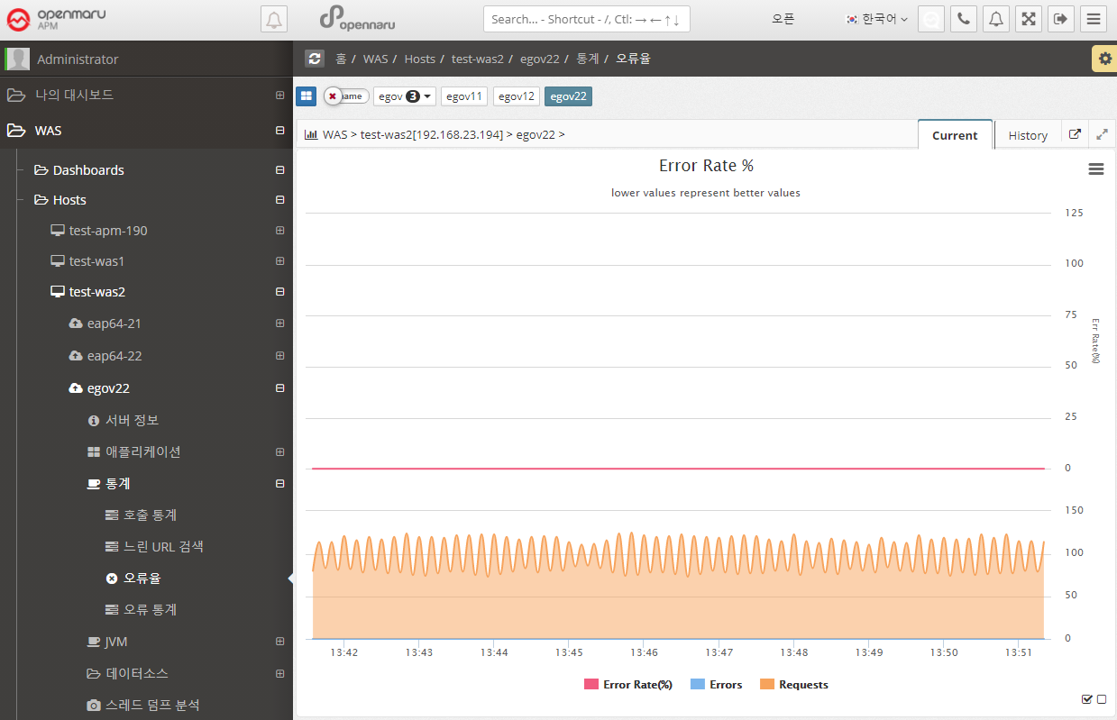
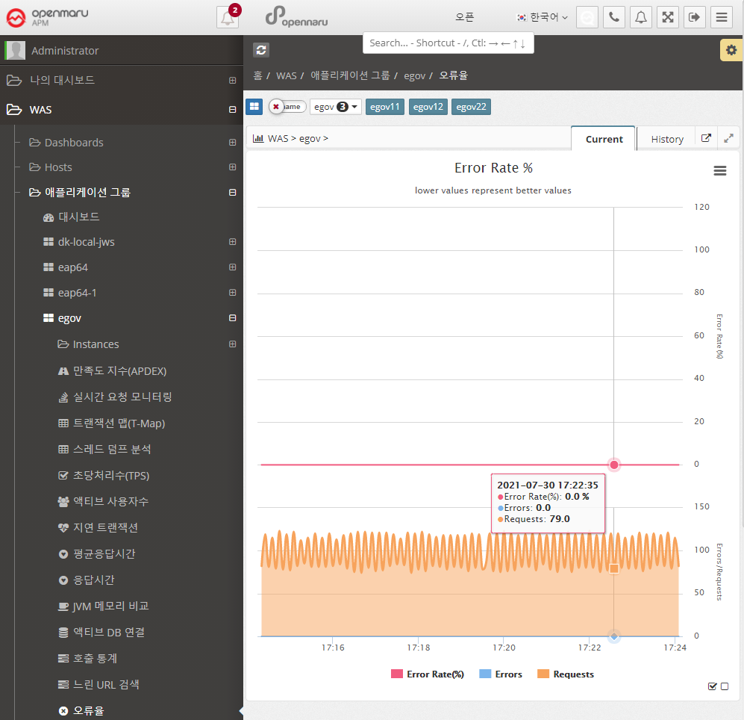
Statistics > Error Rate
Calculate the number of HTTP Status code 40x and 50x error codes returned by each application as a percentage (%) of the total number of URL requests and display the error rate in a graph.
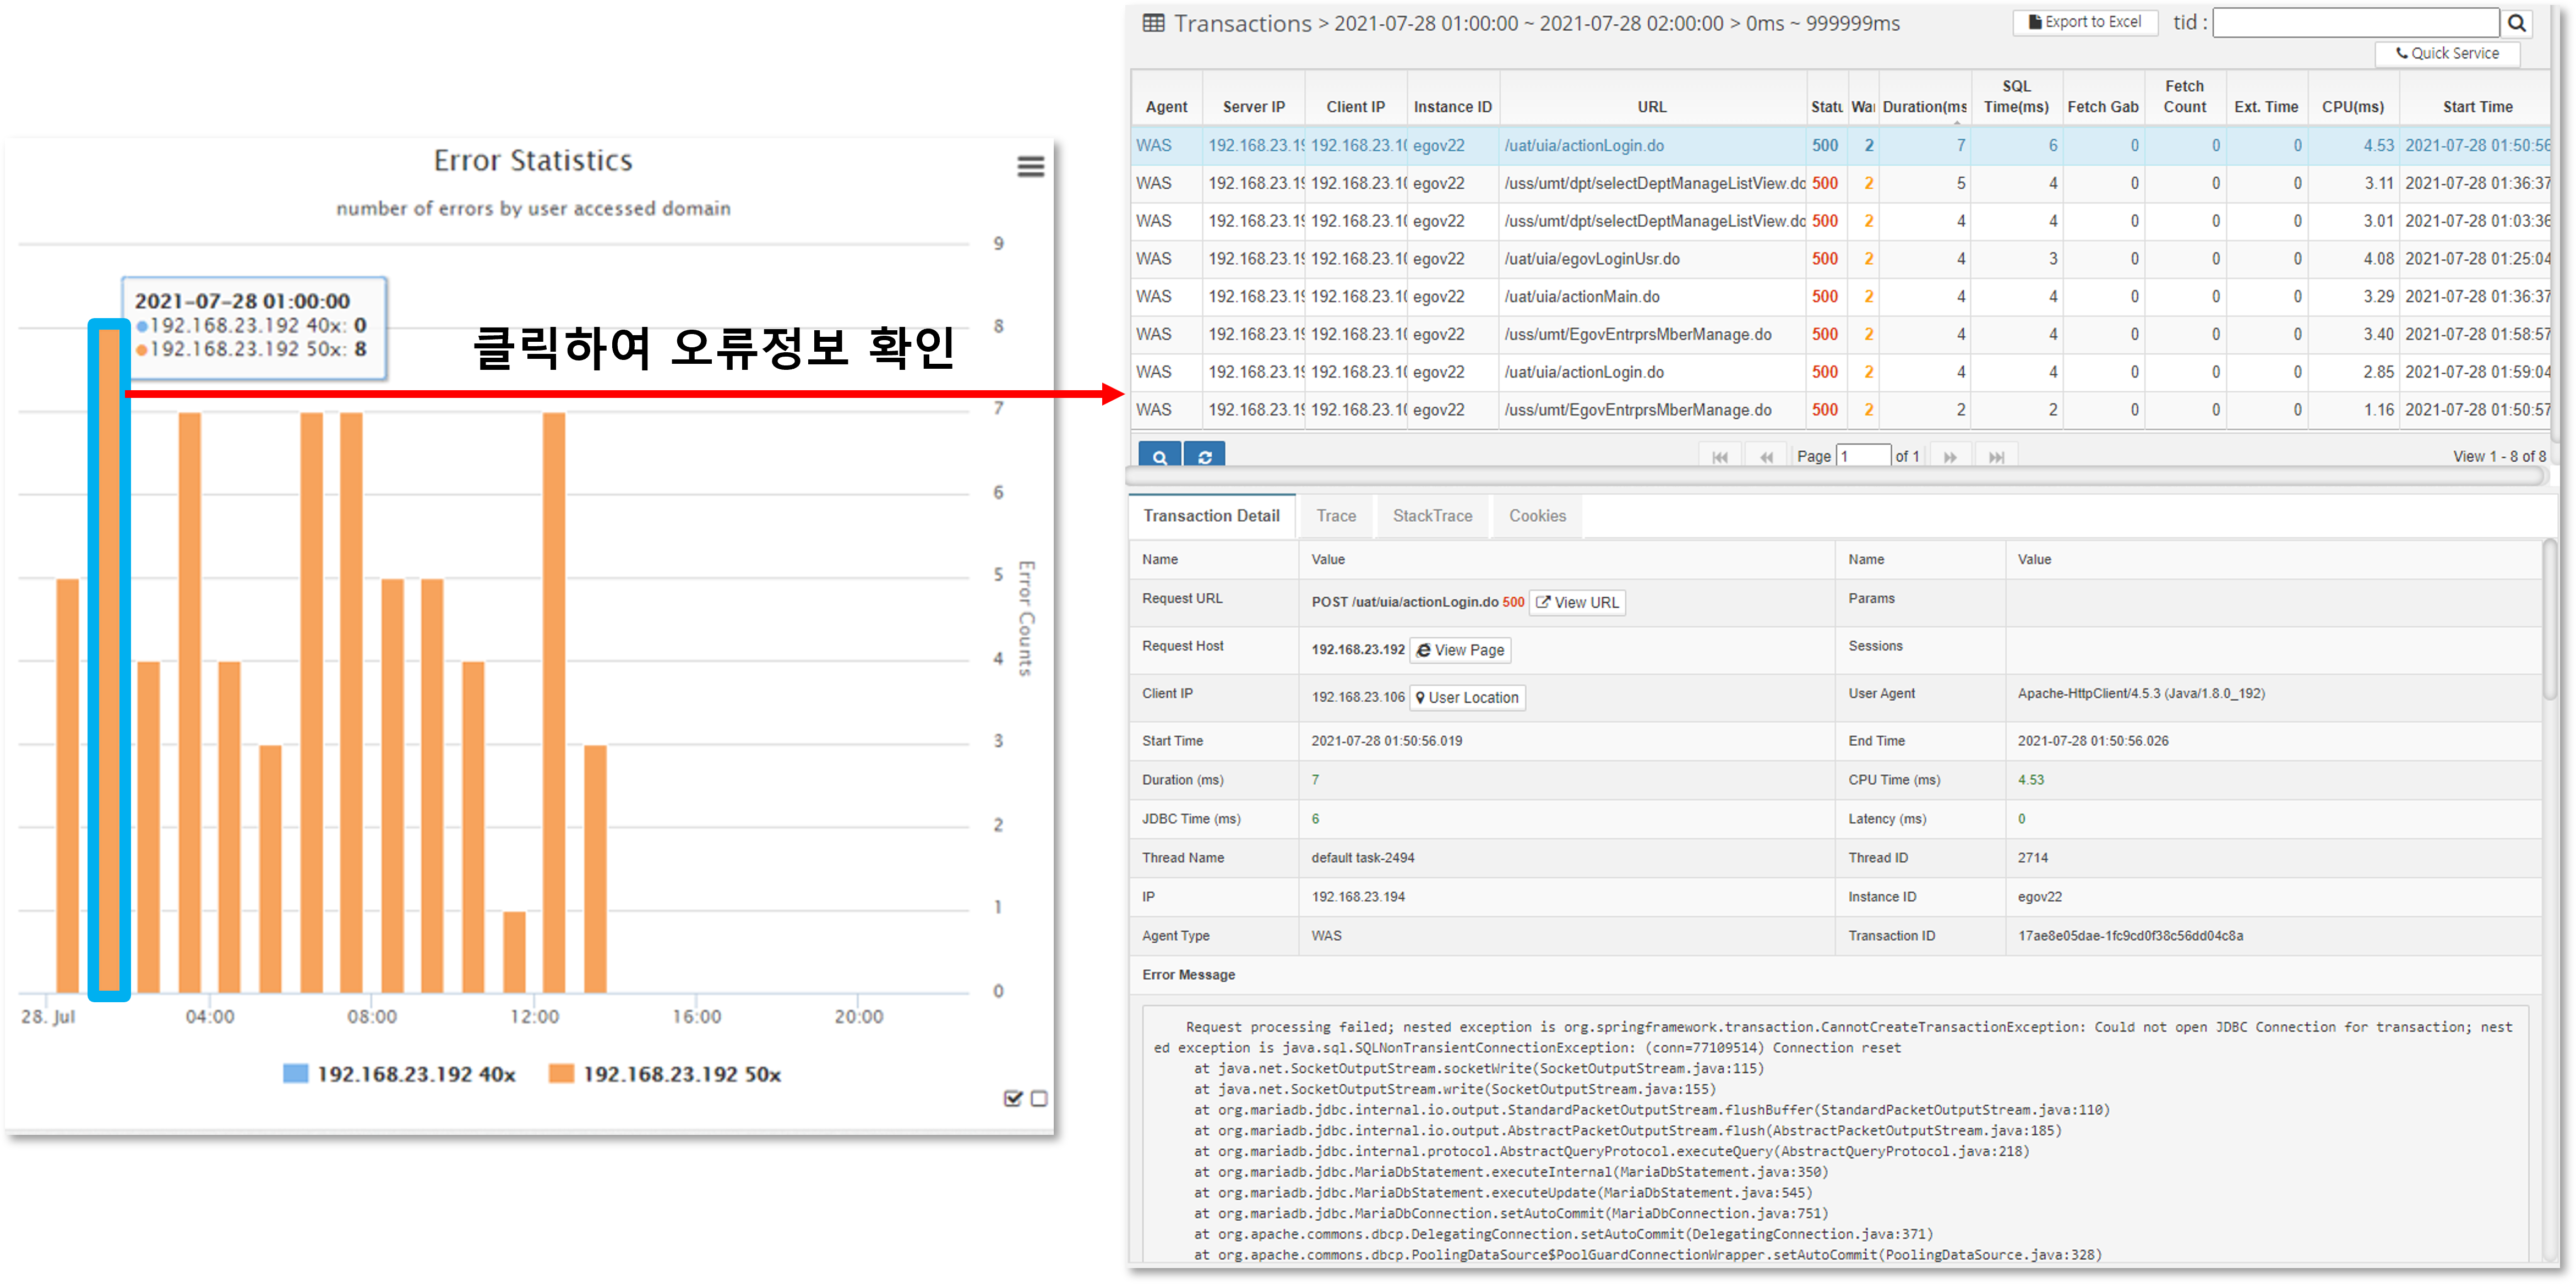
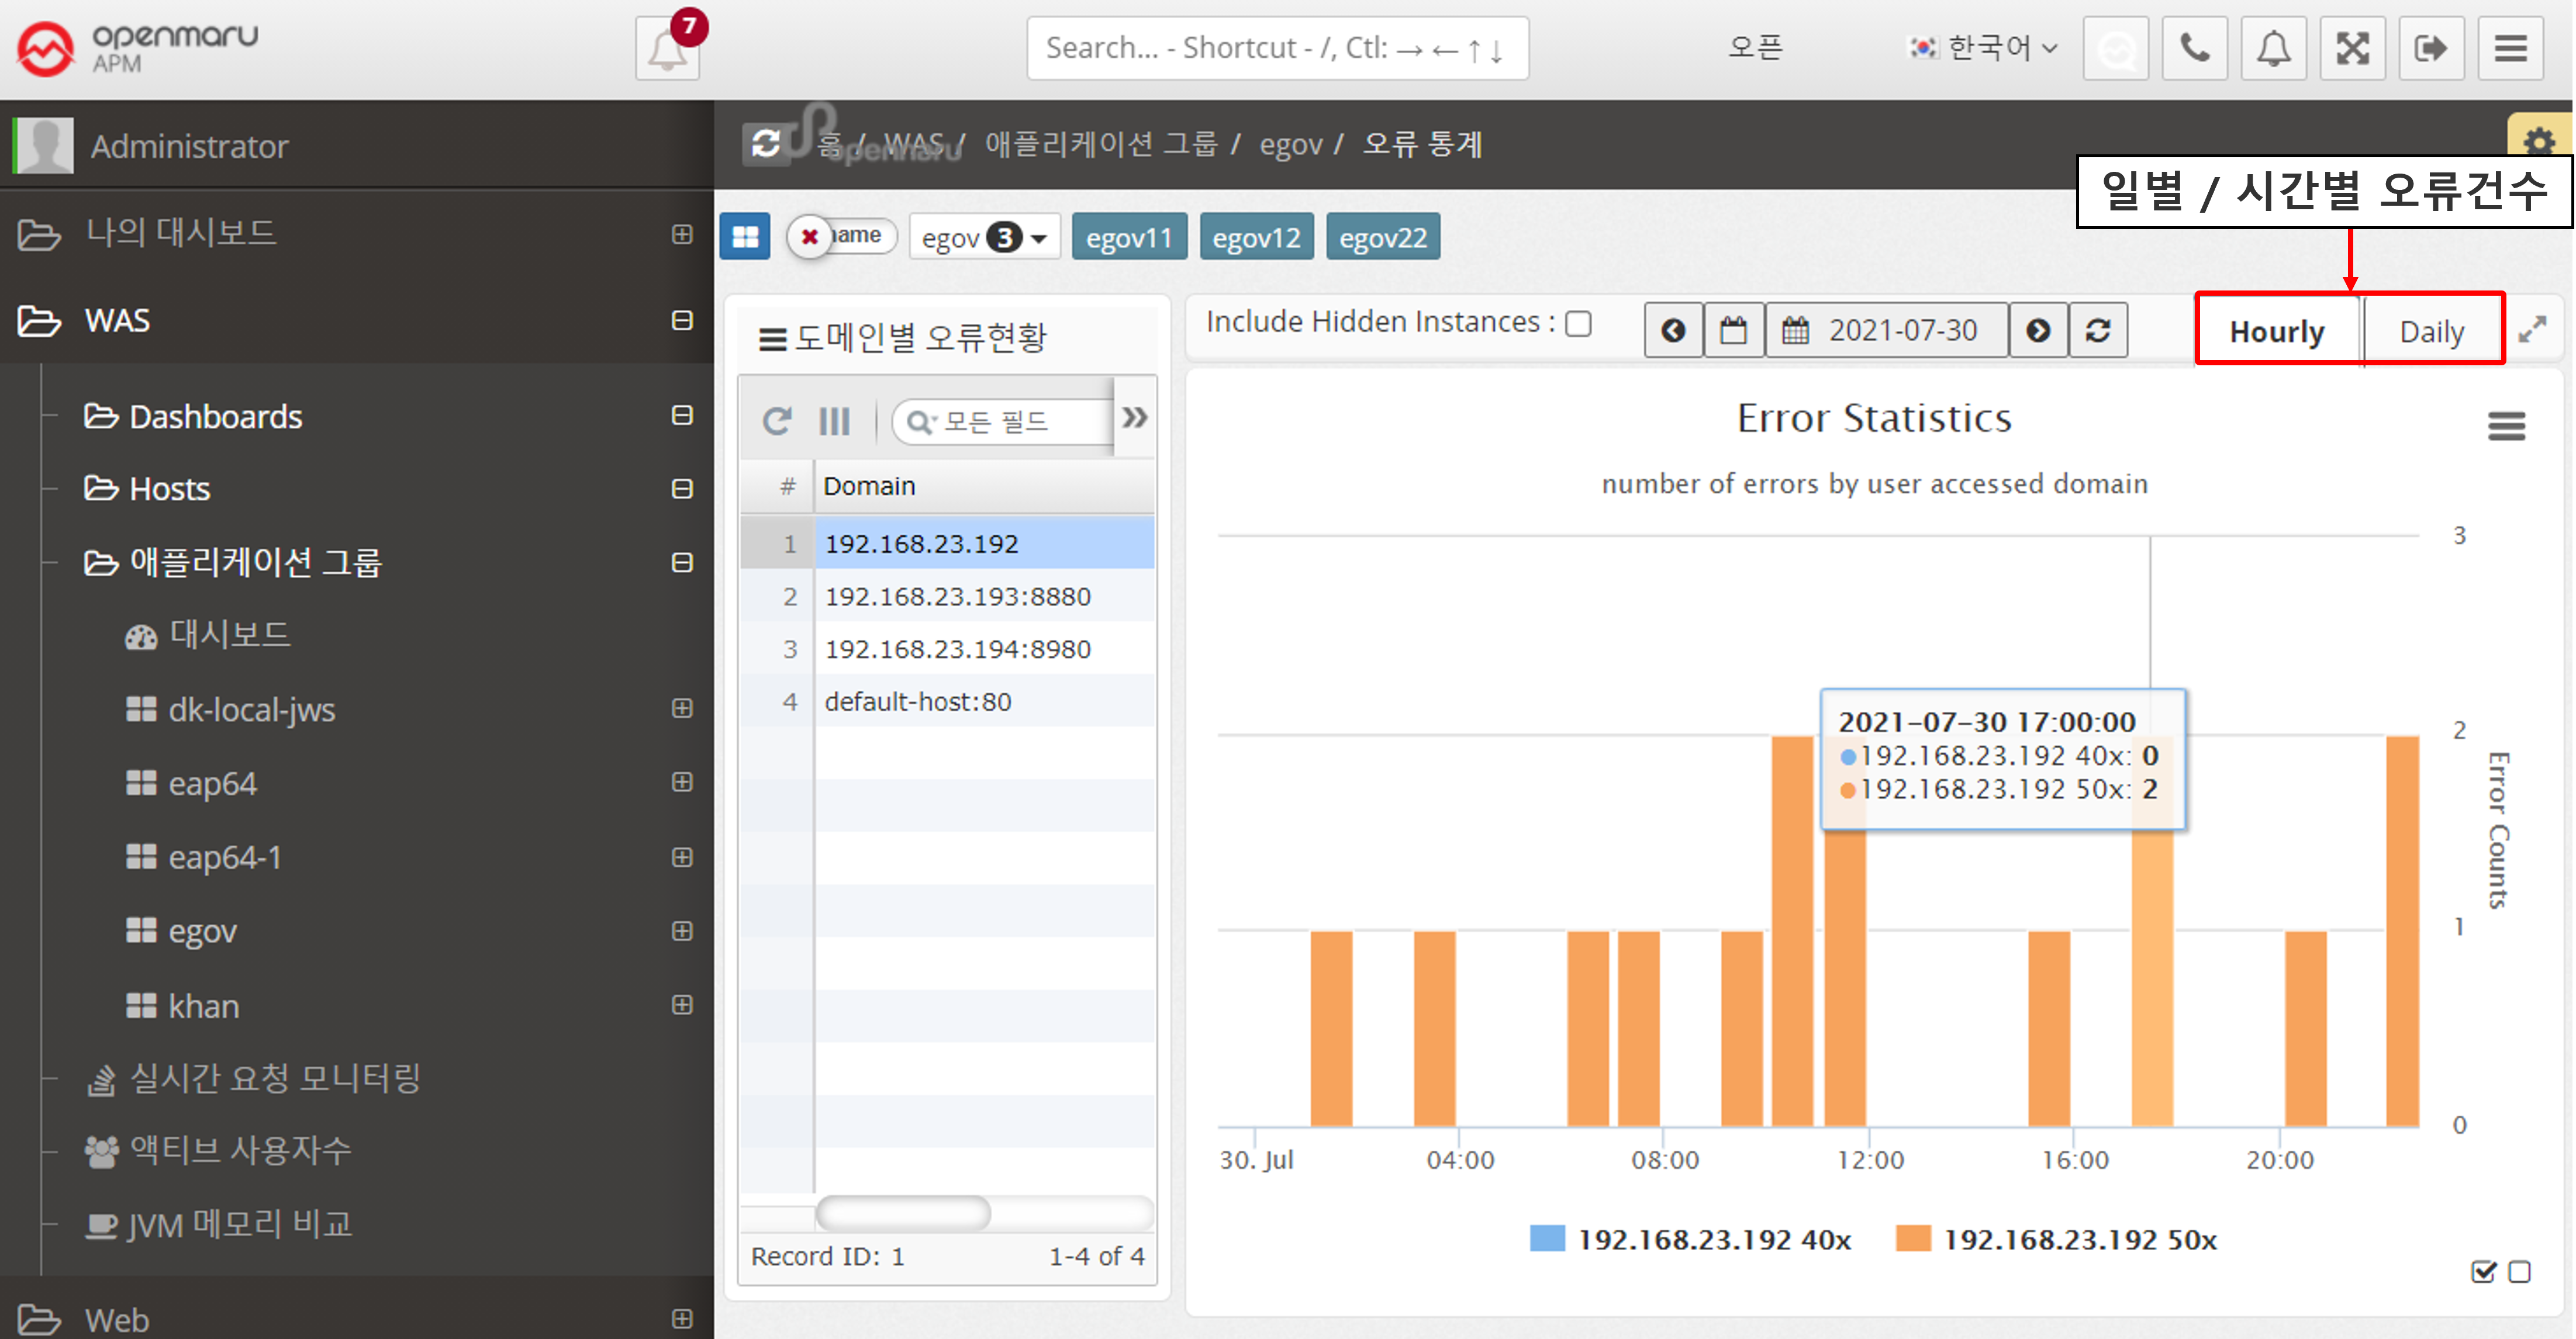
Statistics > Error Statistics
Displays hourly and daily graphs of errors that occurred in the instance. The information is categorized by the domain name that the user accessed by typing in the browser, separating 400 errors from 500 errors.
For example, if your WAS instance serves more than one domain name, you can see which domain name users are accessing and using to get errors.
Select a date to view hourly error statistics for that day.
If you select the 'Daily' tab, you can see error statistics for each day of the month.
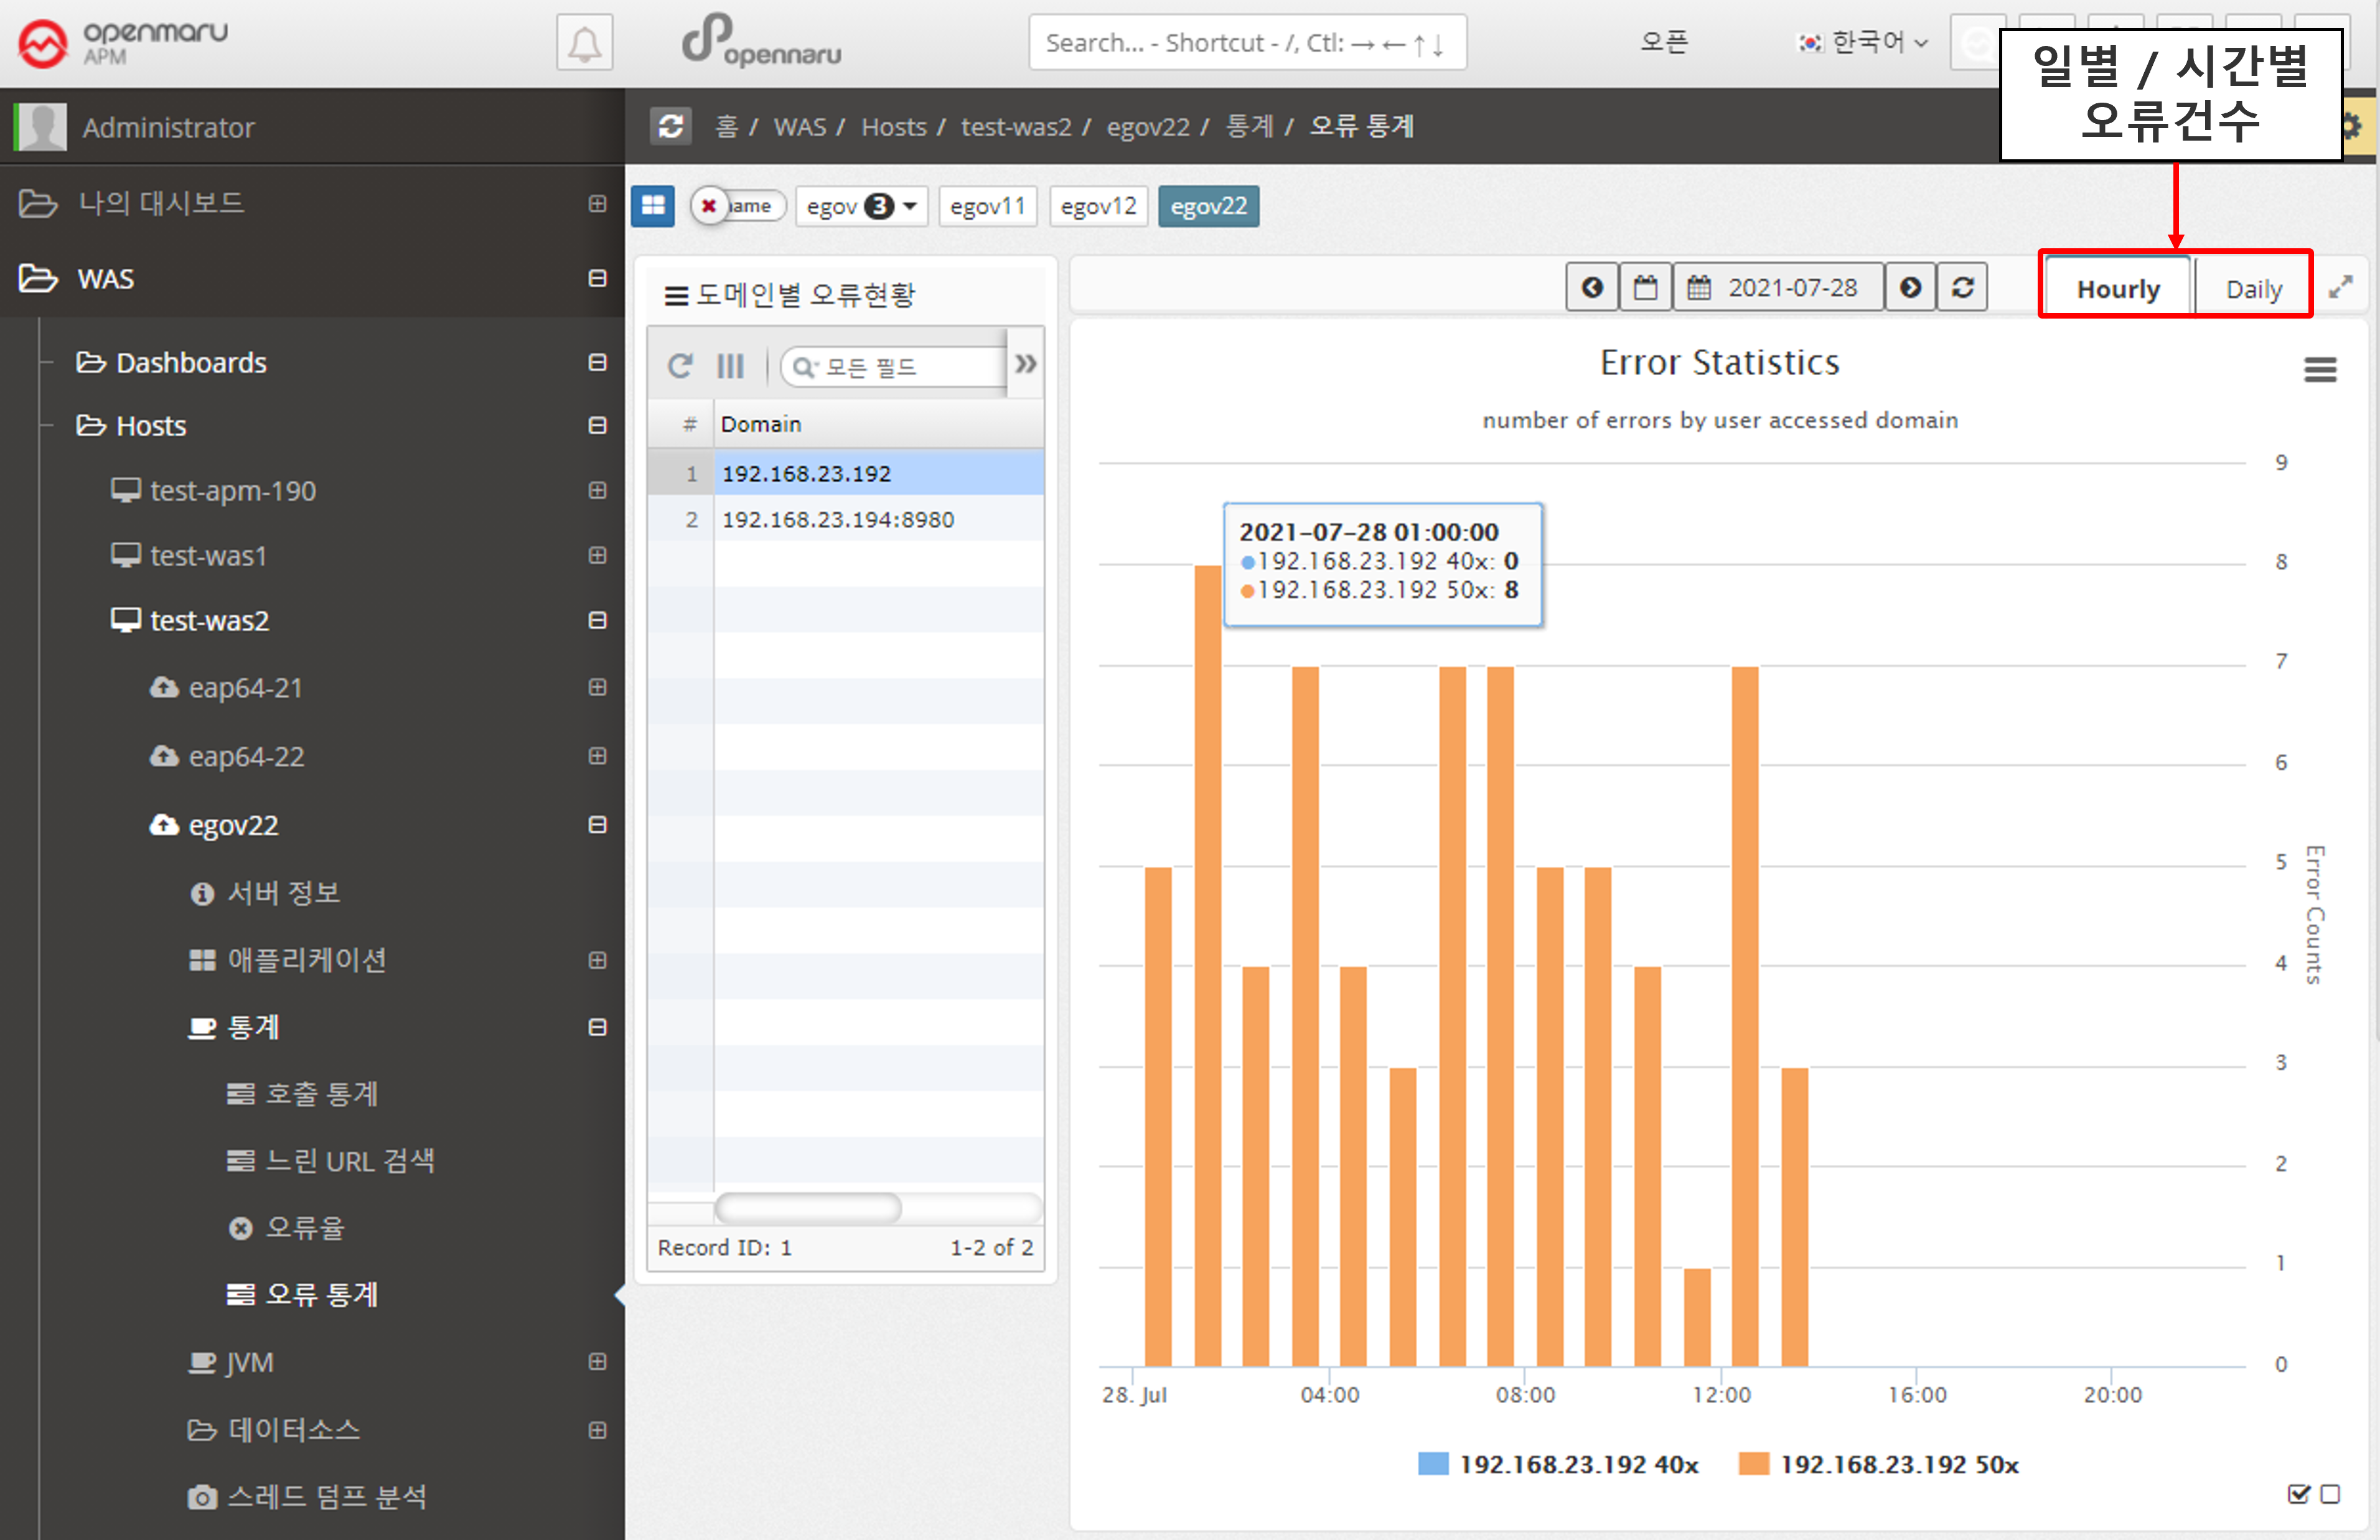
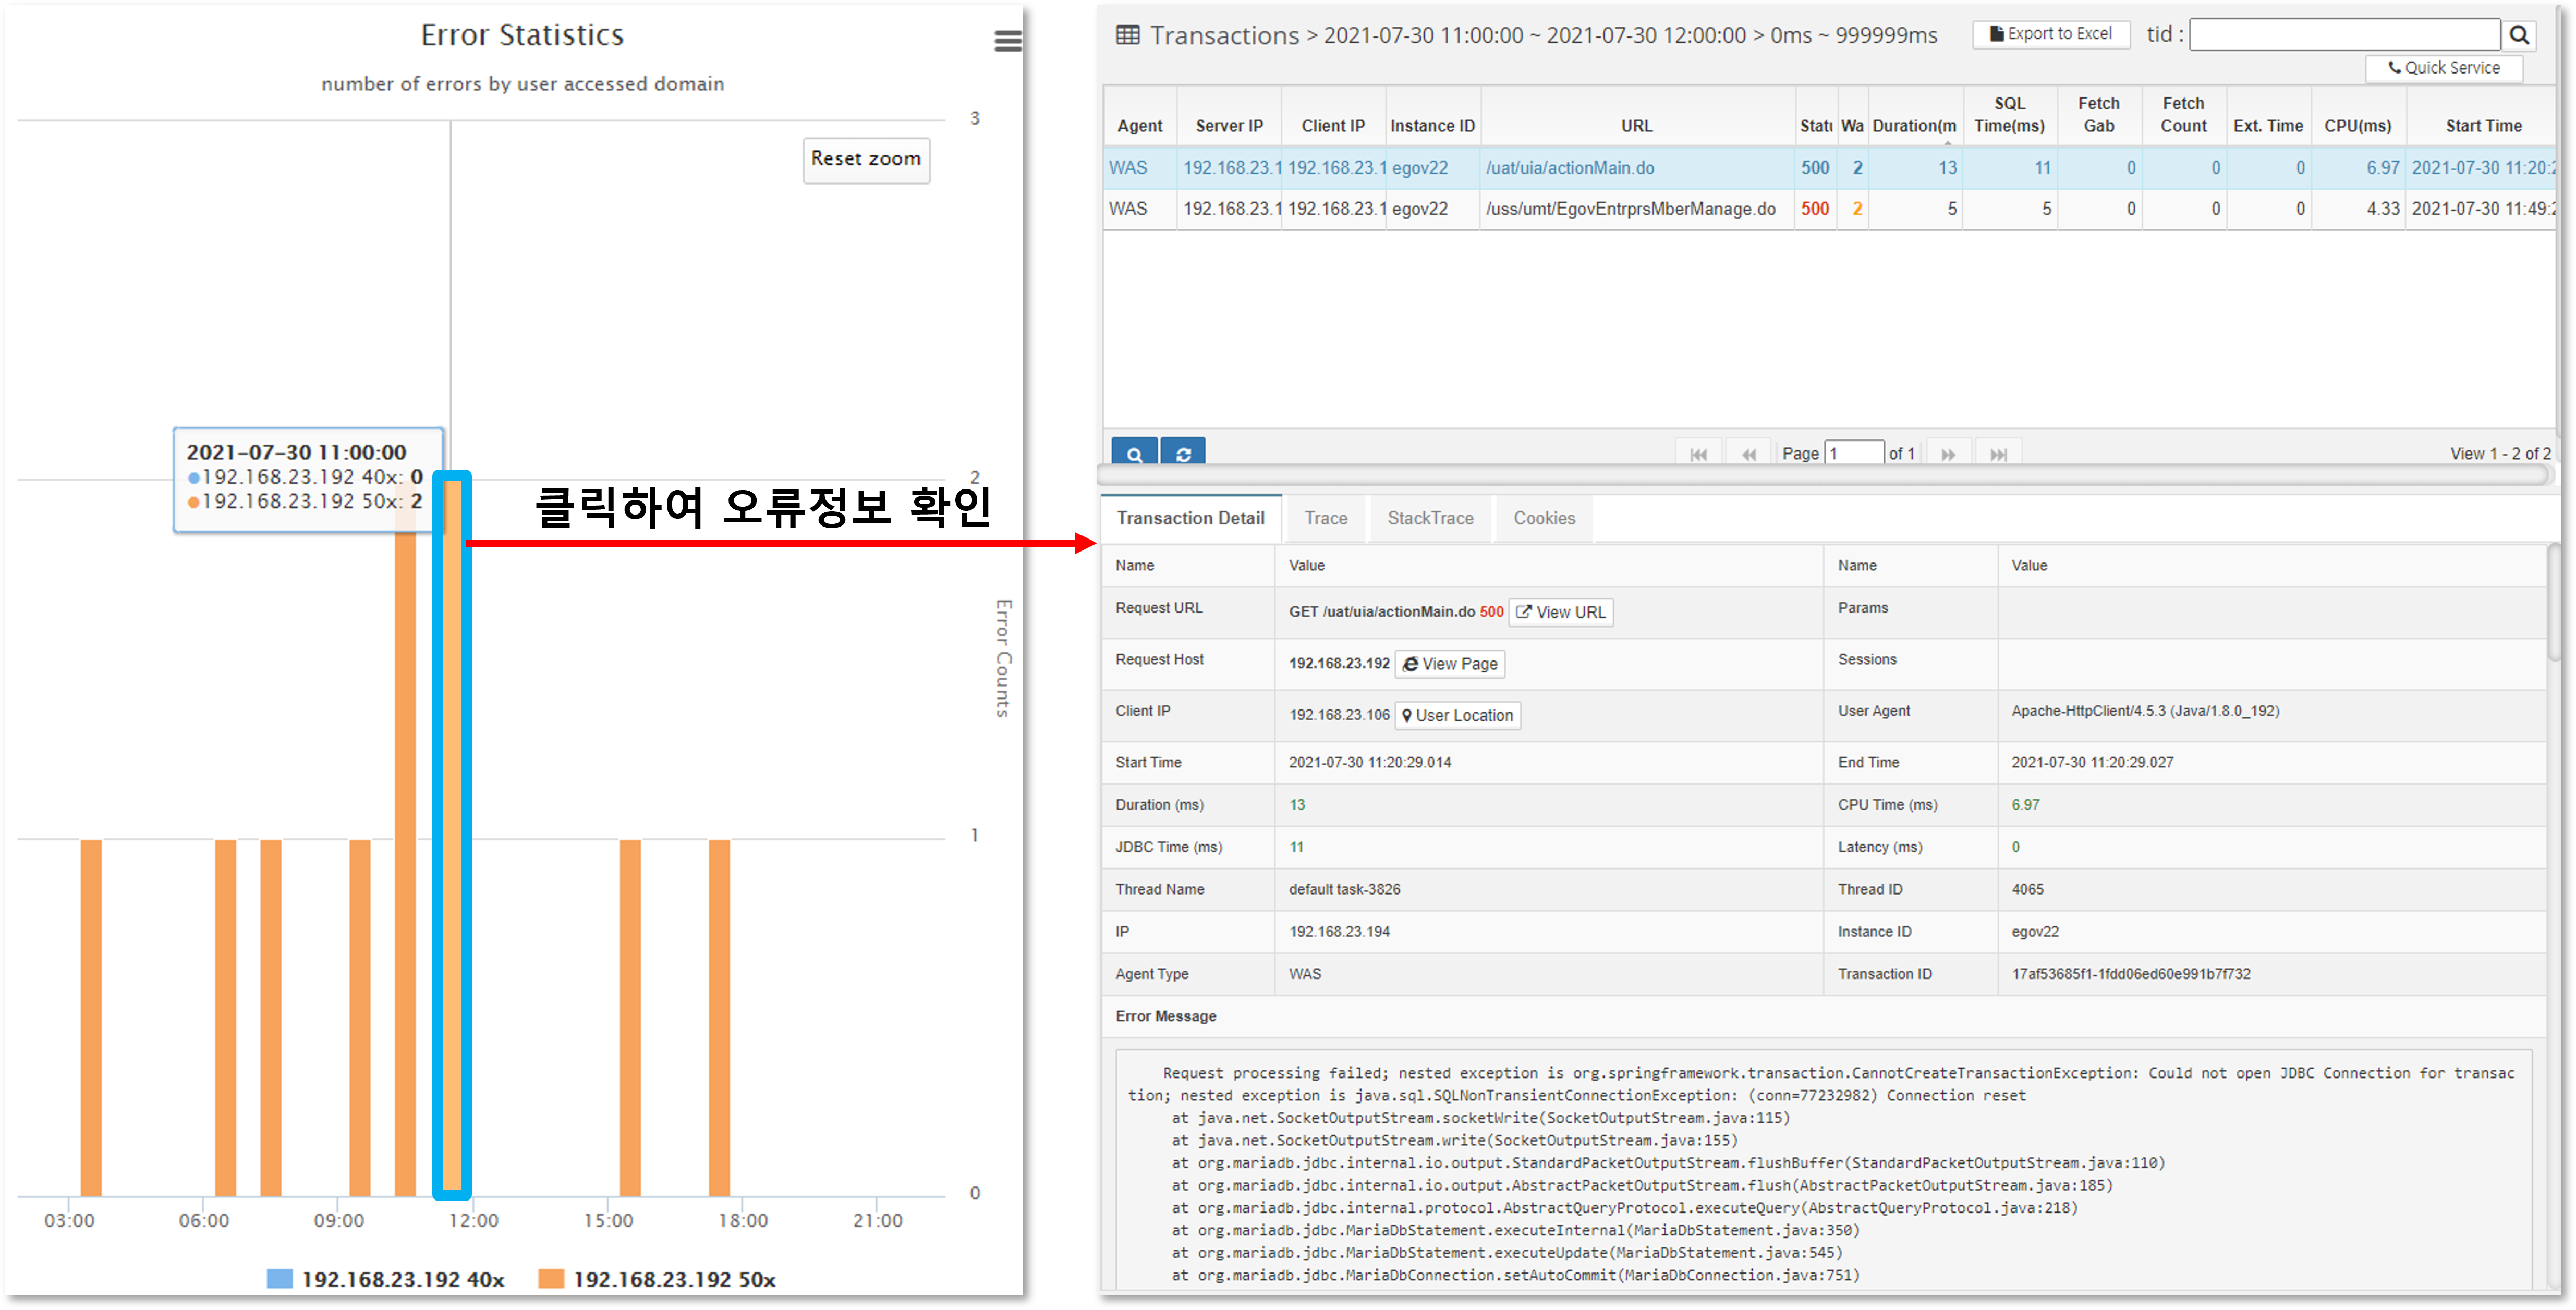
If you want to see the details of the specific error that occurred, you can click on the corresponding bar to see the detailed transaction information for the error.
2.2.4 JVM by WAS Instance
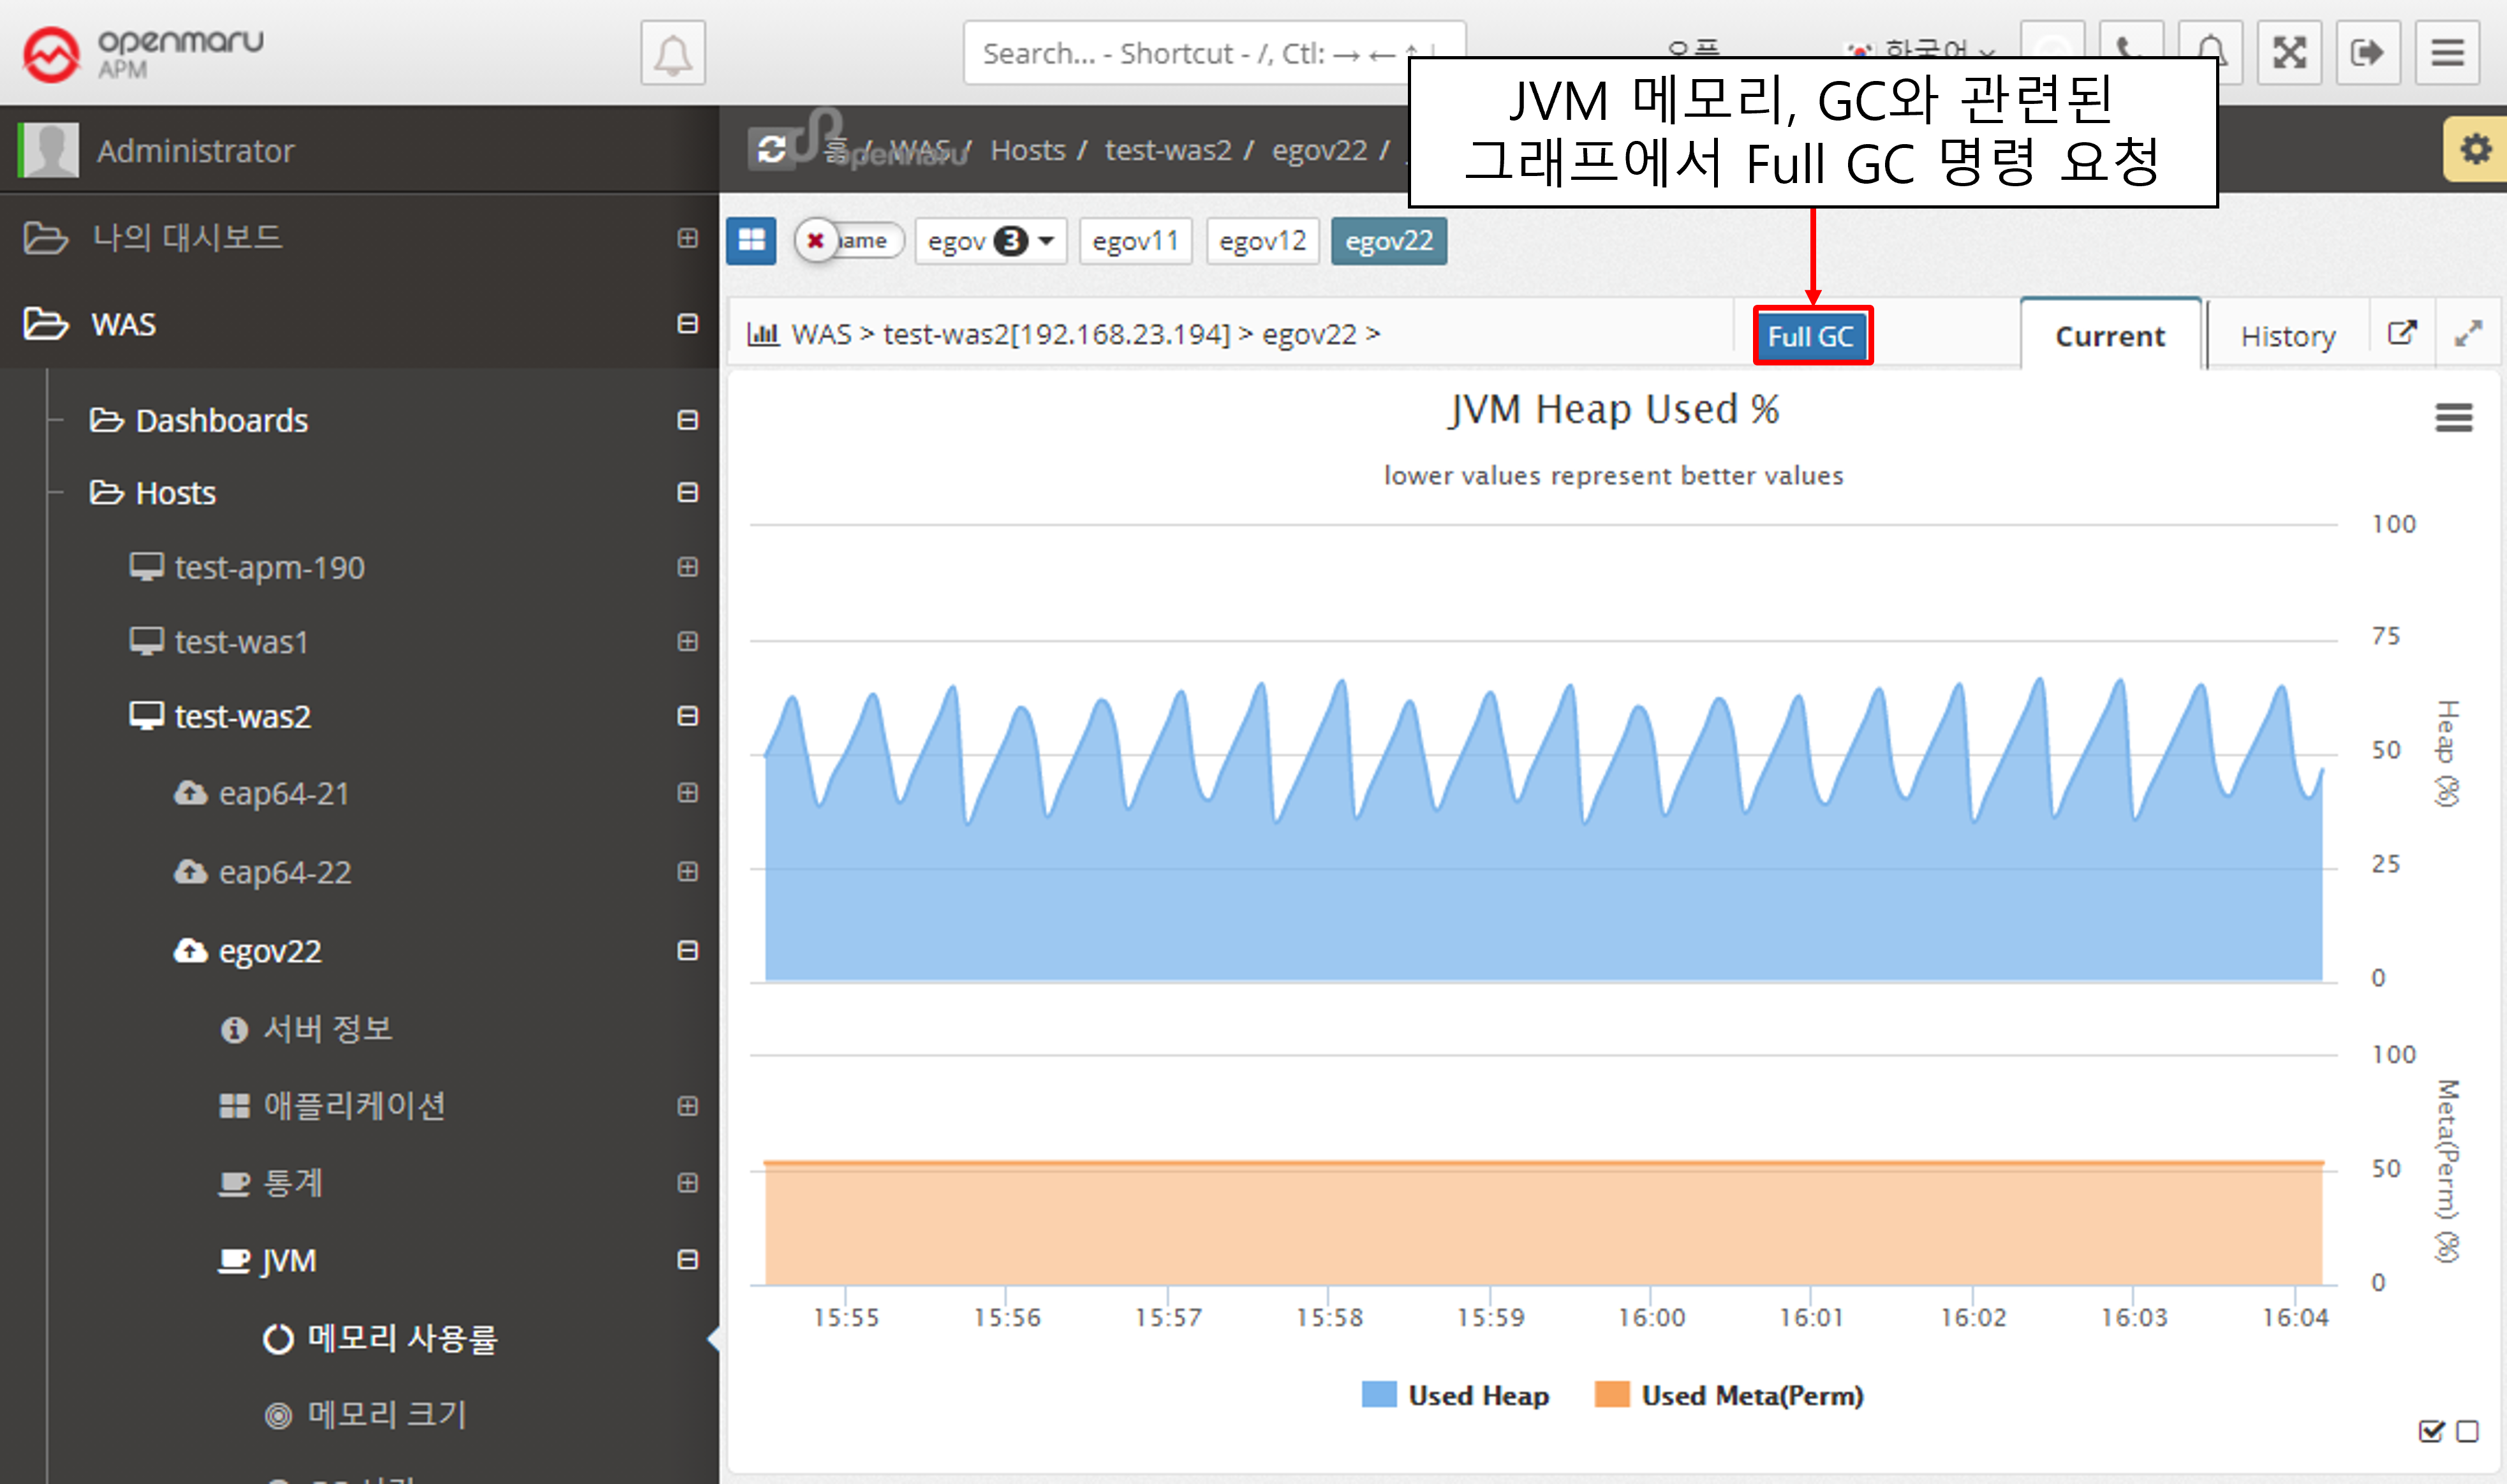
JVM > Memory Utilization
Displays the WAS instance memory utilization (%). The top graph shows the Heap utilization of the JVM, and the bottom graph shows the utilization of the Perm area.
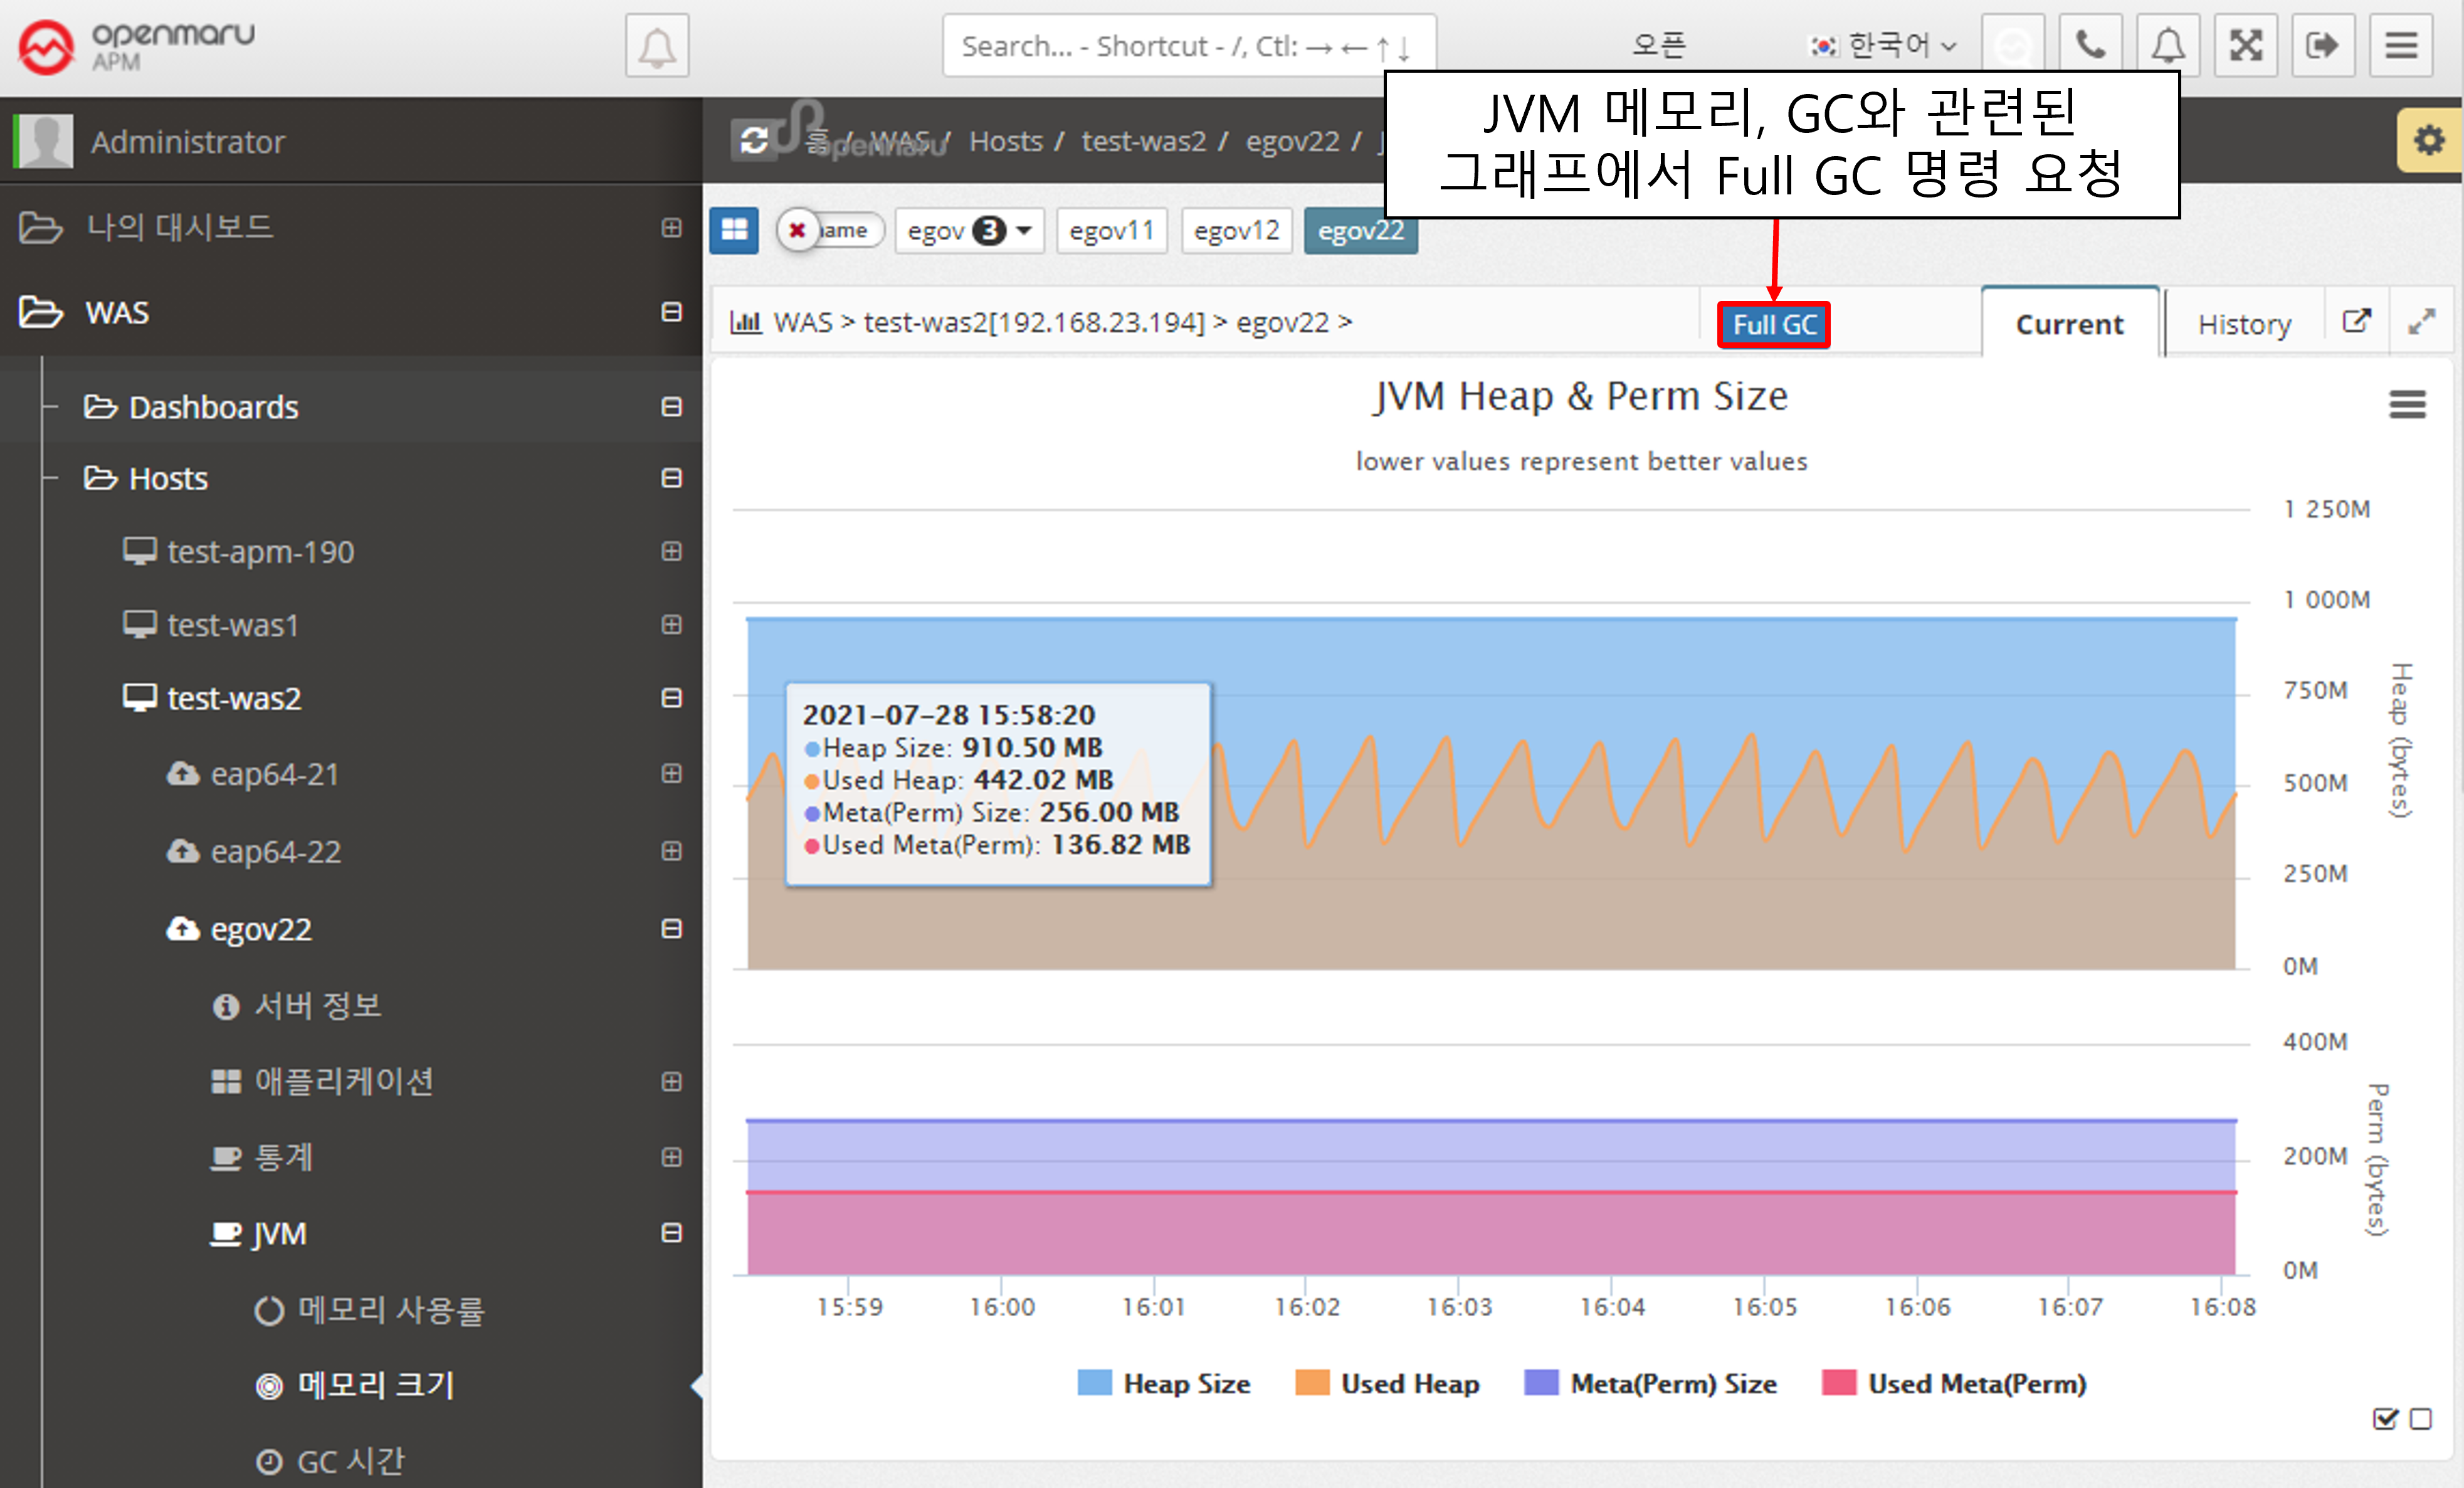
JVM > Memory Size
Displays the memory size of the WAS instance JVM. It shows the maximum value and the current usage in bytes. Heap usage is shown at the top and Perm usage at the bottom.
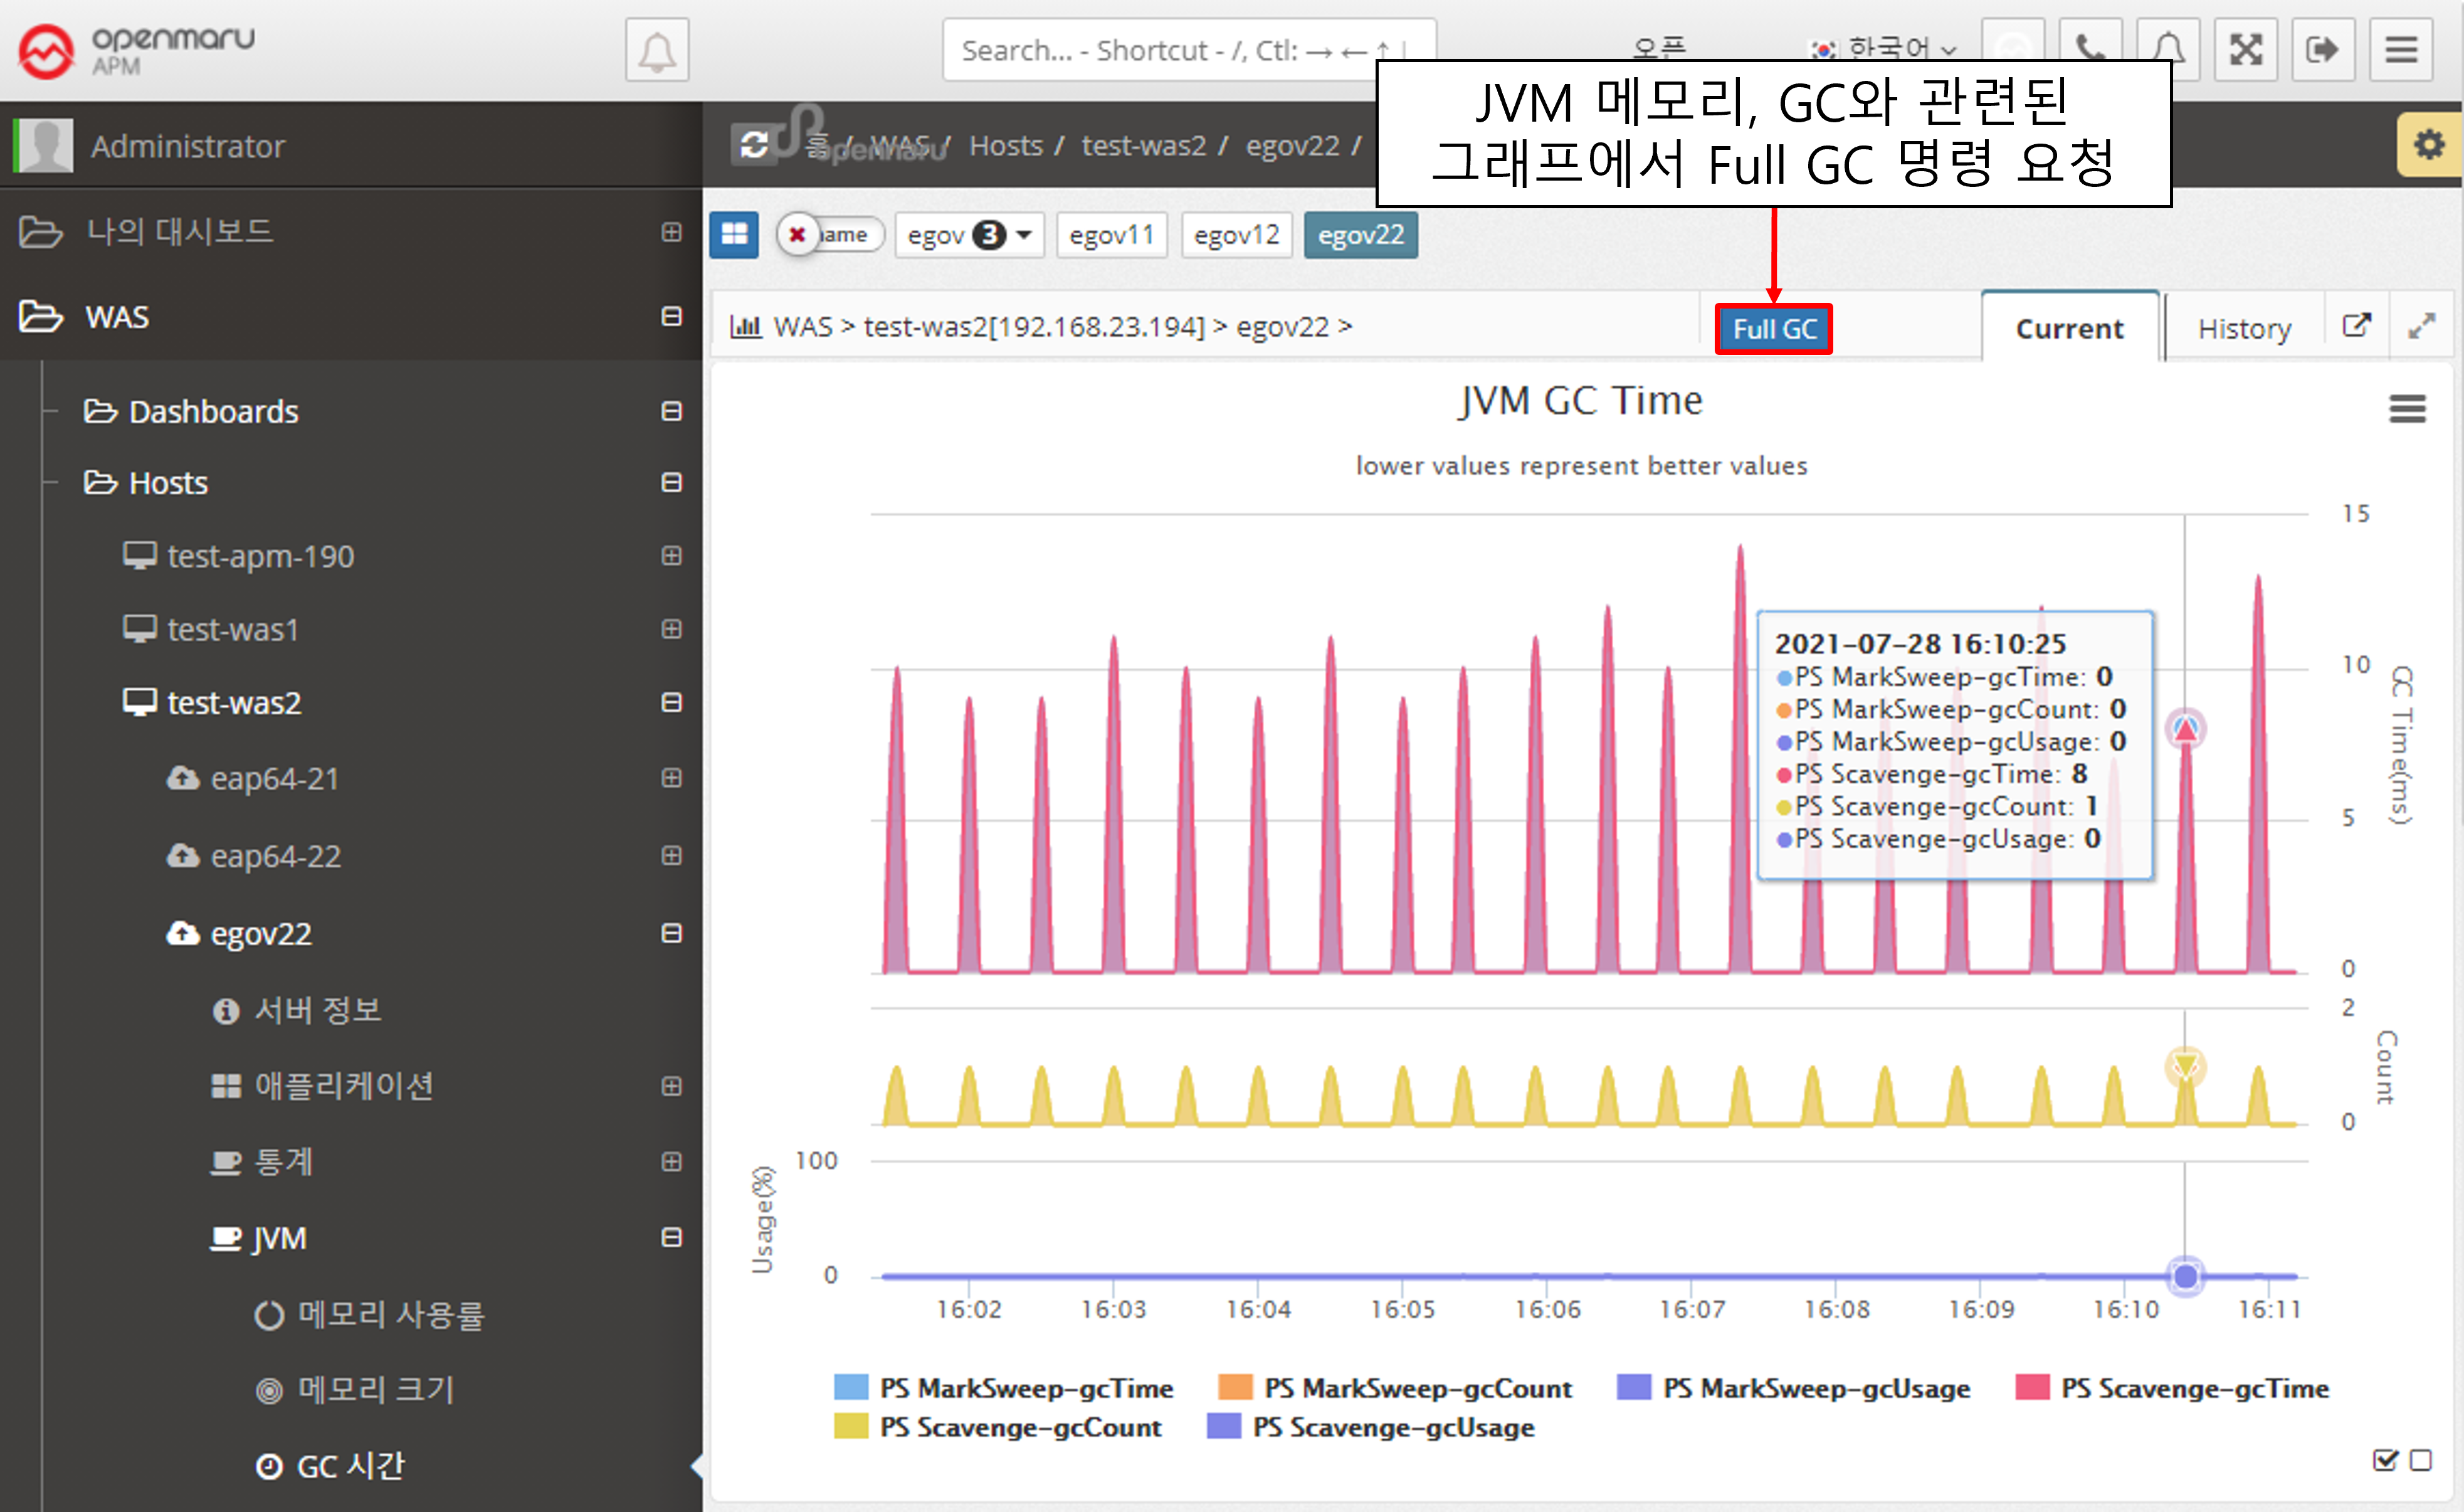
JVM > GC Time
Displays the GC status of the WAS instance JVM. The top line shows the time spent on GC, and the bottom line shows the number of GCs. Minor GC and Full GC are displayed separately.
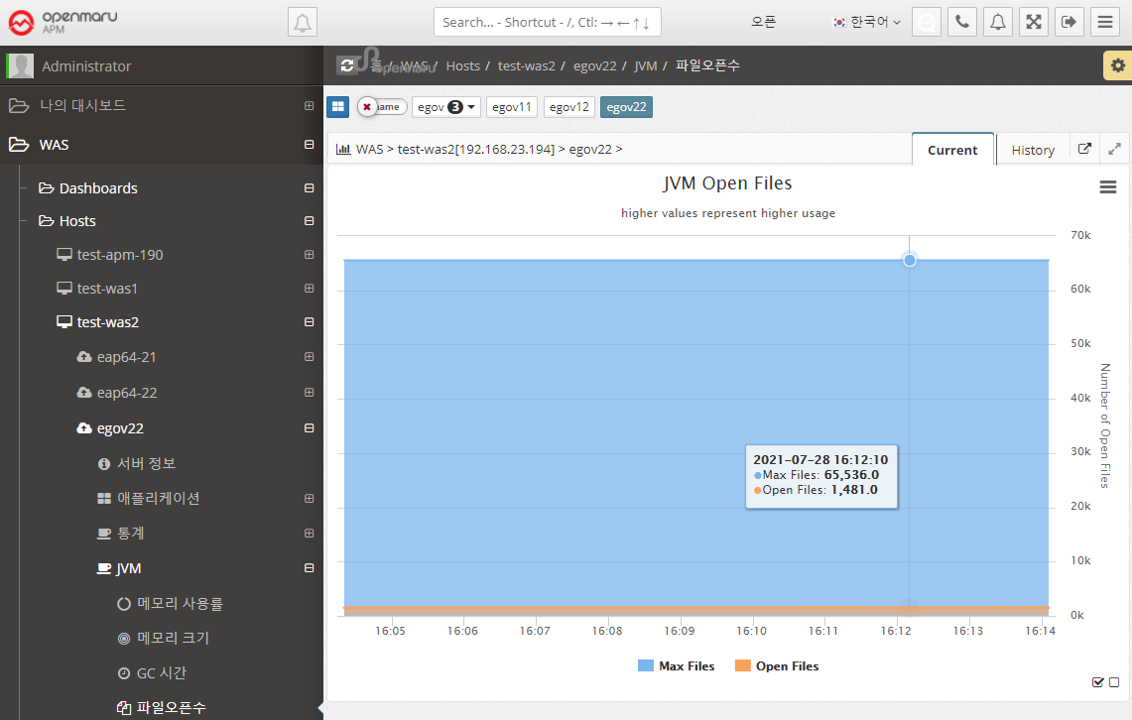
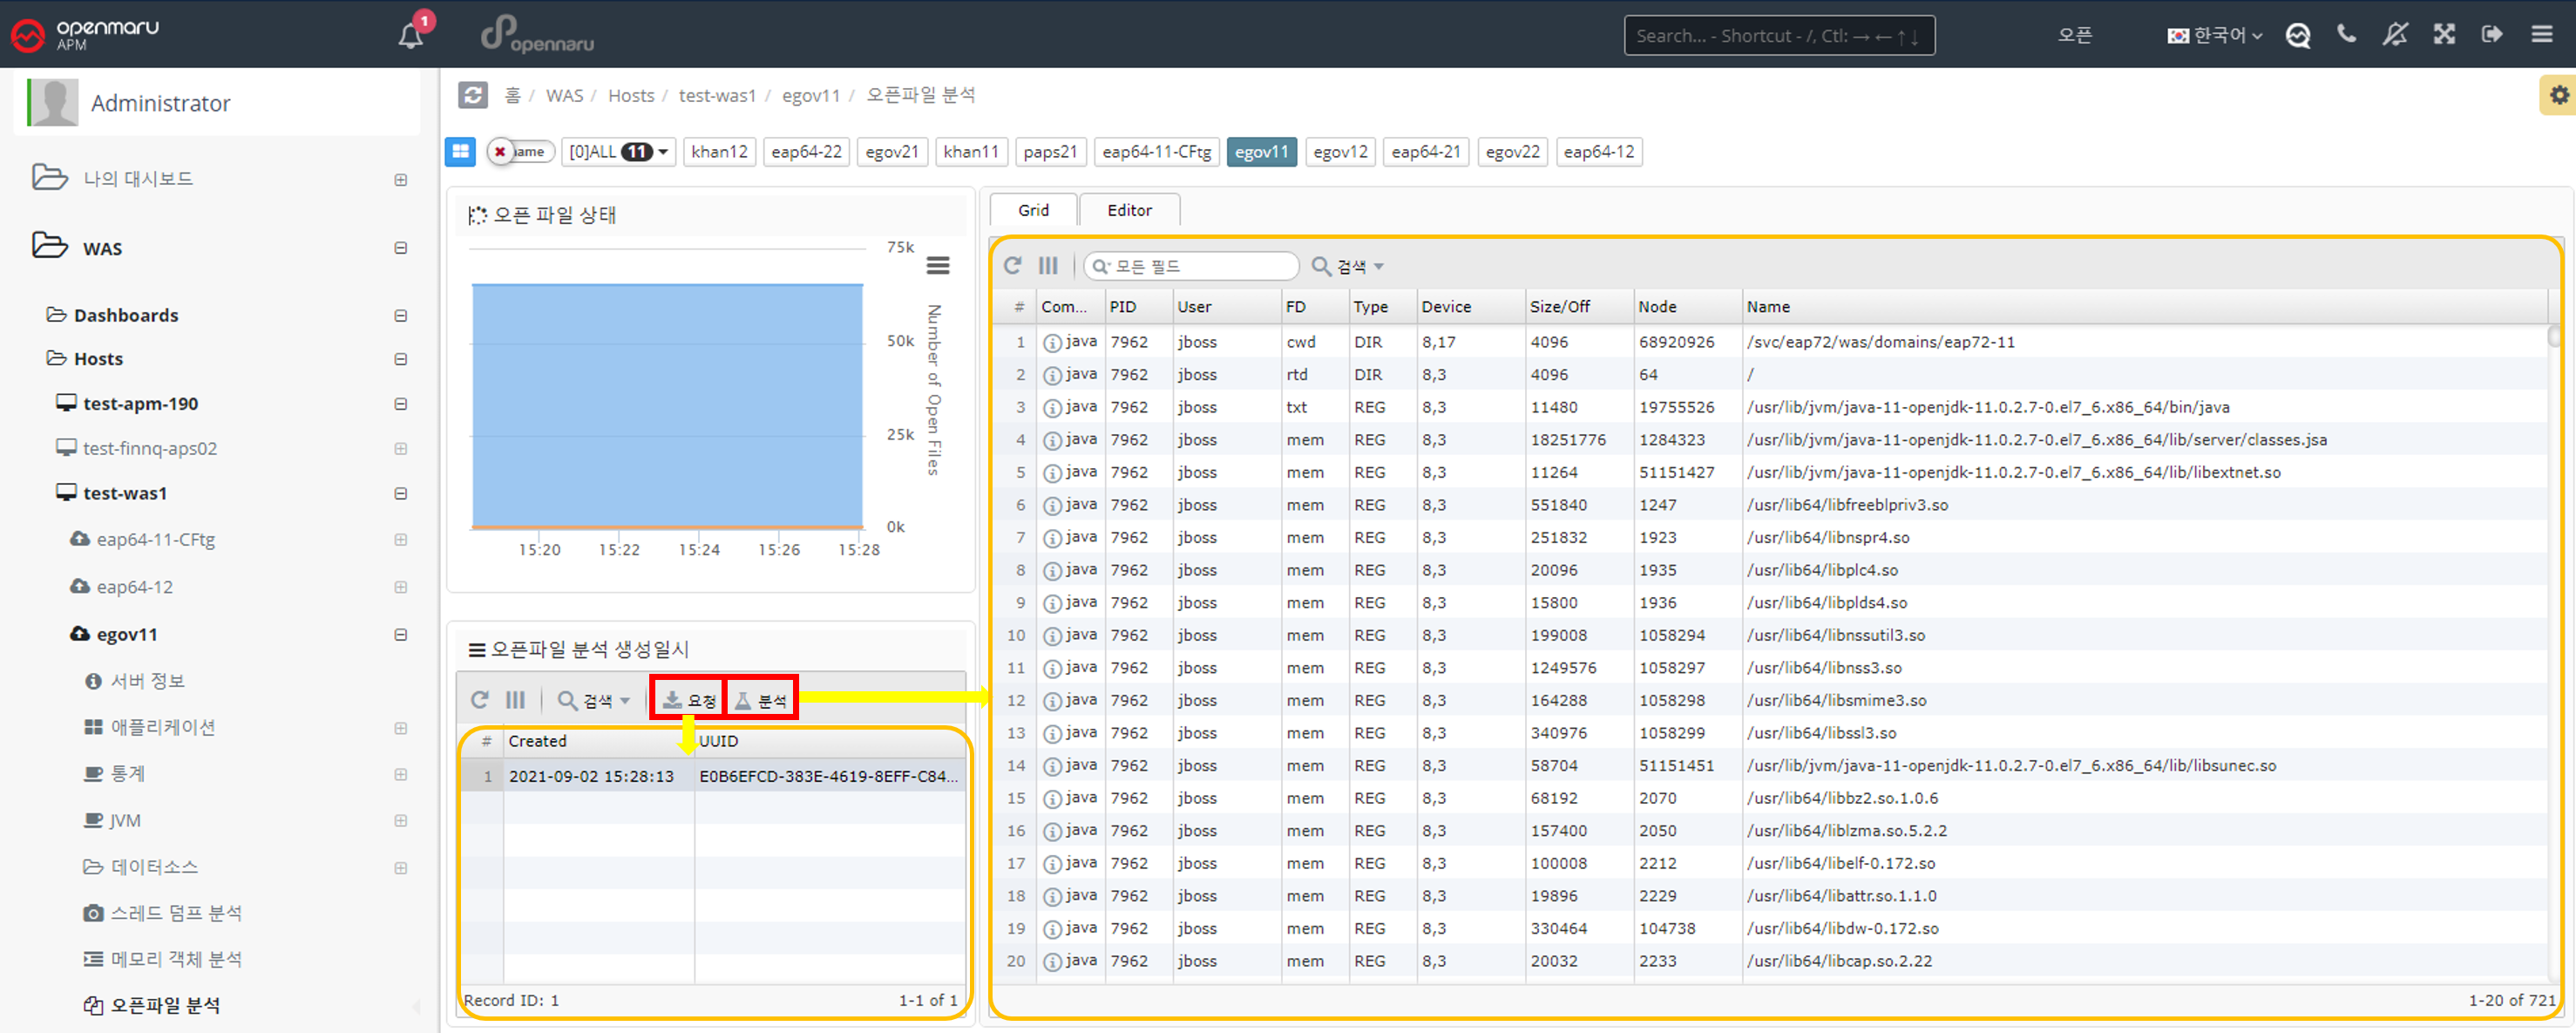
JVM > File Open Count
Displays a graph of the number of files opened in the WAS instance. It shows the maximum number of files that can be opened and the number of files that are currently open. To analyze which files are open, see Analyzing Open Files per WAS Instance.
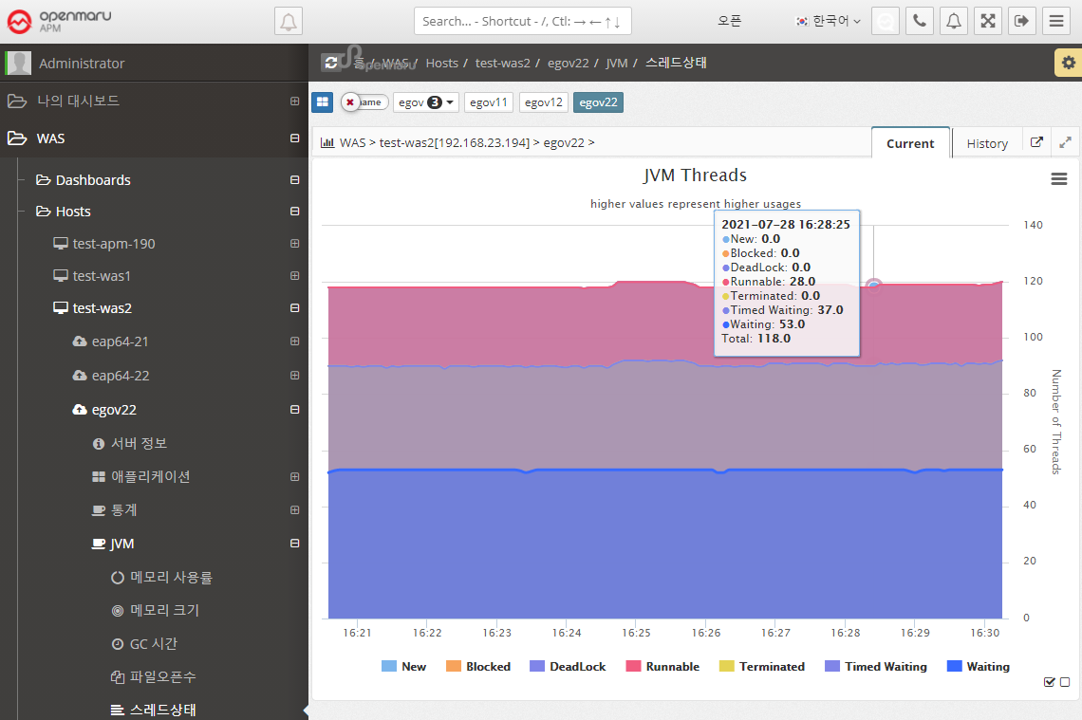
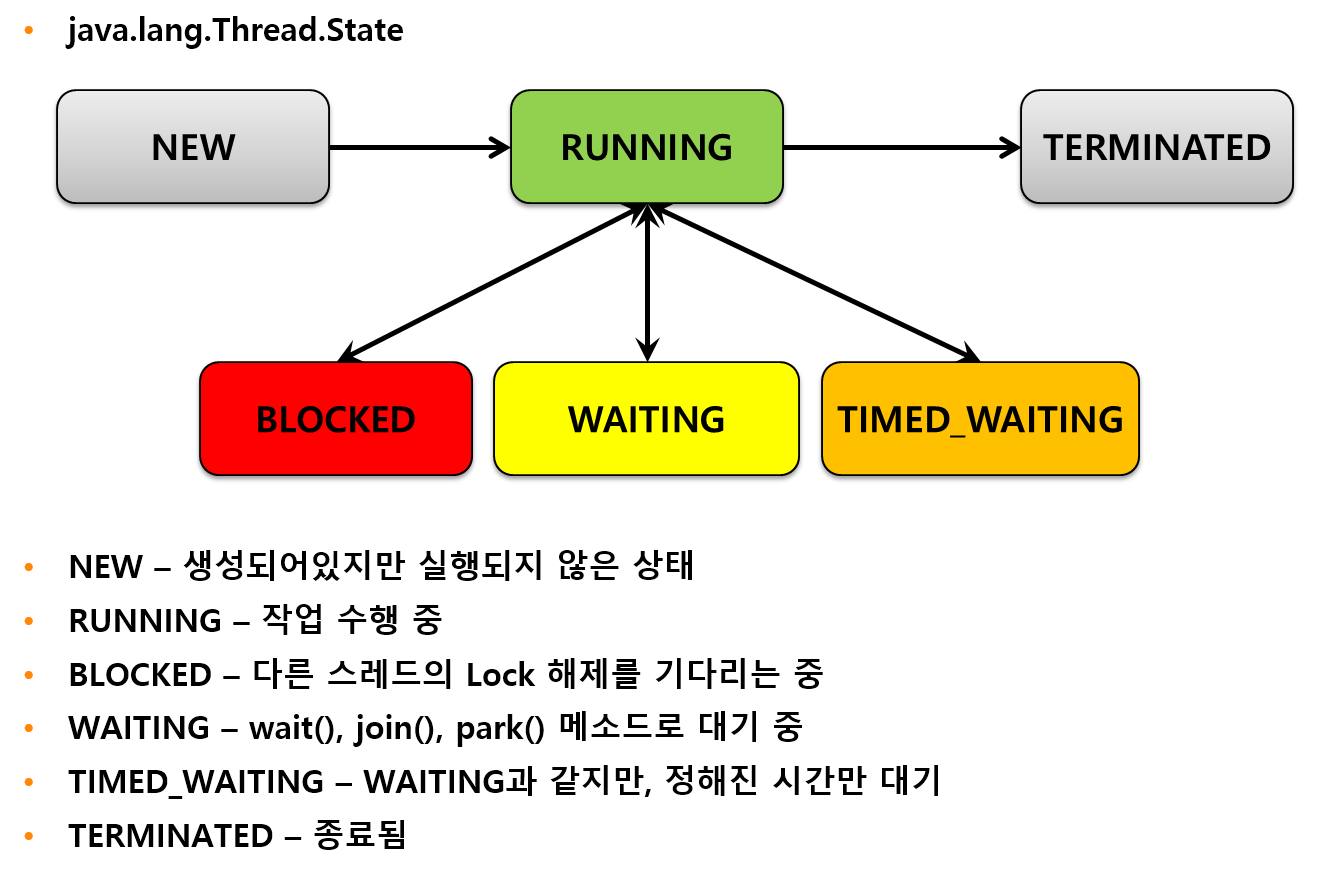
JVM > Thread State
Displays the status of the WAS instance’s threads in a graph. Expresses the status of Java threads such as New, Blocked, DeadLock, and Runnable. If a deadlock occurs, an Alert is raised to notify you that a deadlock has occurred.
2.2.5 Data Source by WAS Instance
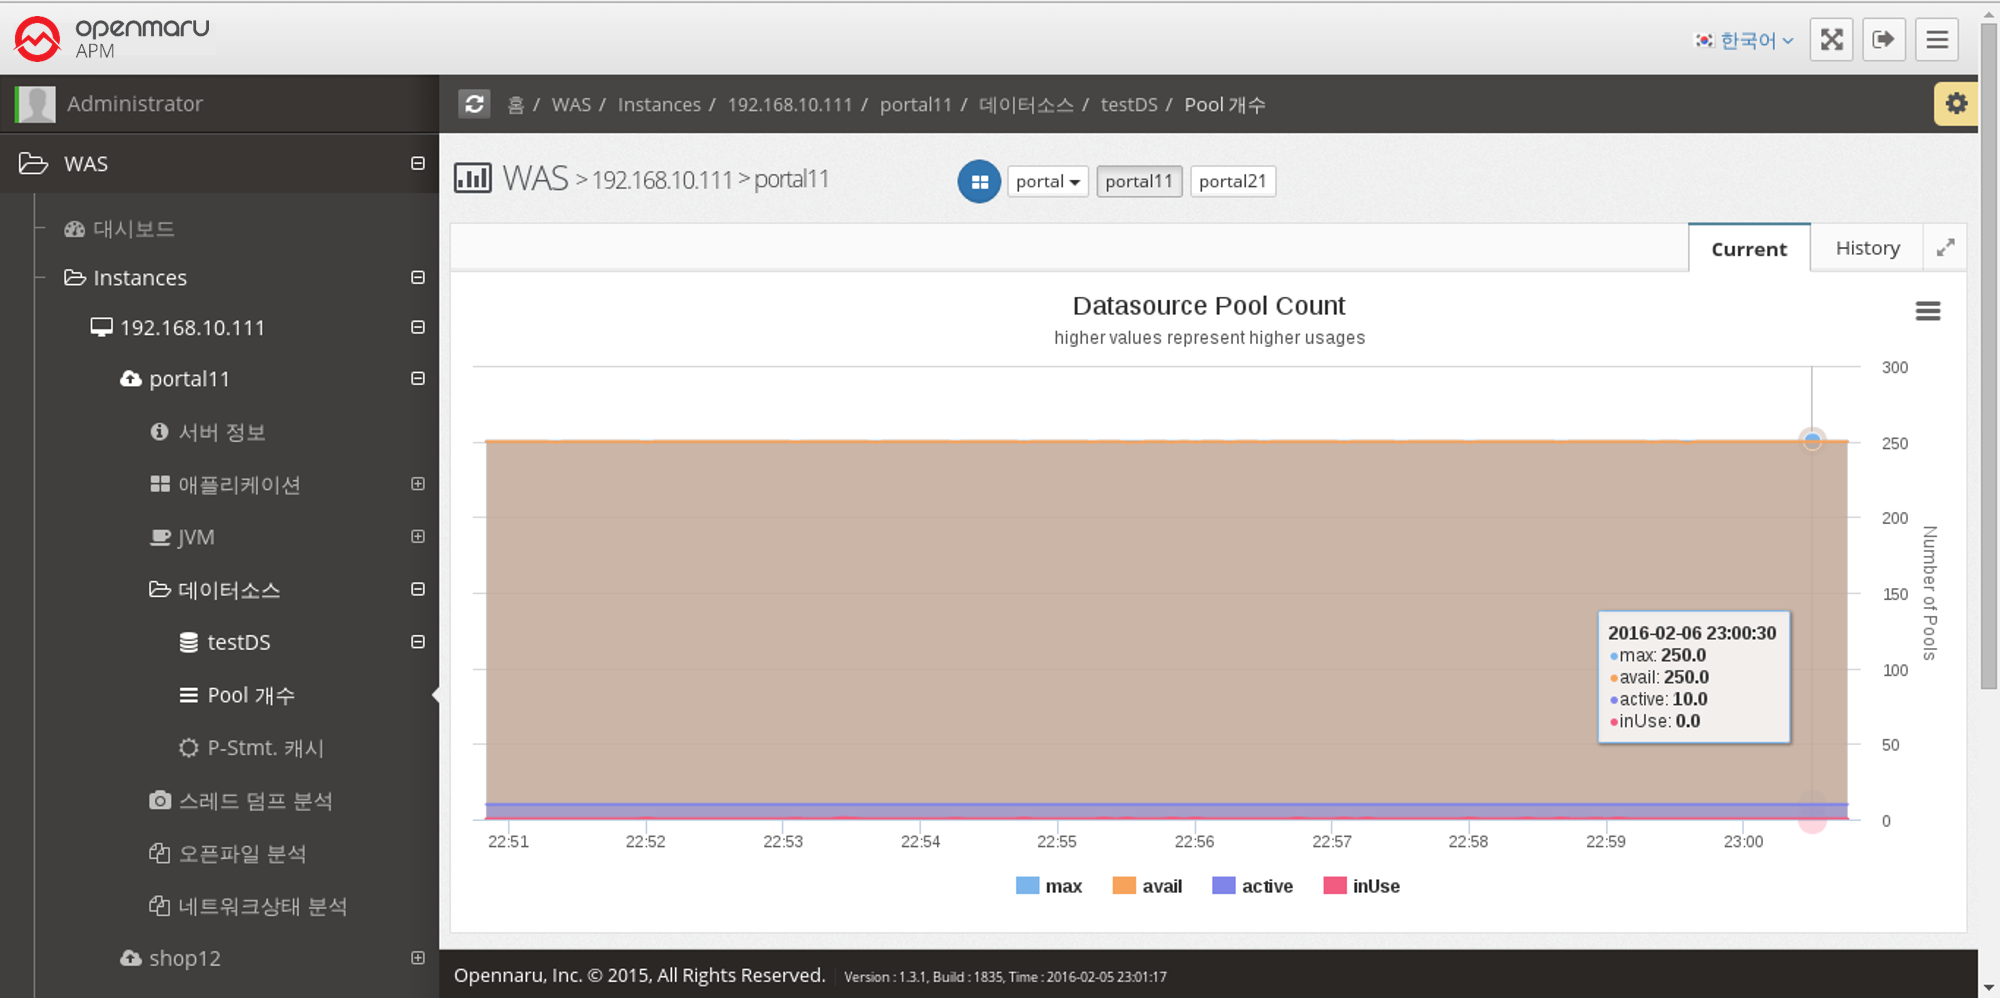
Data Source > Number of Pools
Displays the number of data source connection pools set by WAS in a graph.
Max displays the maximum number of connections set in the Connection Pool,
InUse shows the number of connections currently in use,
Active is the number of connections that are currently available,
Avail is the number of currently connected connections, which is displayed as Active + Idle.
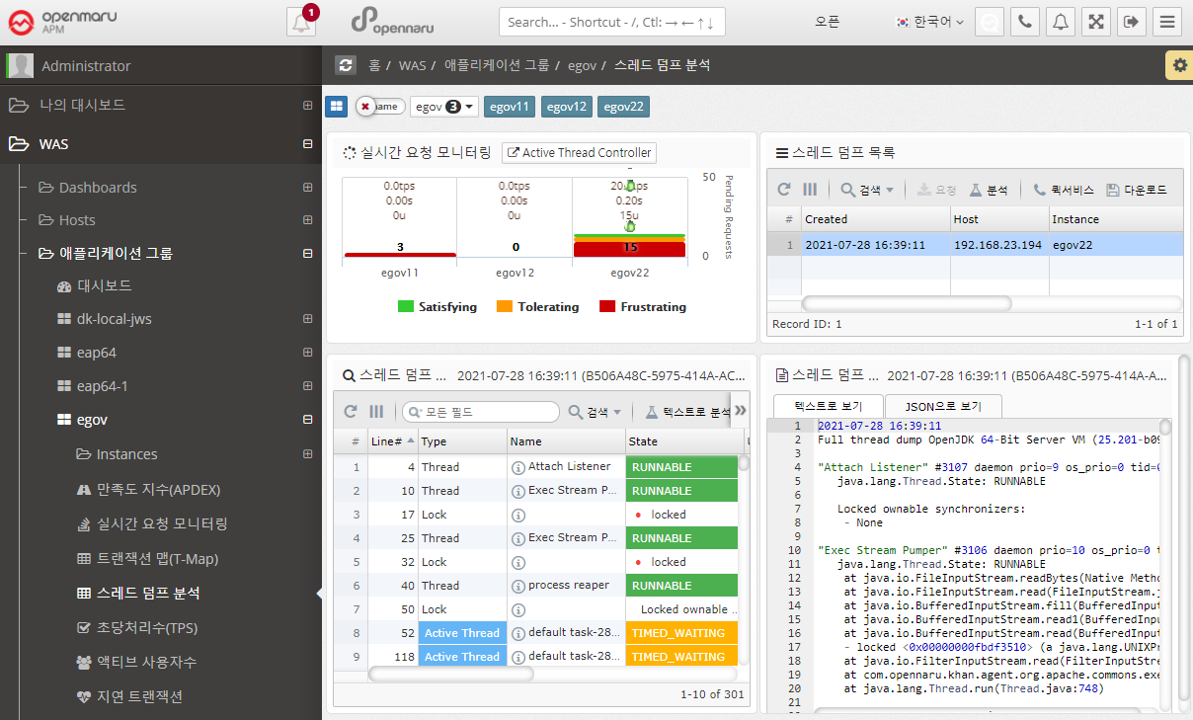
2.2.6 Analyzing thread dumps by WAS instance
Analyzing thread dumps
To see what is currently running in a WAS instance, you can analyze the thread dump.
For details on how to analyze a thread dump, see, How to analyze when the server is slow.
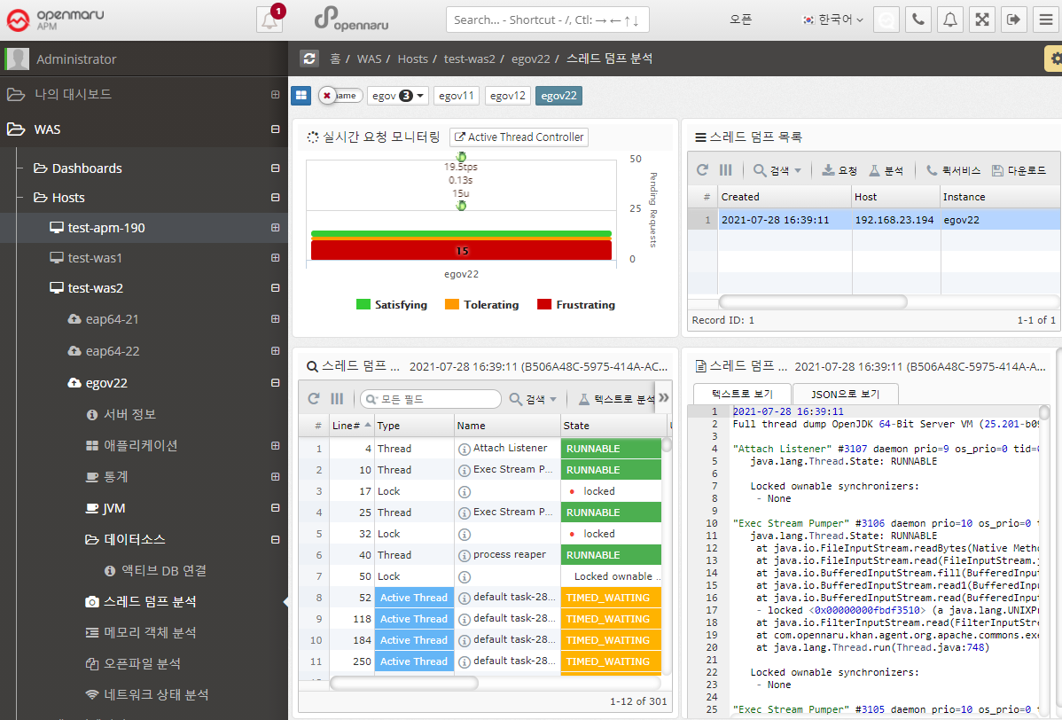
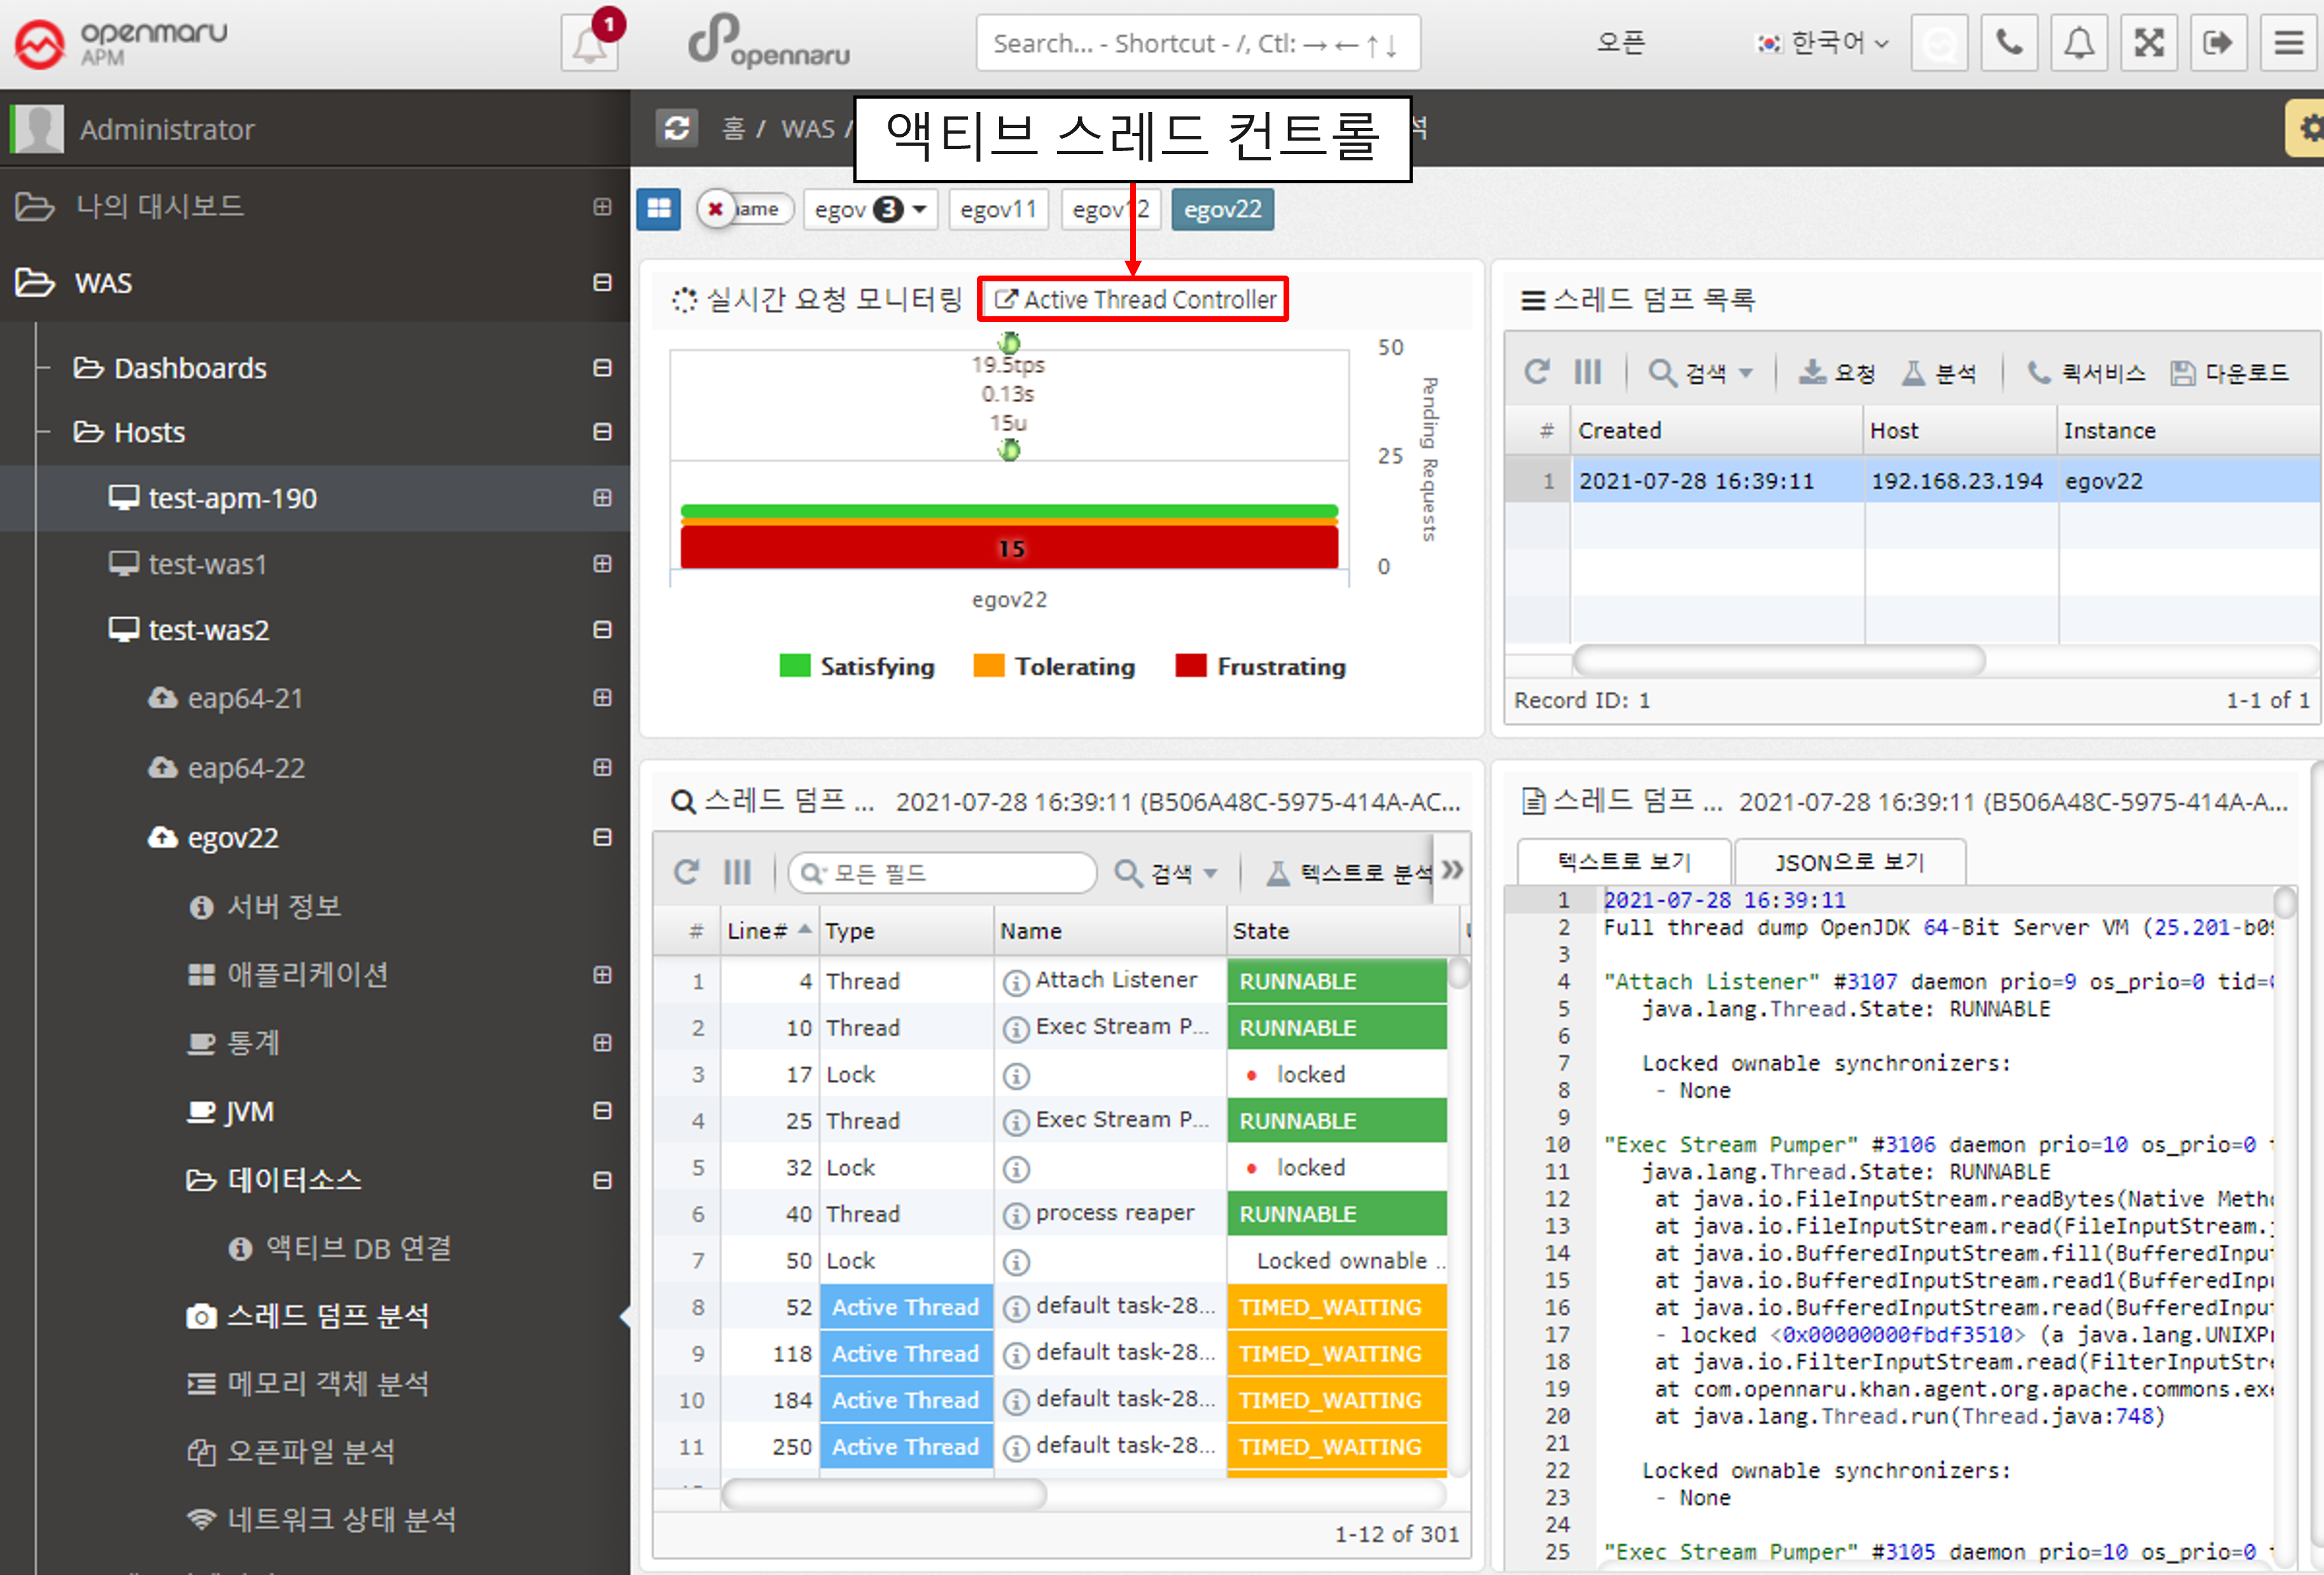
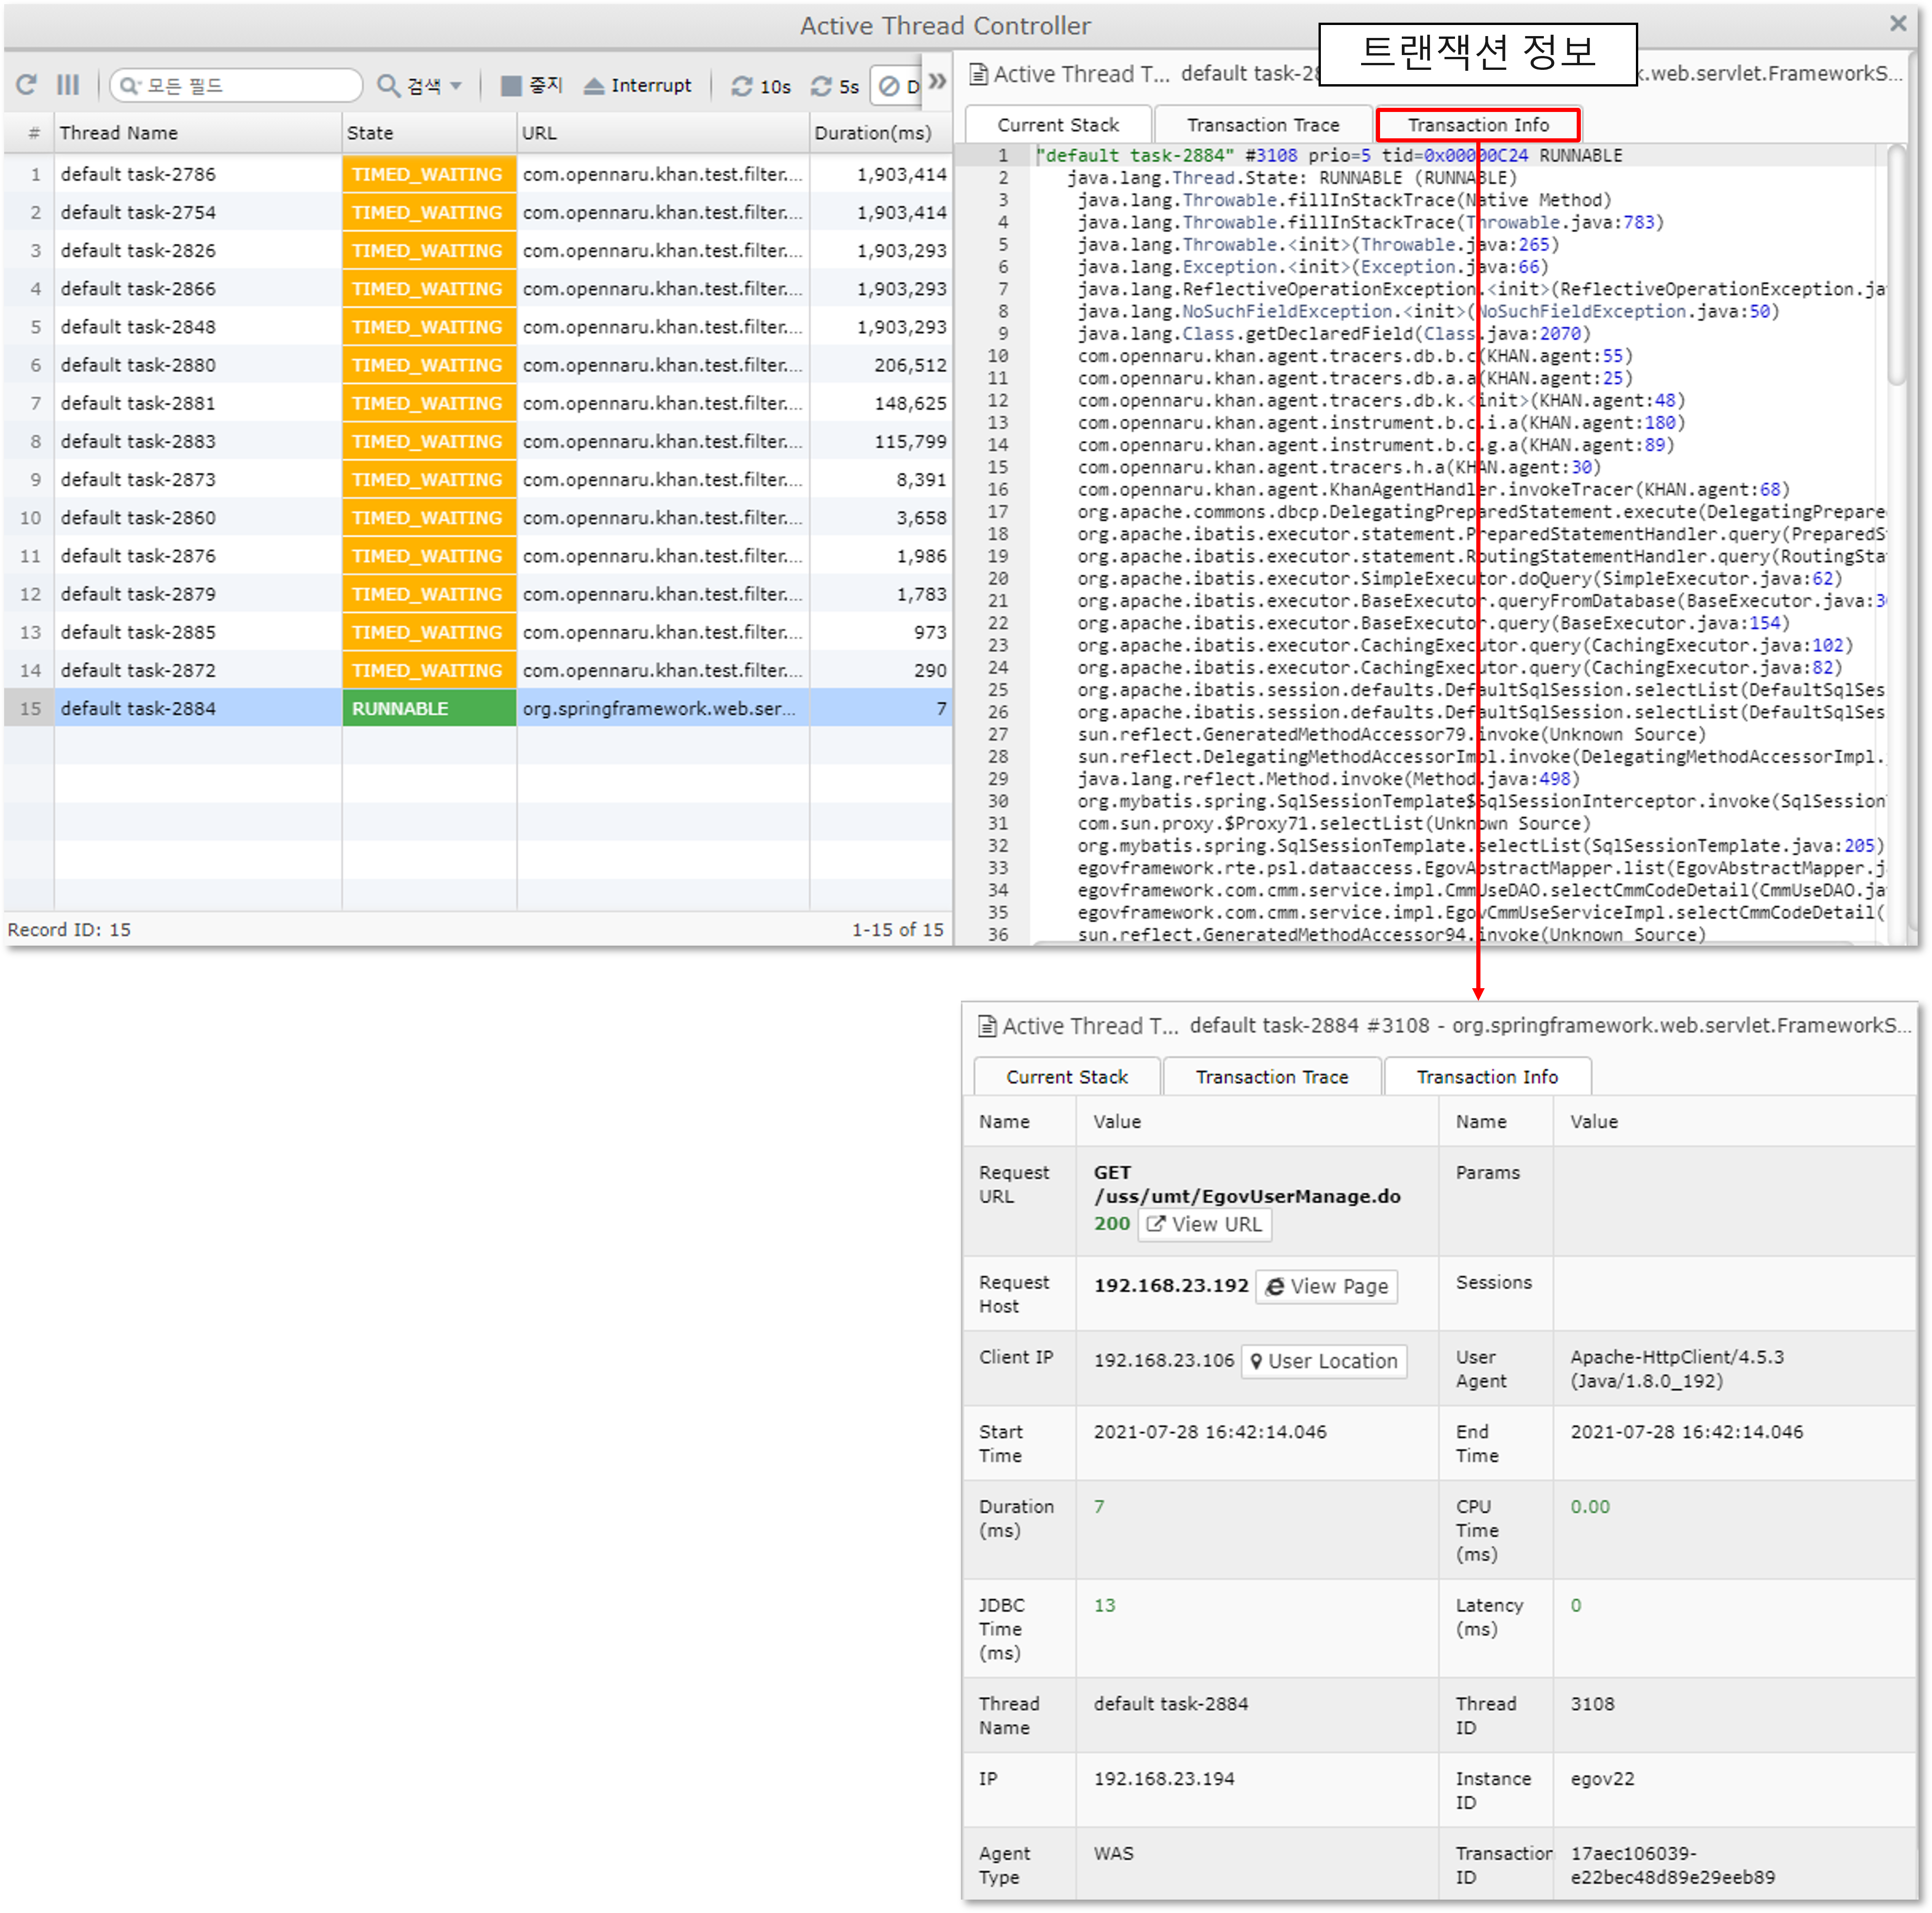
Active Thread Control
Active Thread Control allows you to view information about the currently running threads without requesting a thread dump.
In addition, you can additionally view detailed transaction information, such as viewing the transaction information of the currently running thread in the T-Map.
2.2.7 Analyzing Memory Objects by WAS Instance
Analyzing Memory Objects
You can analyze the objects being used by a given WAS instance.
Click the Request button to generate a histogram. Select the histogram and click the Analyze button to view the results.
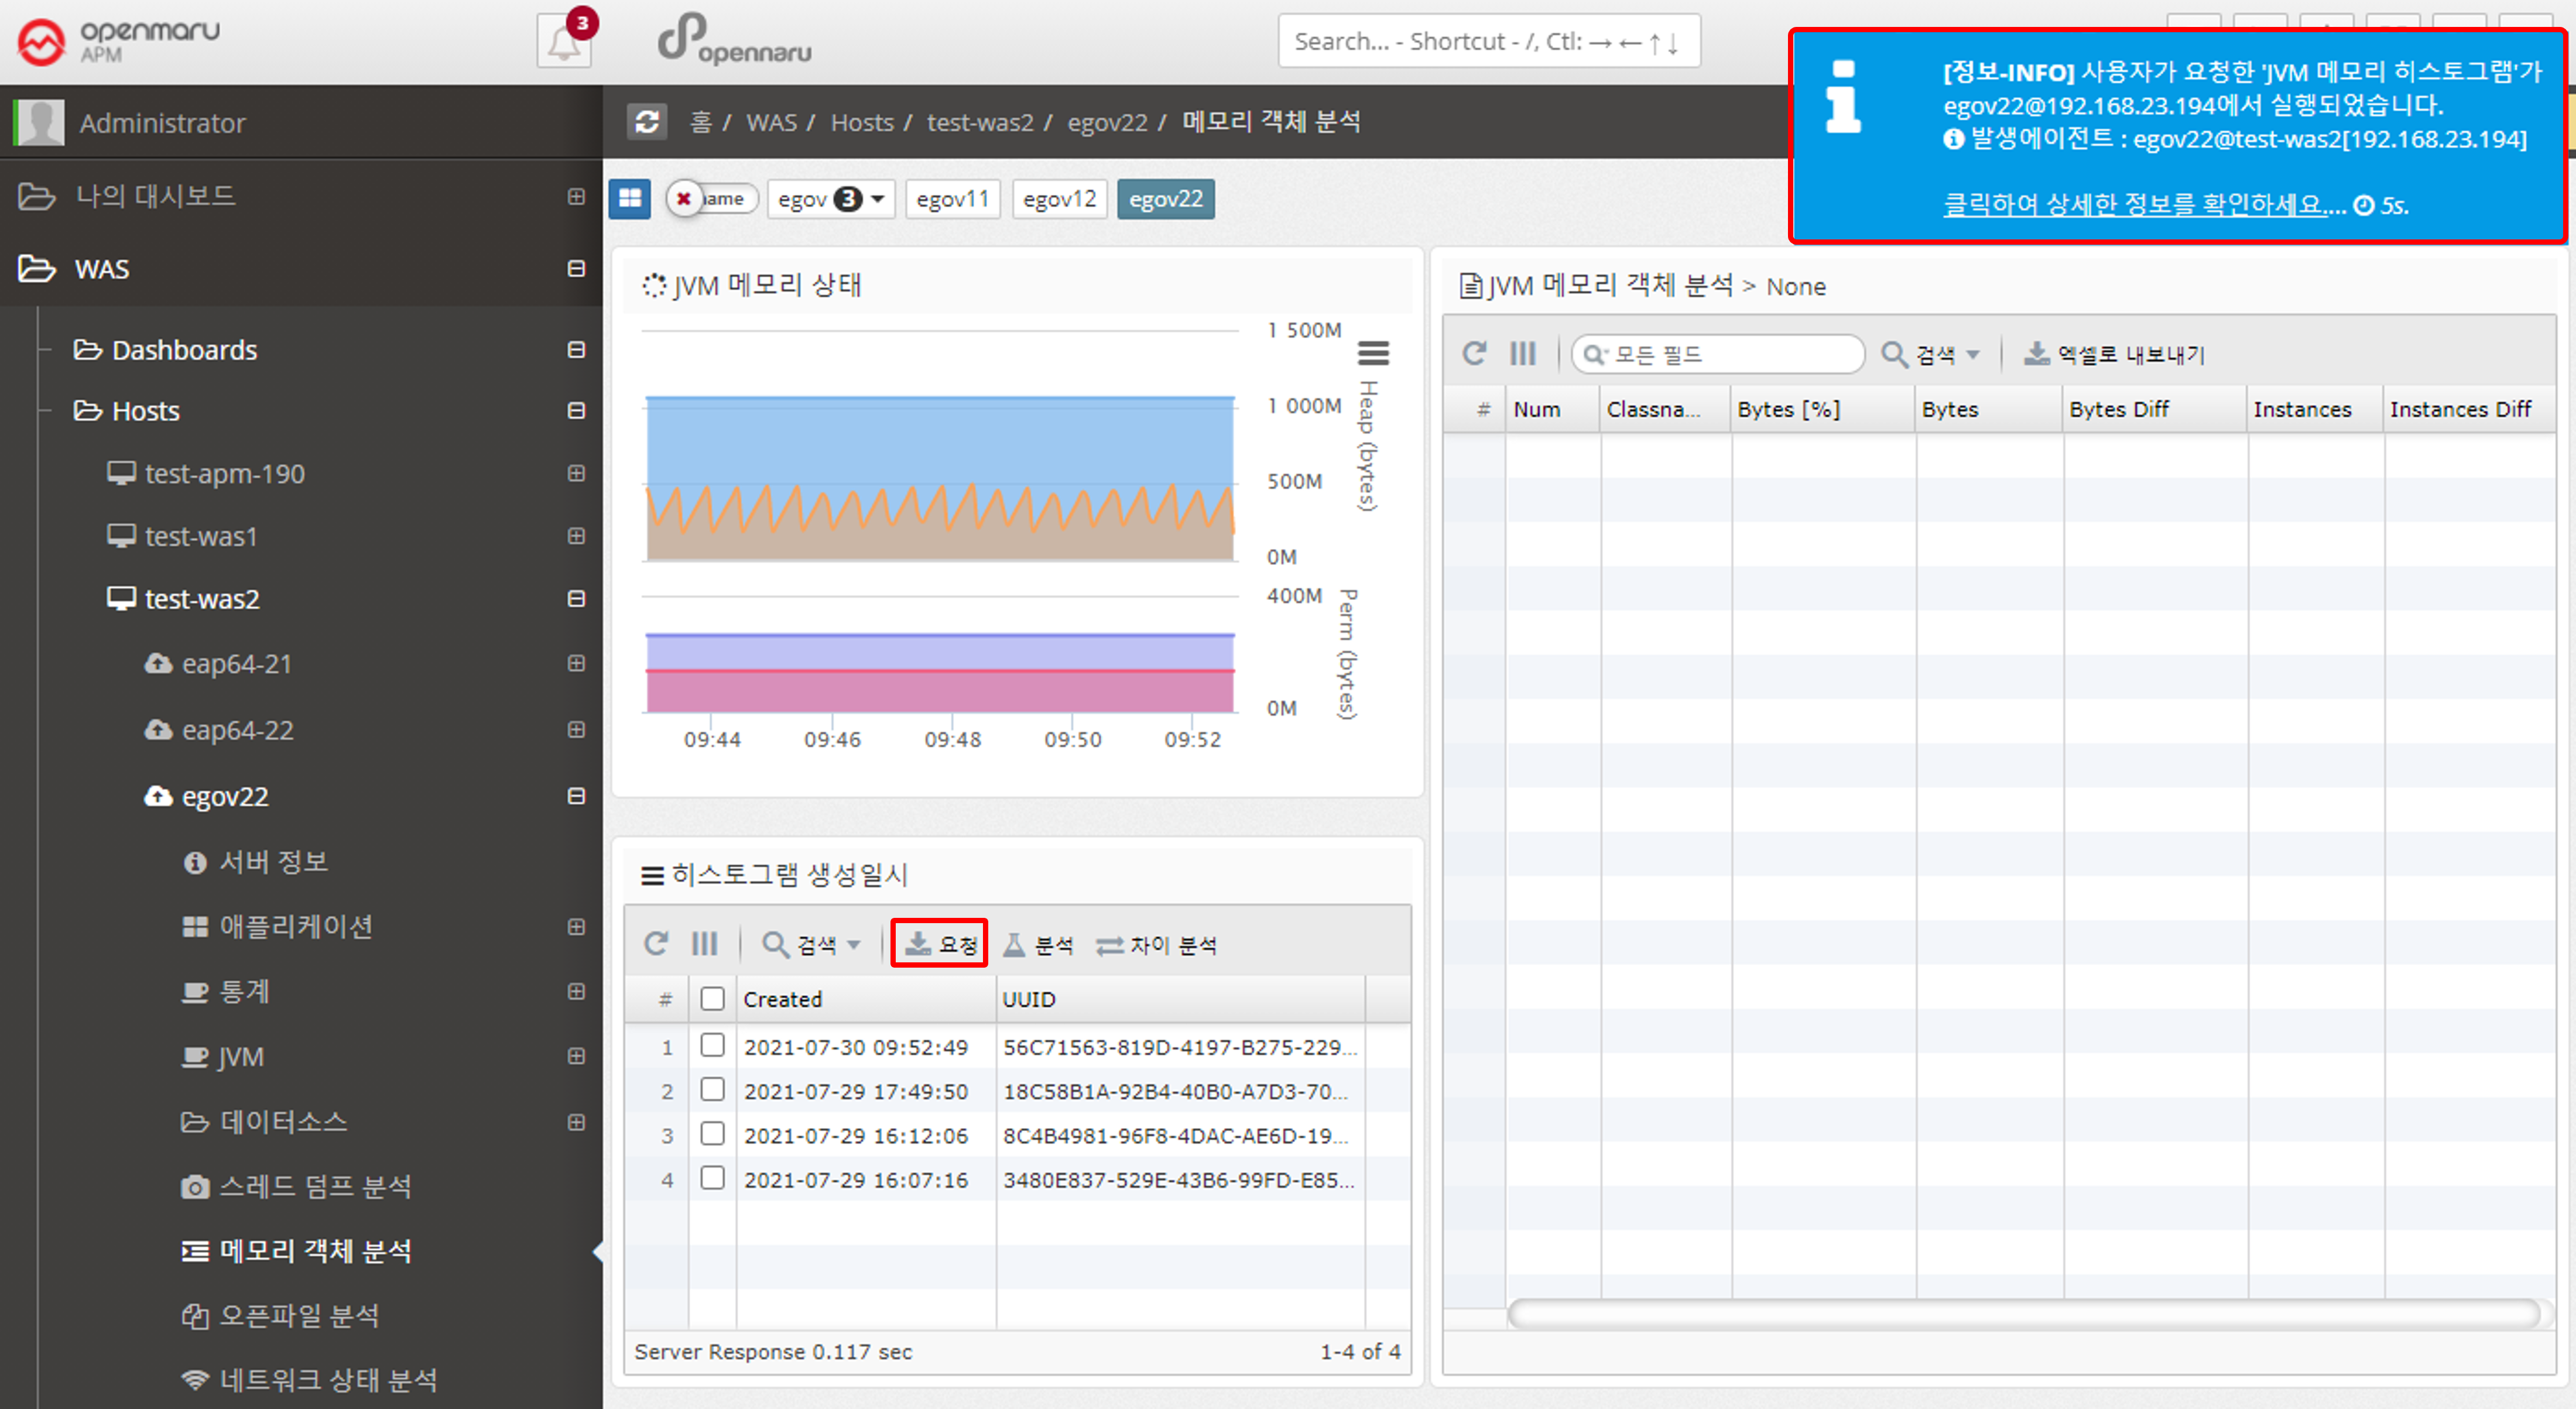
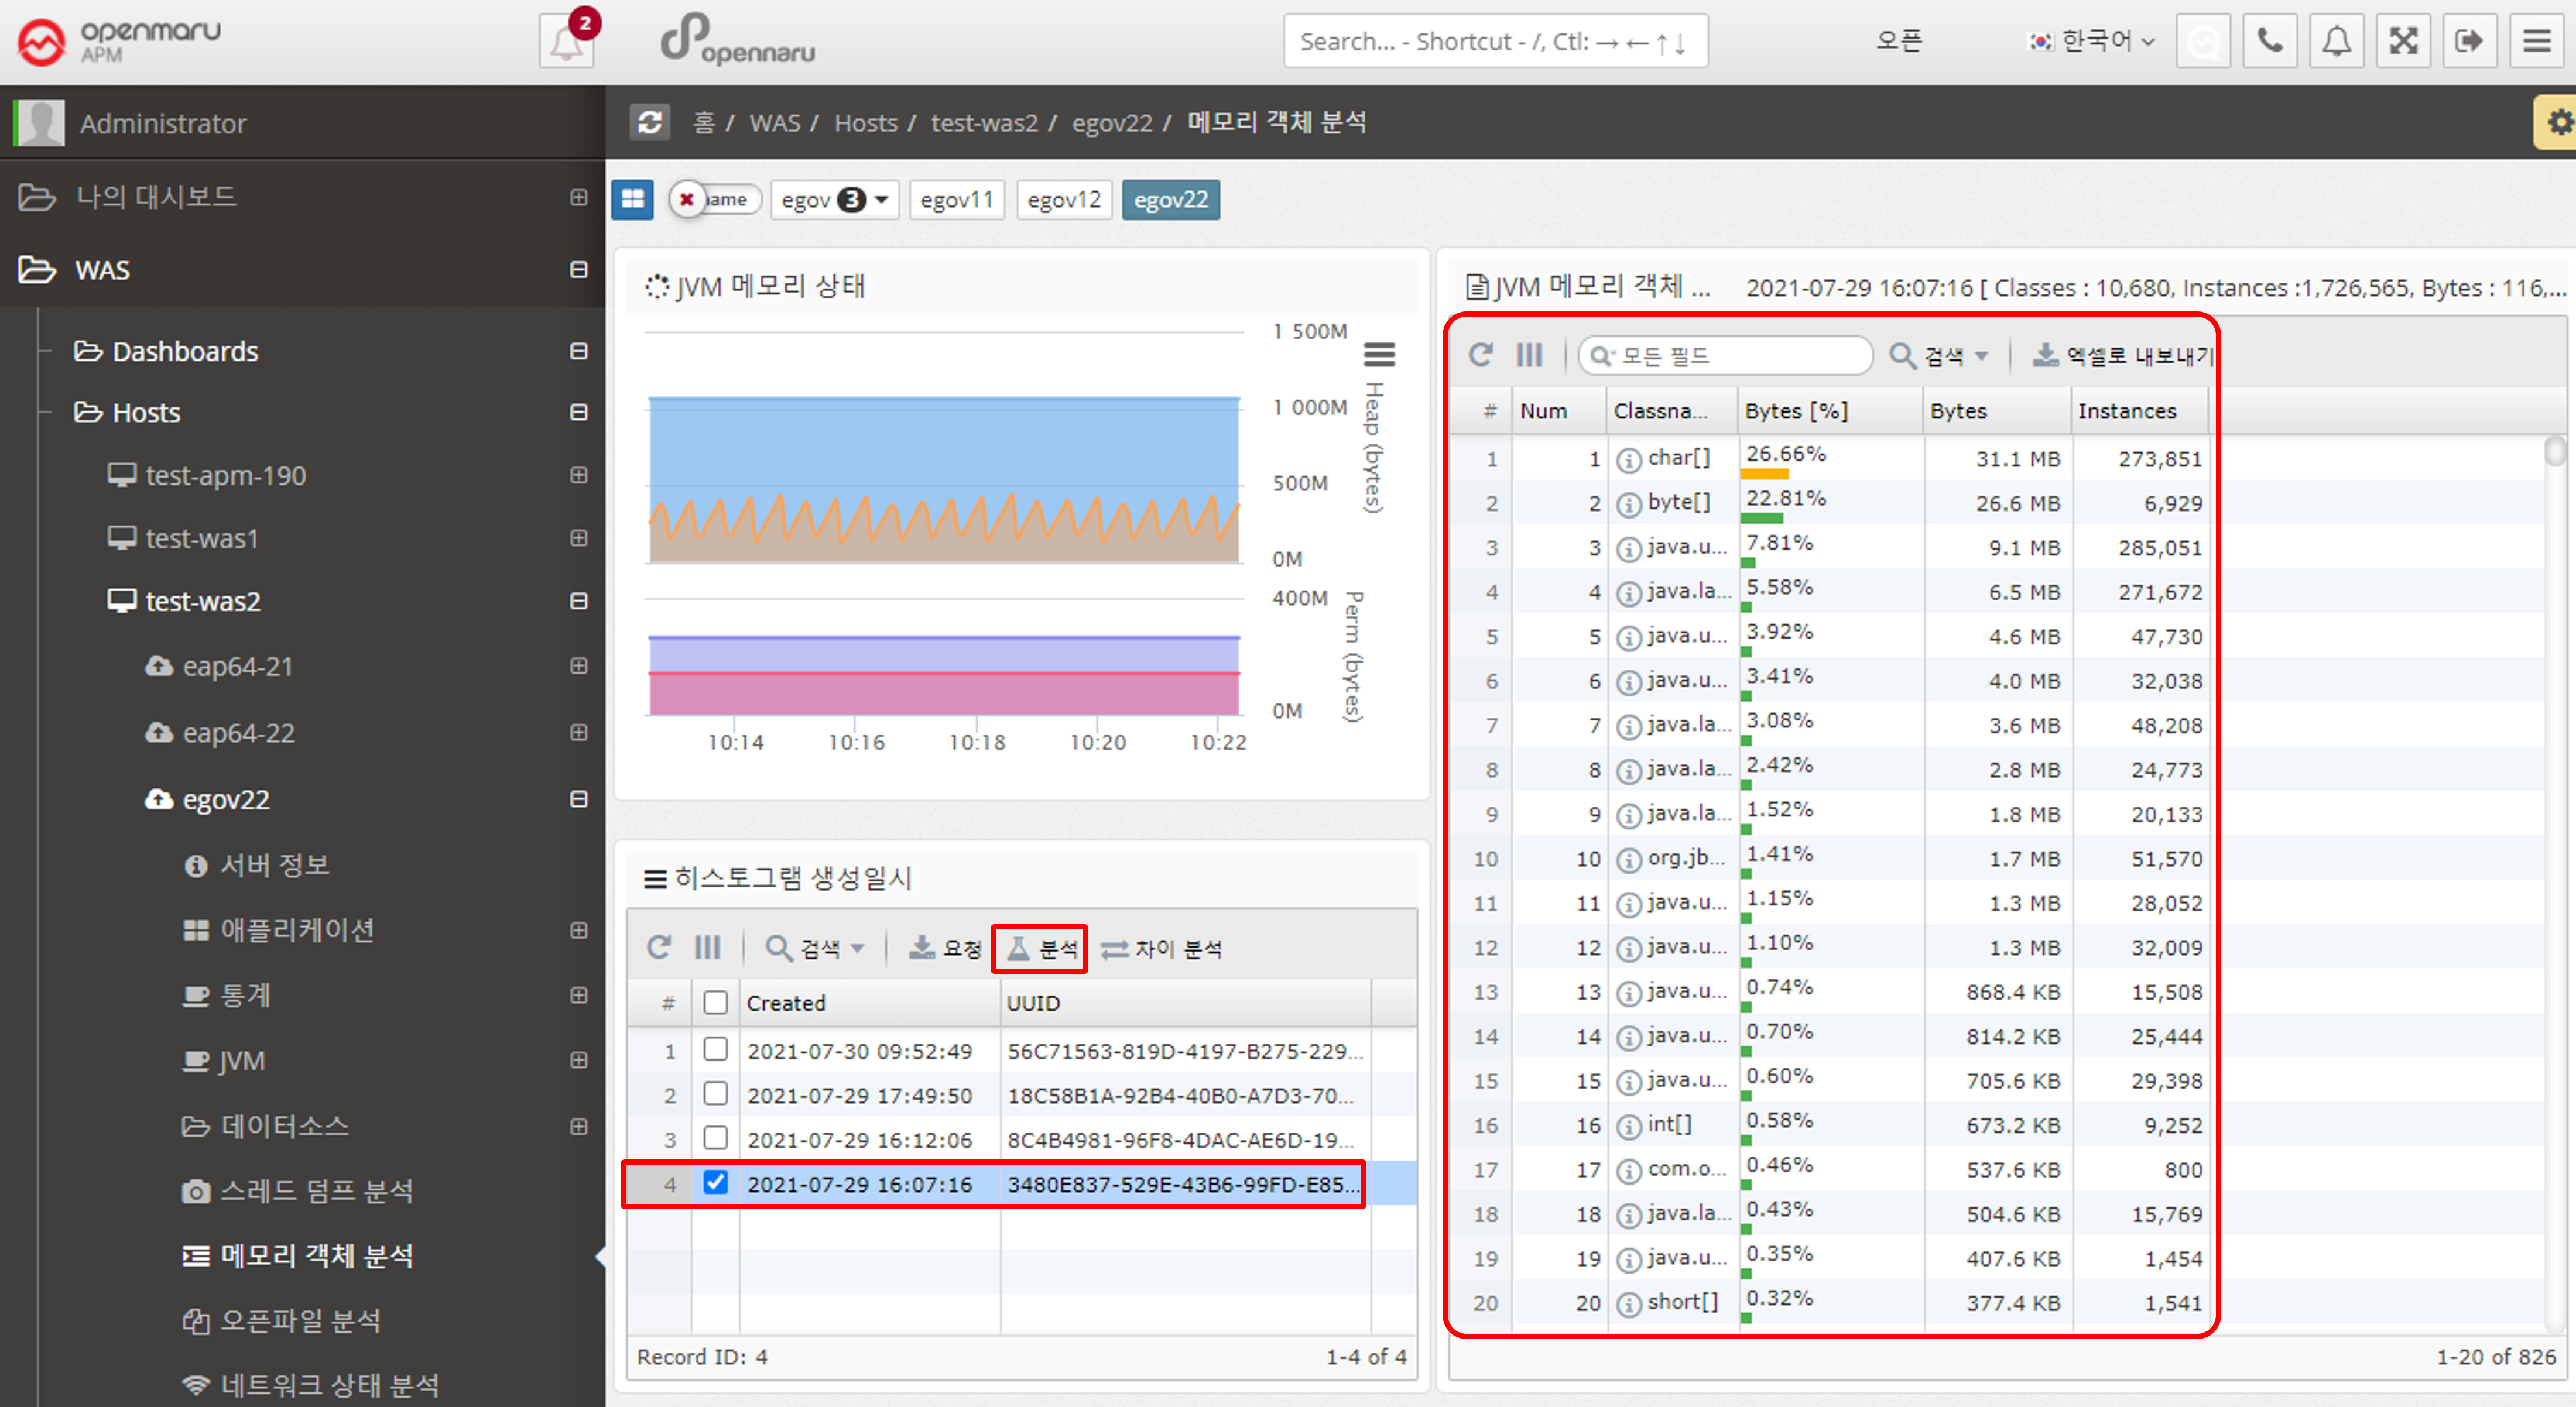
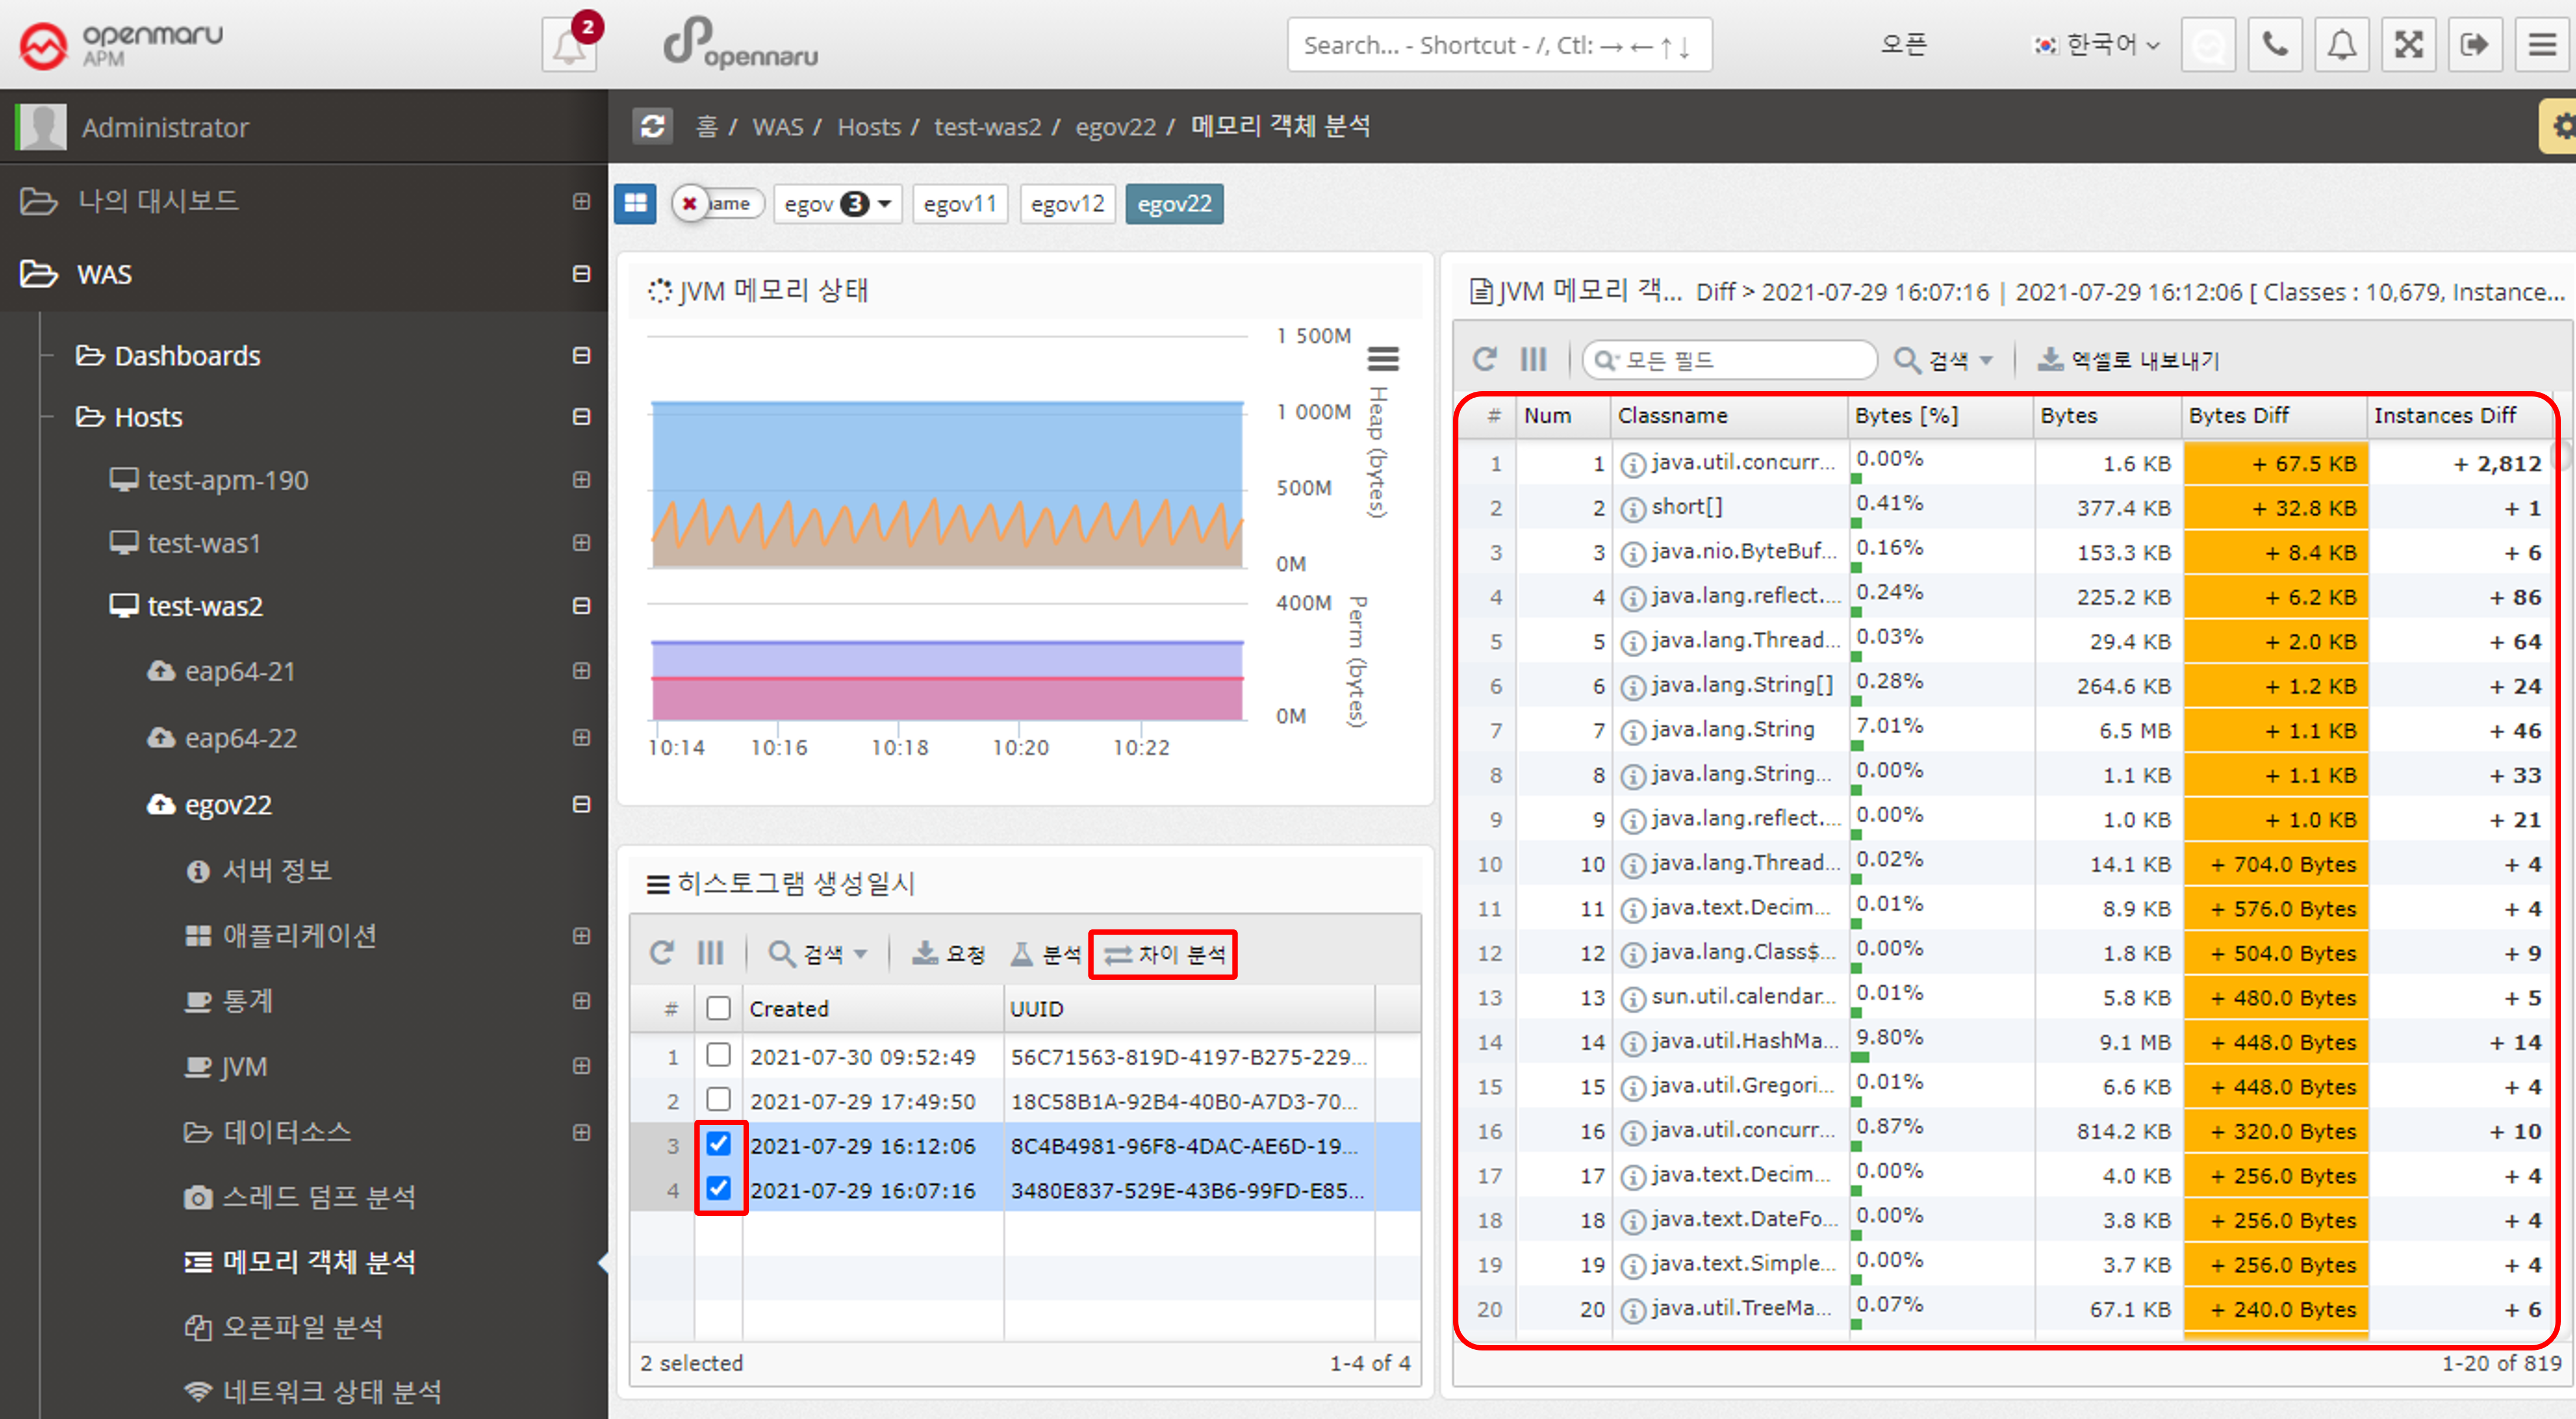
Select the histogram you want to analyze for differences. You can also use the 'Analyze Difference' button to see the change in objects before and after.
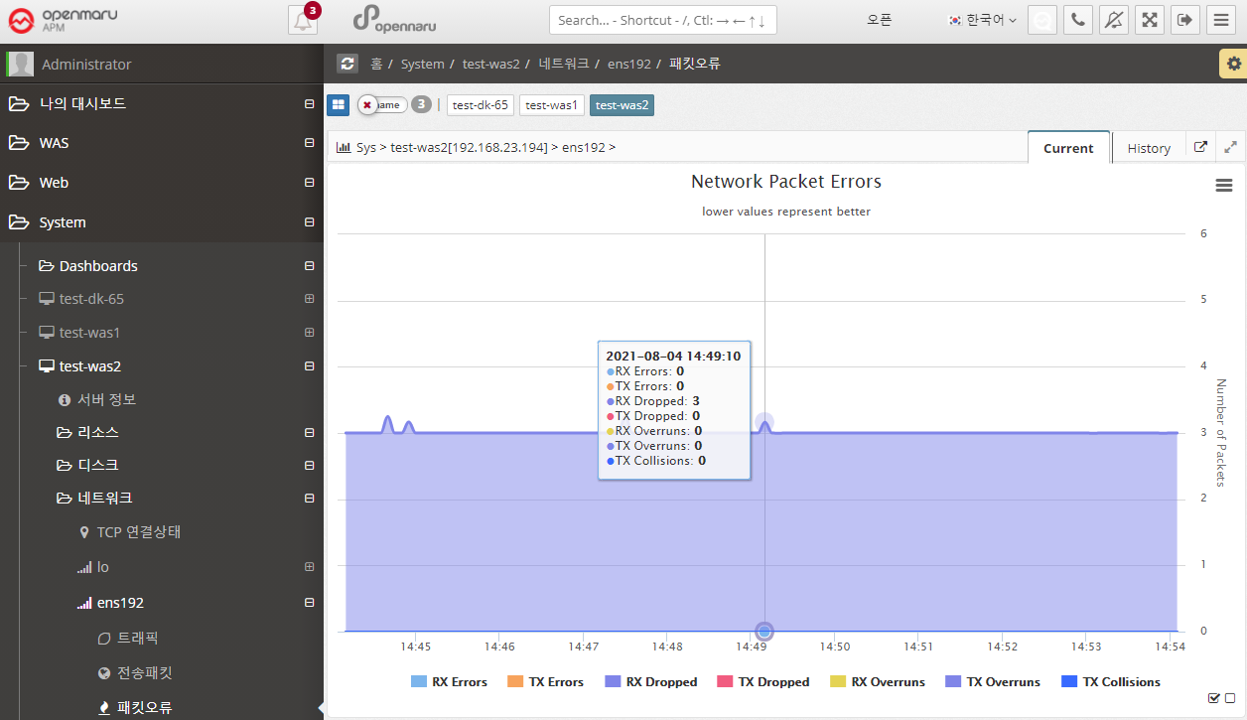
2.2.9 Analyzing Network Health by WAS Instance
Analyzing Network Health
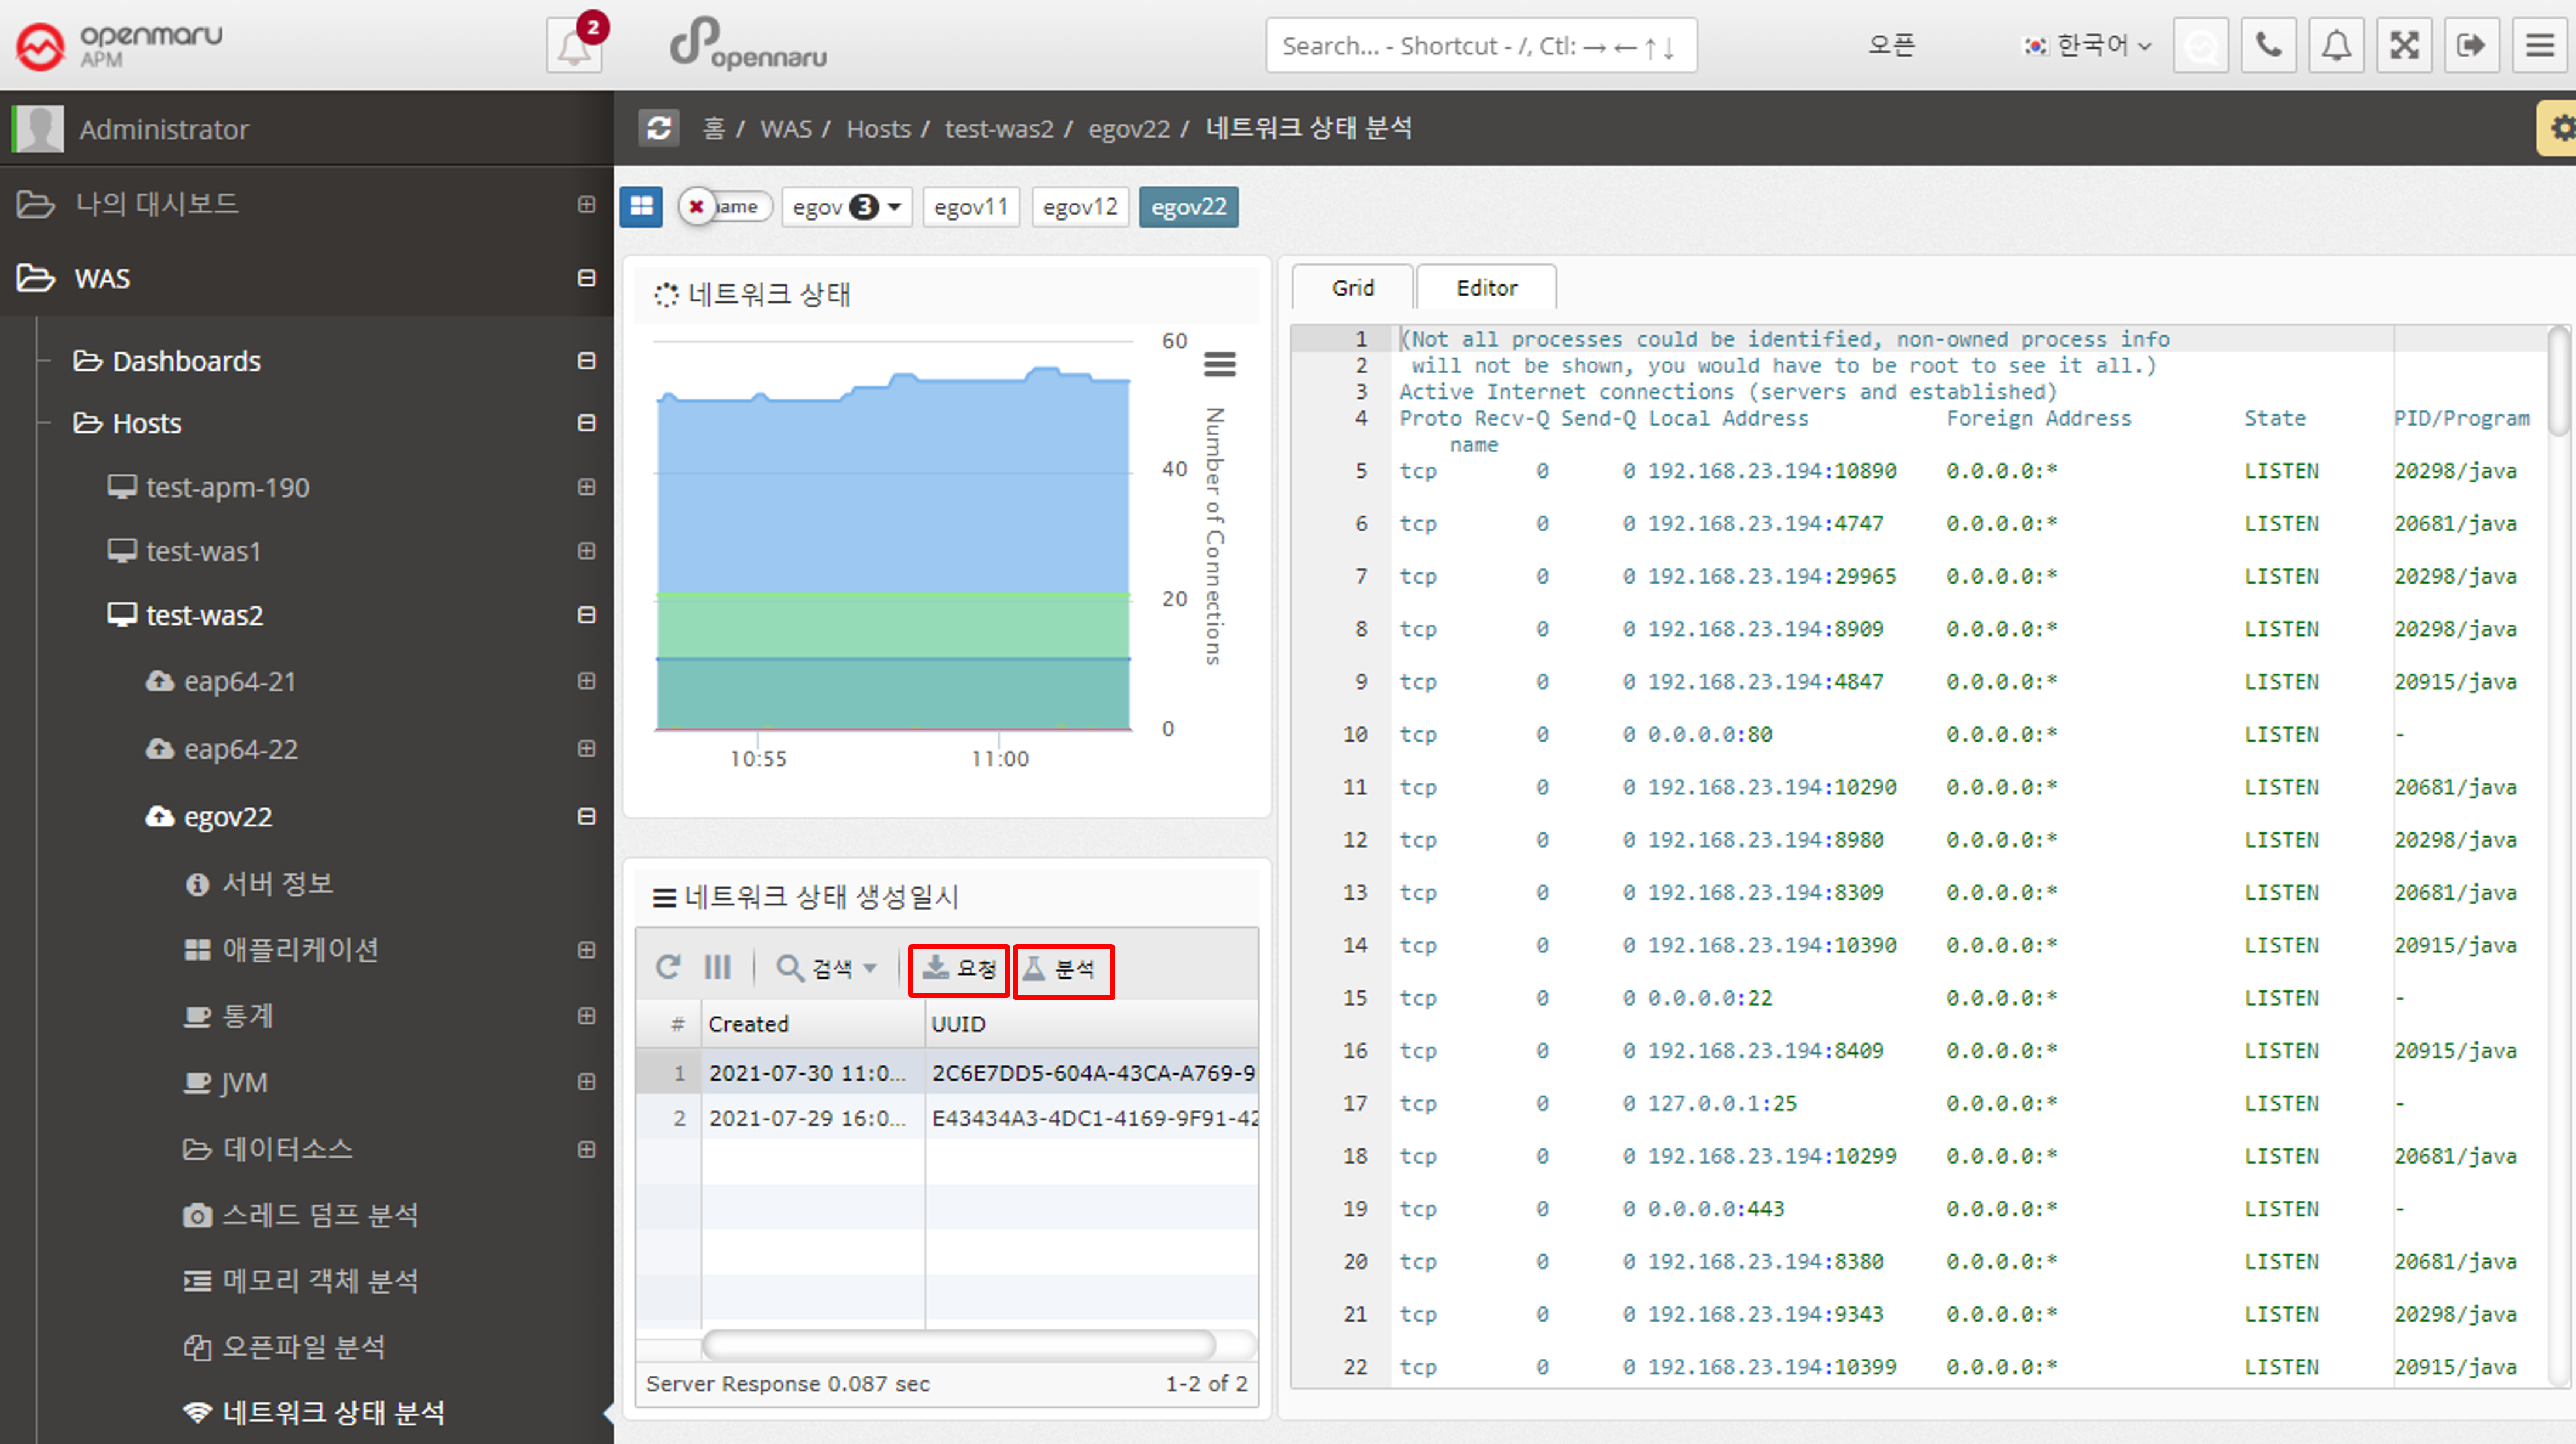
The network health analysis of a WAS displays information about the TCP connections used by that WAS instance (Linux-based operating systems only). It shows only the ports used by the WAS instance. The graph in the upper left corner is only visible if the System Agent is installed on the machine where the WAS instance is installed.
To view system-wide TCP connection status information, go to System > Network > TCP Connection Status.
If you see an excessive increase in a particular item, you need to check which port or IP address is causing it. In the network status analysis, click the 'Request' button on the left to analyze individual TCP connections at the current time.
Each time you click the 'Request' button, the server stores the data at the current time, and when you click the 'Analyze' button, the information is displayed on the right.
2.2.10 Business Groups - Applications
This item is used to get an overall view of processing by task. You can use it to get an overall picture of your business system because you usually configure multiple WAS instances to handle a single task.
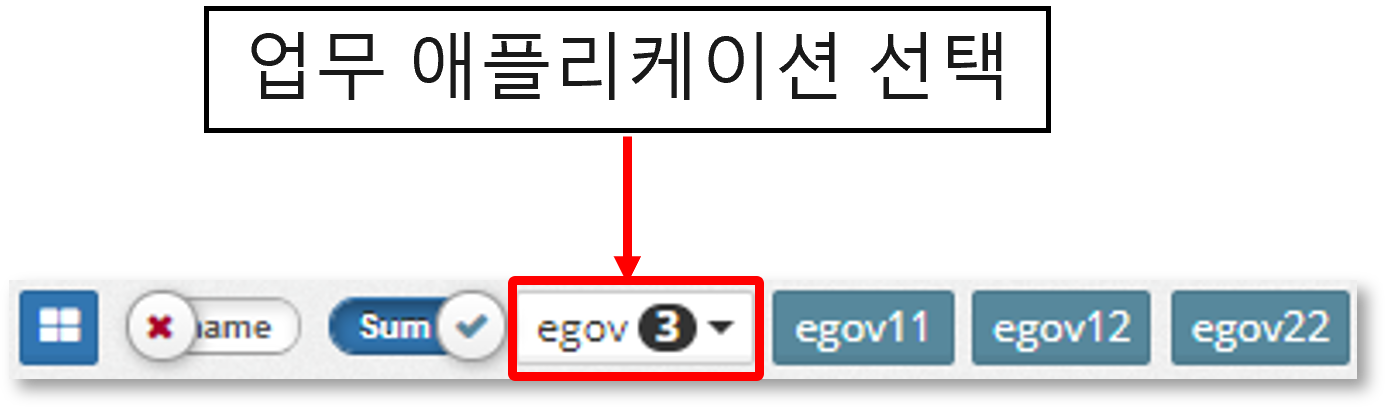
When you select a business application name in the 'Navigator' at the top of the graph, the current graph changes to a graph for that business. Individual instances are not selected in the task-specific group.
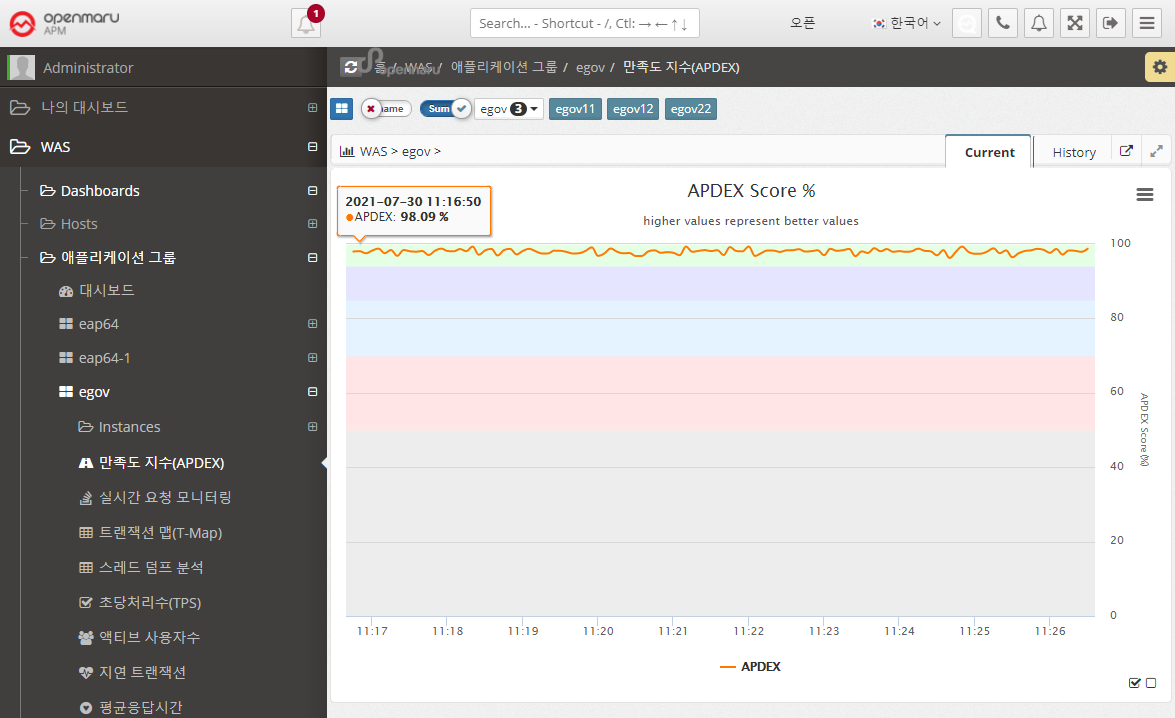
Application > Satisfaction Index (APDEX)
Displays a graph of the user satisfaction index (APDEX) for the application. Multiple instances used for a task are summed to get the average APDEX value and graphed.
Applications > Real-Time Request Monitoring
Displays information requested by applications organized by task in real time. You can monitor the processing status of requests.
Application > Transaction Map (T-Map)
Displays the Transaction Heatmap (T-Map) for the job. For instructions, see APM Dashboard Screen Configuration - Transaction Heatmap (T-Map).
Application > Analyze Thread Dump
To see what is currently running in your WAS instance, you can analyze it using thread dumps.
For details on how to analyze a thread dump, see, How to Respond to Server Failures with APM.
Applications > Transactions Per Second (TPS)
Summarizes and graphically displays the transactions per second (TPS) for all WAS instances that comprise the business system.
Applications > Active Users
Summarizes and graphs the number of active users (the only users who have made a request in the last 5 minutes) for all WAS instances that make up the business system.
Applications > Lazy Transactions
Displays the latency information of all WAS instances that make up the business system in the form of Satisfying, Tolerating, and Frustrating statistics.
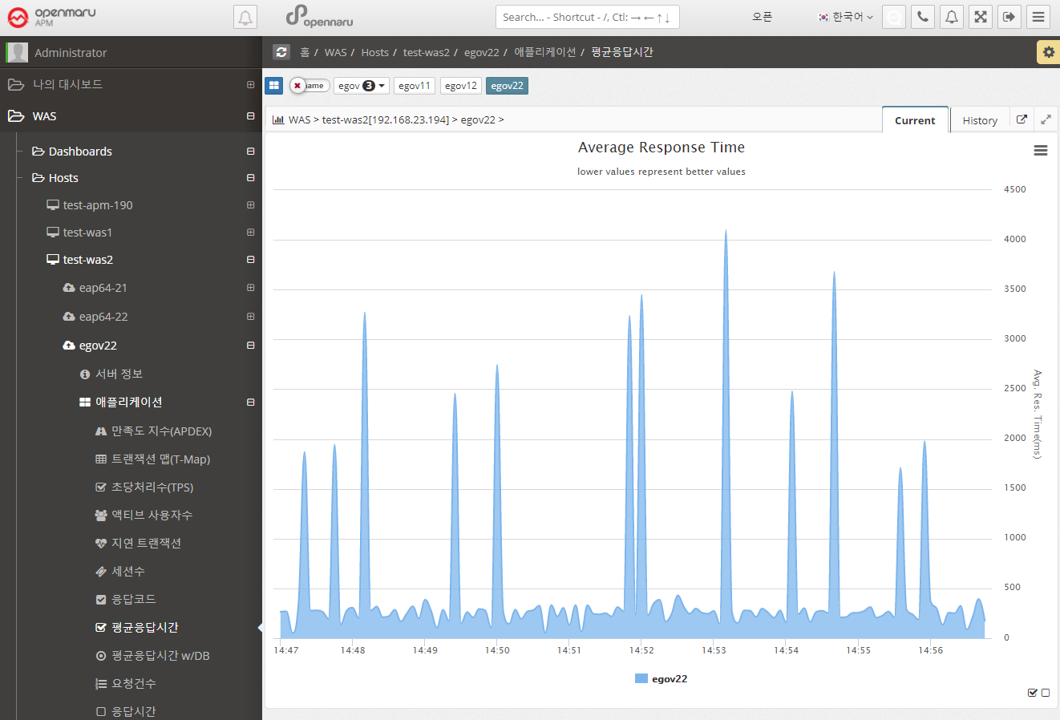
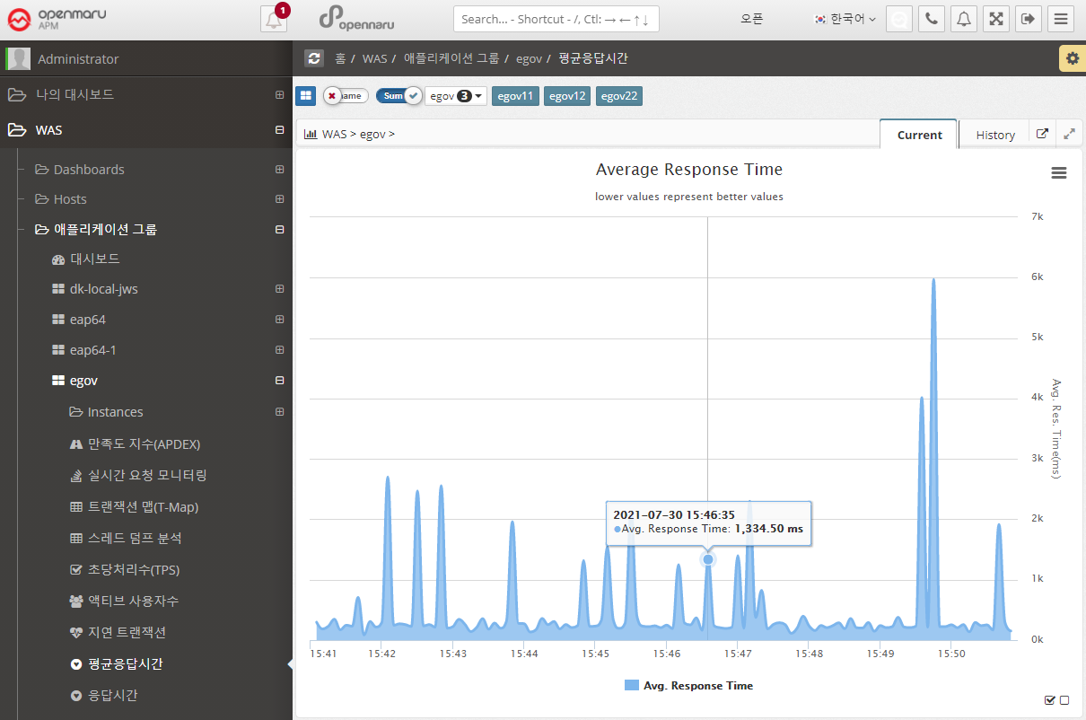
Applications > Average Response Time
Summarizes the average response time of all WAS instances that make up the business system and displays it in a graph.
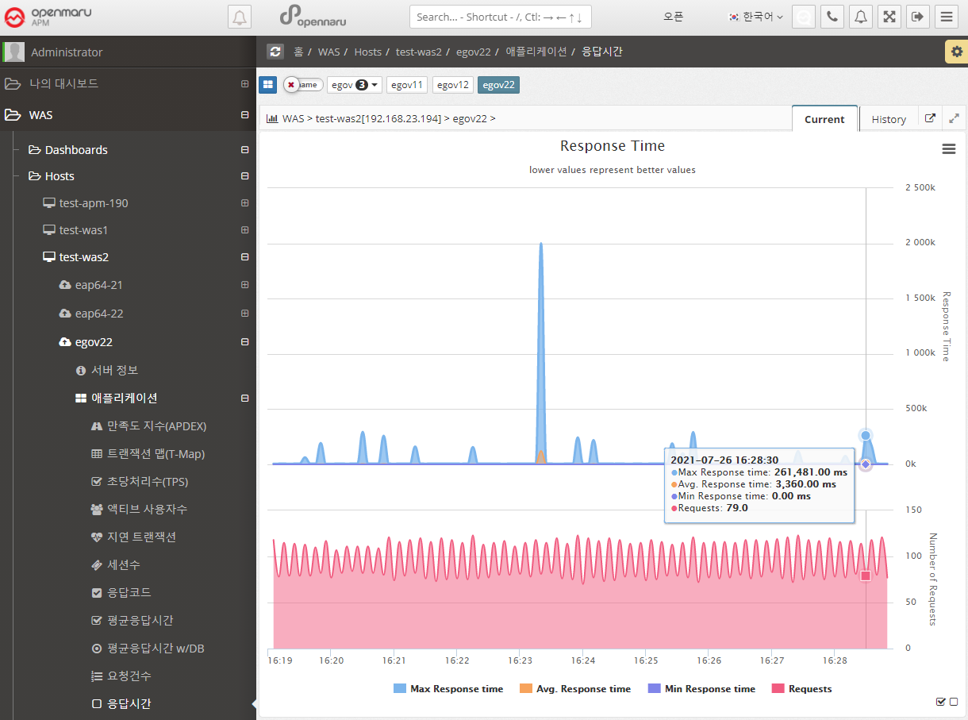
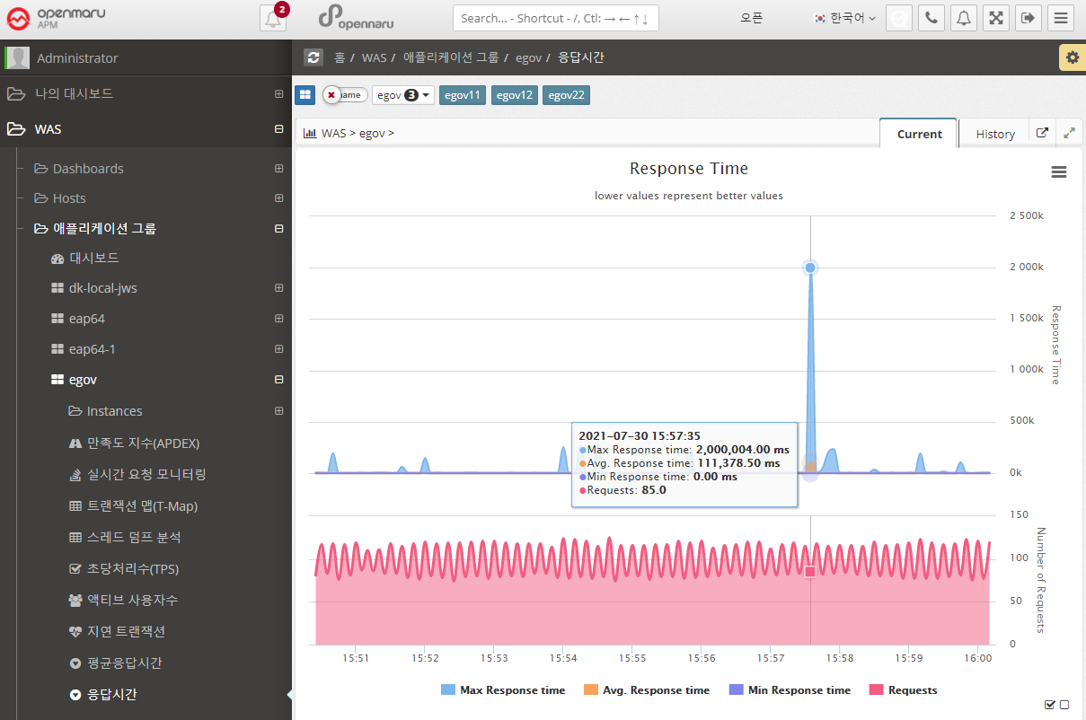
Applications > Response Time
Displays the response time for all WAS instances that make up the business system in a graph with the number of calls, maximum, minimum, and average values.
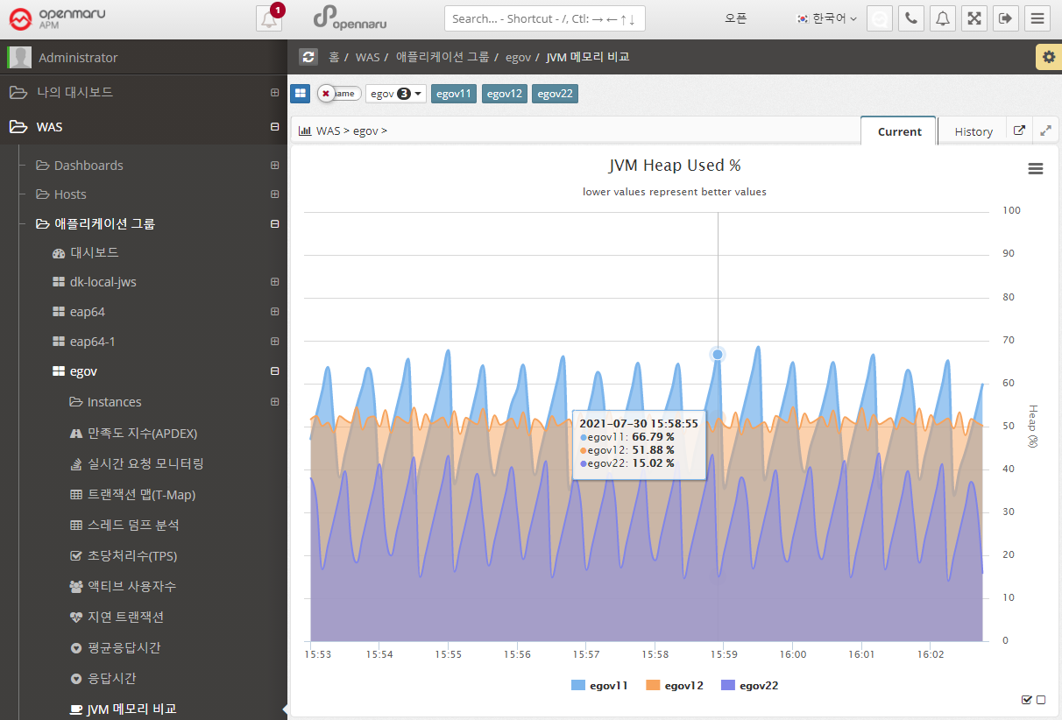
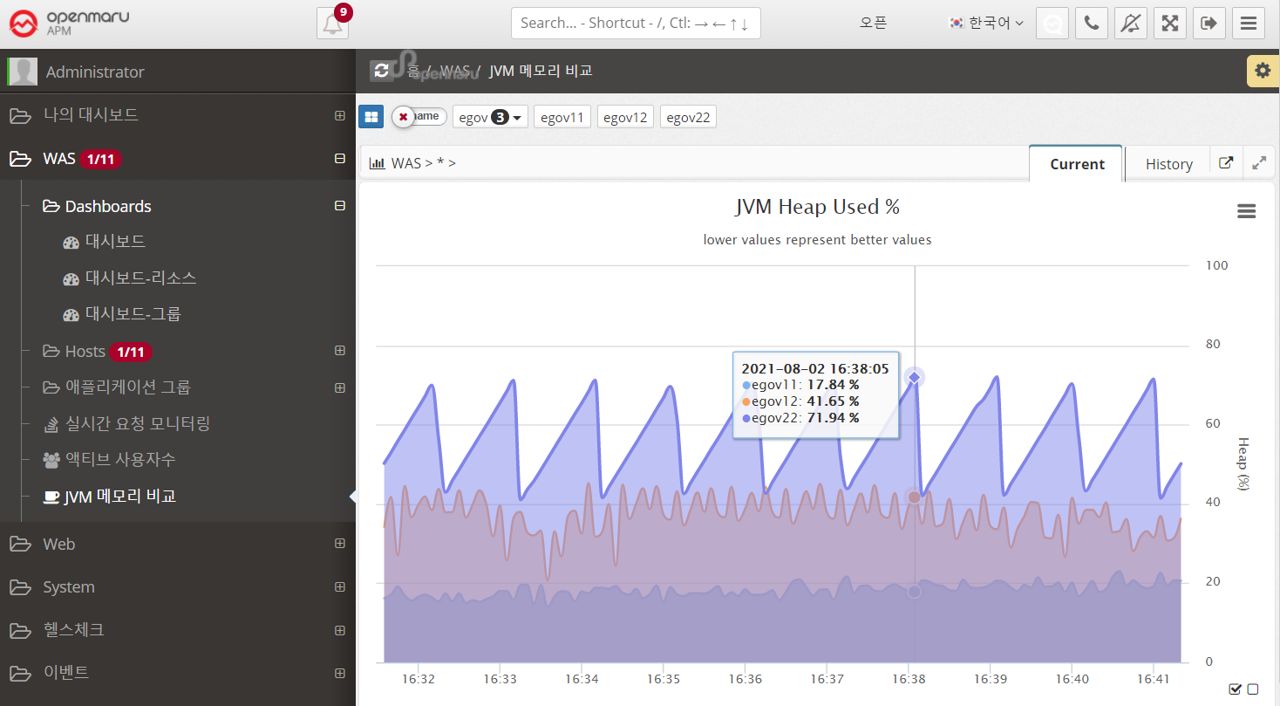
Applications > JVM Memory Comparison
Shows the JVM Heap utilization of all the WAS instances that make up this business system, overlaid for comparison. You can show or hide the graph by clicking on the name shown in the legend of the graph, making it easier to spot instances with memory issues. See "APM Screen Organization and Common Features - Selecting Chart Legends and Exporting Data".
2.2.11 Group by task - Statistics
Statistics > Call statistics
Displays the number of URL calls, SQL query executions, and external calls using HTTP Client by day and hour.
-
When a date is selected as 'Daily/Hourly', the number of daily calls and hourly calls for the month is displayed in a graph with the APDEX index.
-
Displays the URLs with the slowest average response time on that day in a list at the bottom.
-
Displays information such as average response time, number of calls, number of errors, number of satisfaction ratings, and average SQL query execution time for a given URL.
-
You can check the statistics of SQL and HTTP calls made within a URL.
-
See below for how to search for a specific date, time, or URL.
![]()
-
You can search by selecting a date range.
![]()
-
You can check the transaction trace information for the URL.
-
For SQL or HTTP calls, the URL where the query was executed is also displayed.
Statistics > Search for slow URLs
You can search for slow URLs for a job to see which URLs are slow. The usage is the same as "Statistics by WAS Instance - Search for Slow URLs", but this will output information for all instances that make up the job.
Statistics > Error Rate
Summarizes and graphs the error rate for all WAS instances that make up the job system.
The error rate is calculated and displayed as the sum of the number of requests with HTTP Status codes of 40x, 50x, and 100x out of the total number of requests.
Statistics > Error Statistics
Displays hourly and daily graphs of errors in the workgroup. The information is categorized by the domain name that the user accessed by typing in their browser, and shows 400 and 500 errors separately.
For example, if your WAS instance serves more than one domain name, you can see which domain name users are accessing and using to get errors.
You can select a date to view hourly error statistics for that day.
If you select the 'Daily' tab, you can see error statistics for each day of the month.
Also, if you want to see the details of the specific error that occurred, you can click on the bar to see the detailed transaction information for the error.
2.2.12 WAS All
Displays information that is common to all monitored WAS instances.
Real-time request monitoring
This is a graphical representation of real-time request monitoring by task, as shown in the dashboard. For detailed usage, see Request Velocity Chart.
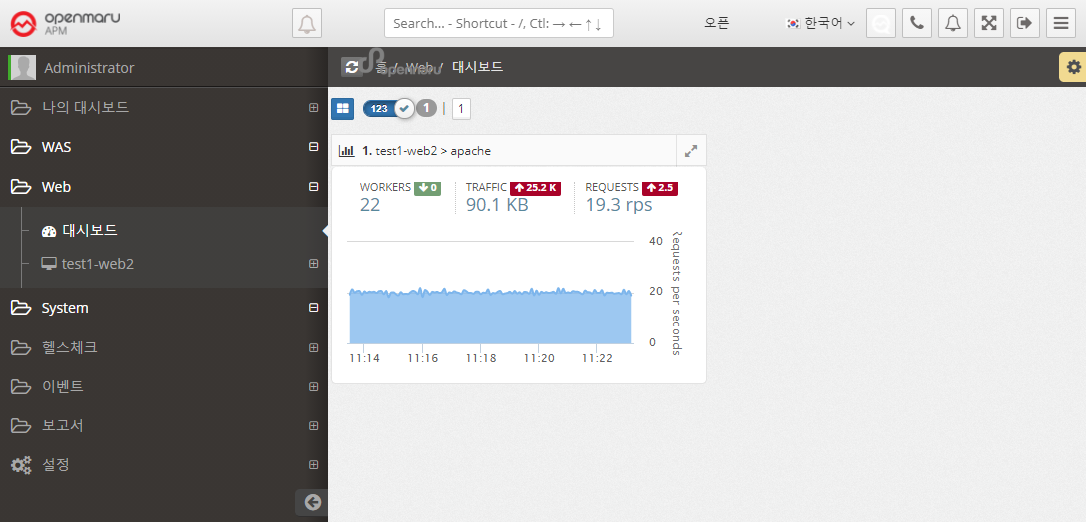
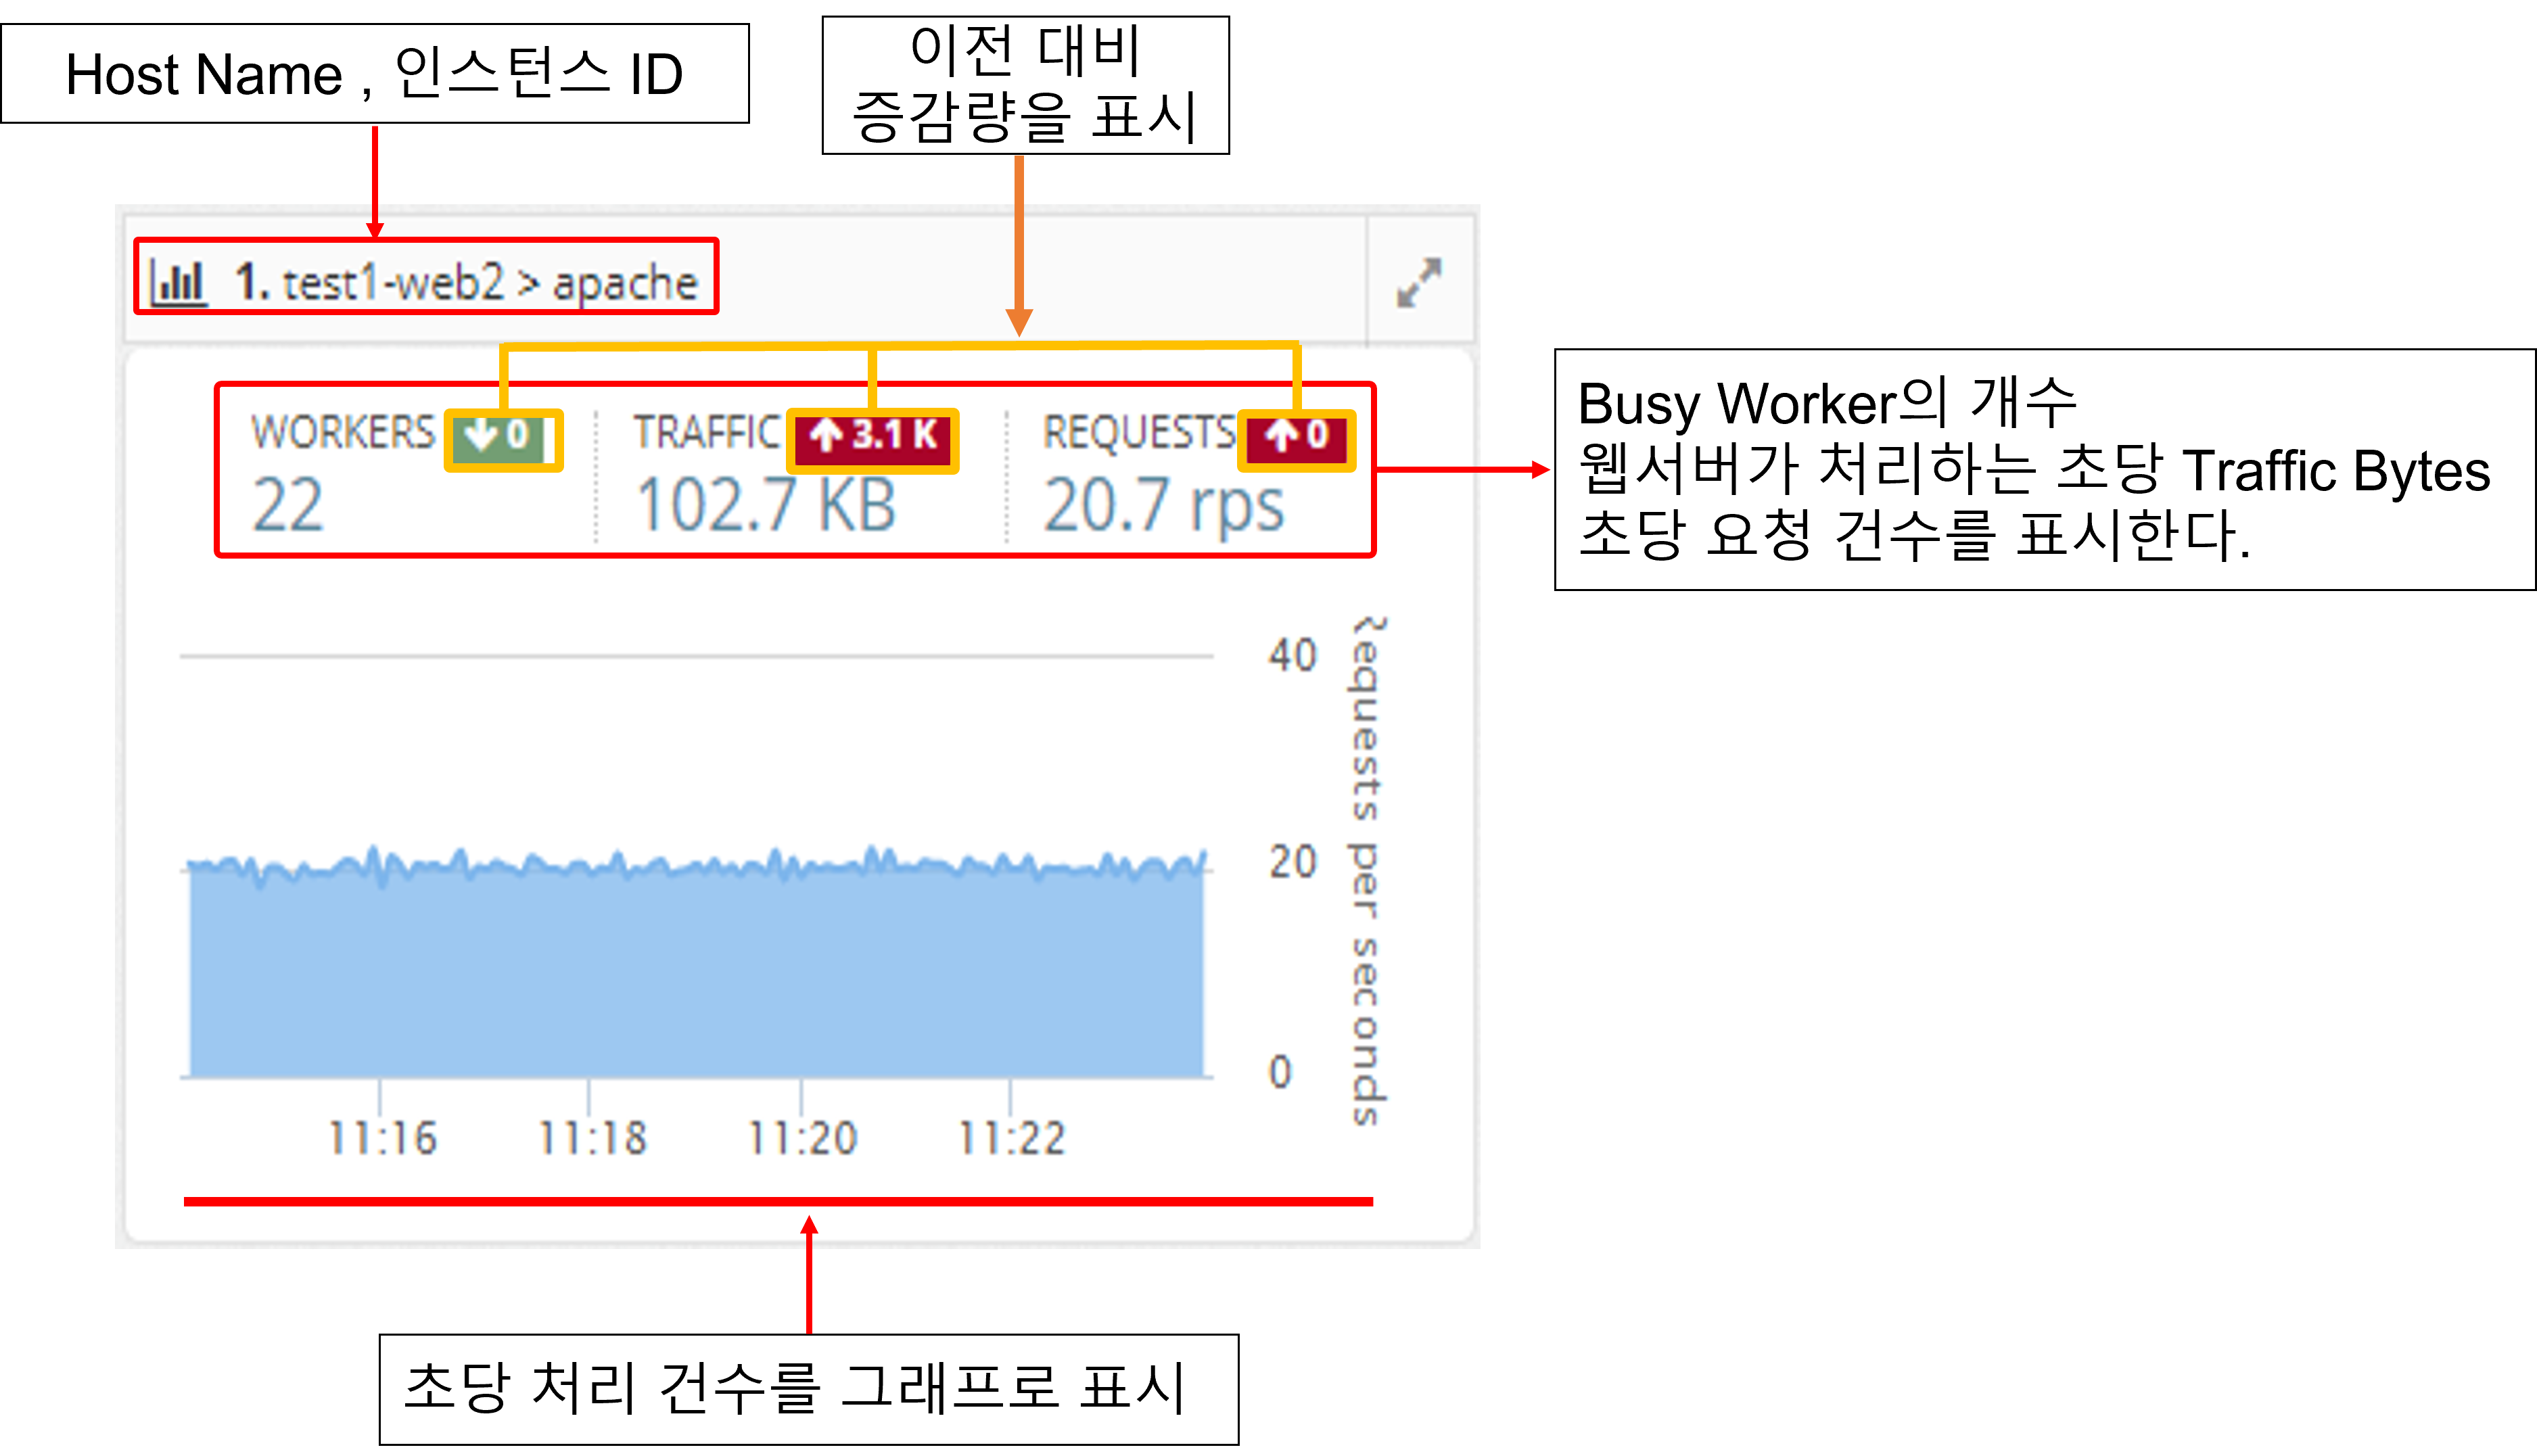
2.3.1 Web Server Dashboard
Collect web server information through the Apache/Nginx Plugin in the System Agent on the machine where the web server is installed.
It displays a dashboard of web servers by monitoring the number of processes per second, the amount of traffic transferred per second, and the status of worker threads.
2.3.1 Web Server Monitoring
Web server information is collected through the Apache/Nginx Plugin of the System Agent, which is installed separately. It collects the traffic of the web server, requests per second, the number of Idle and Busy states of the worker, and the status information of individual connections and displays them in a graph.
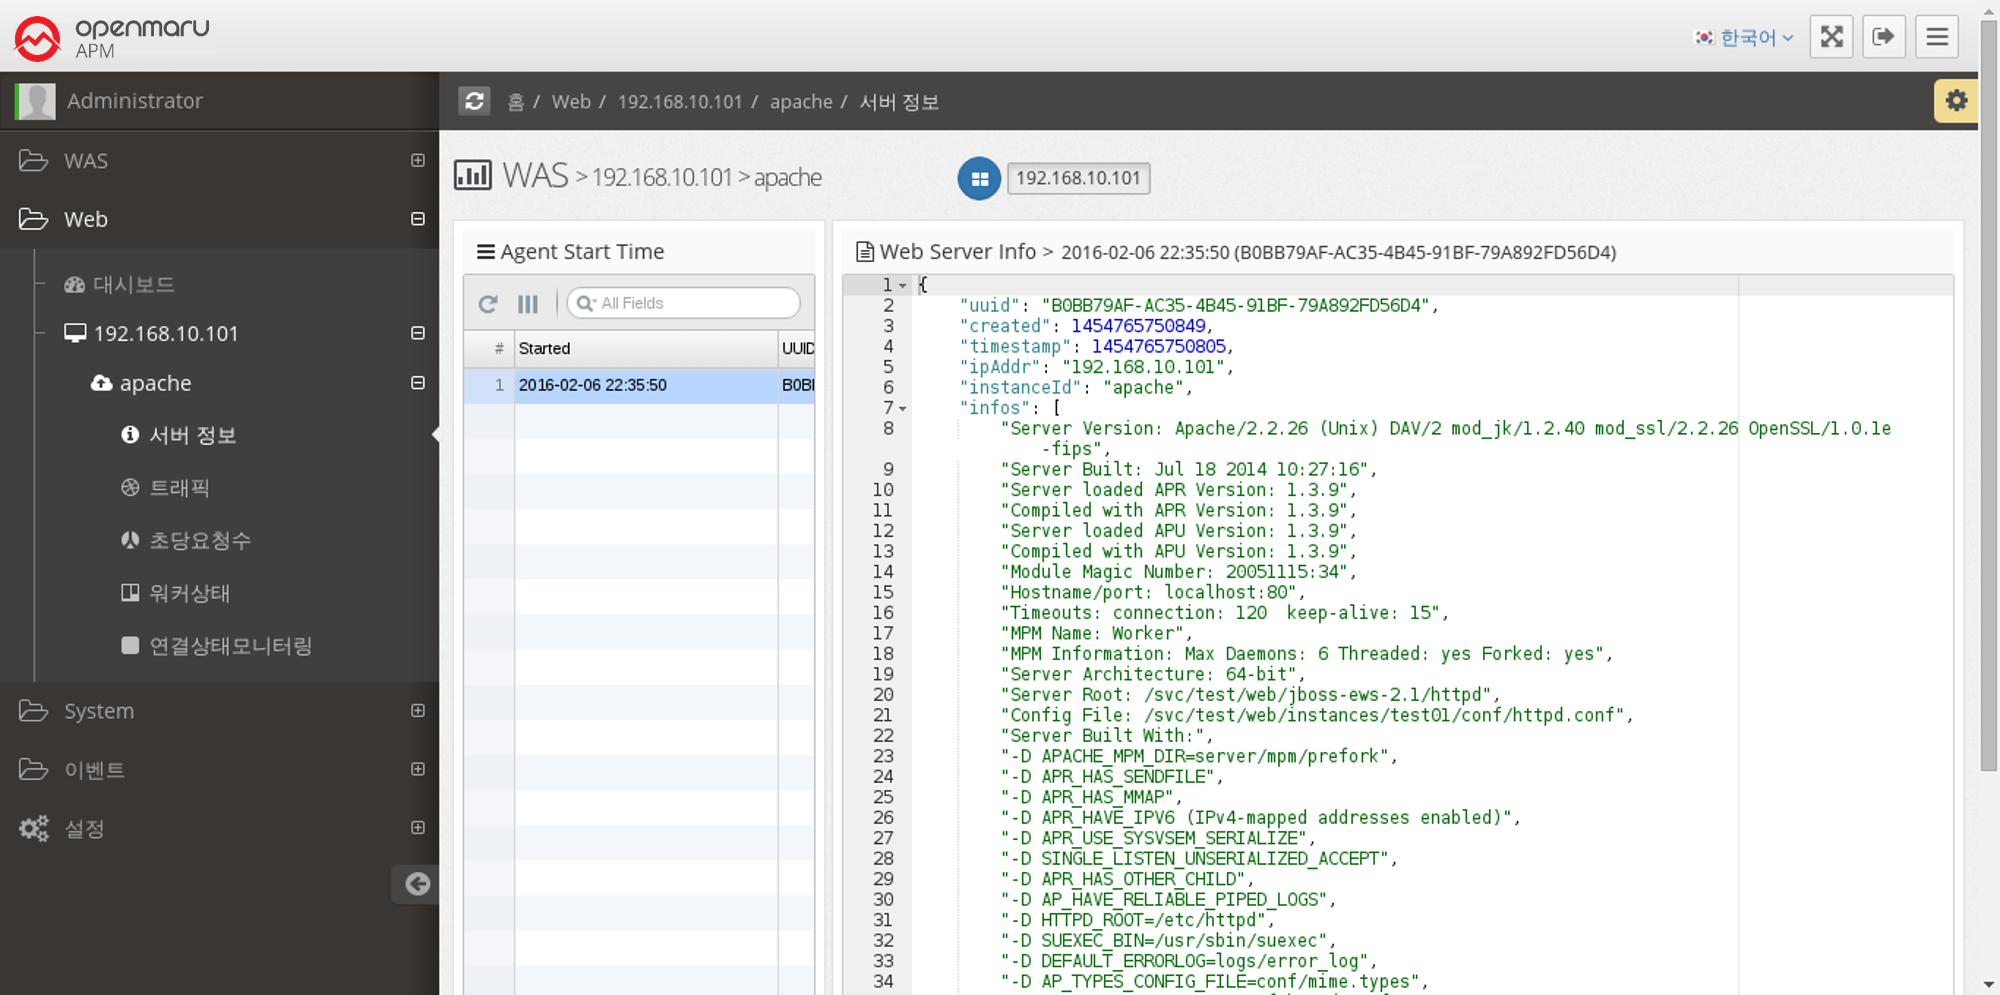
Web Server > Server Information
When the System Agent starts, it collects and stores information about the web server. It collects and displays the installation location of Apache/Nginx, the location of configuration files, build options, and version information of subcomponents used.
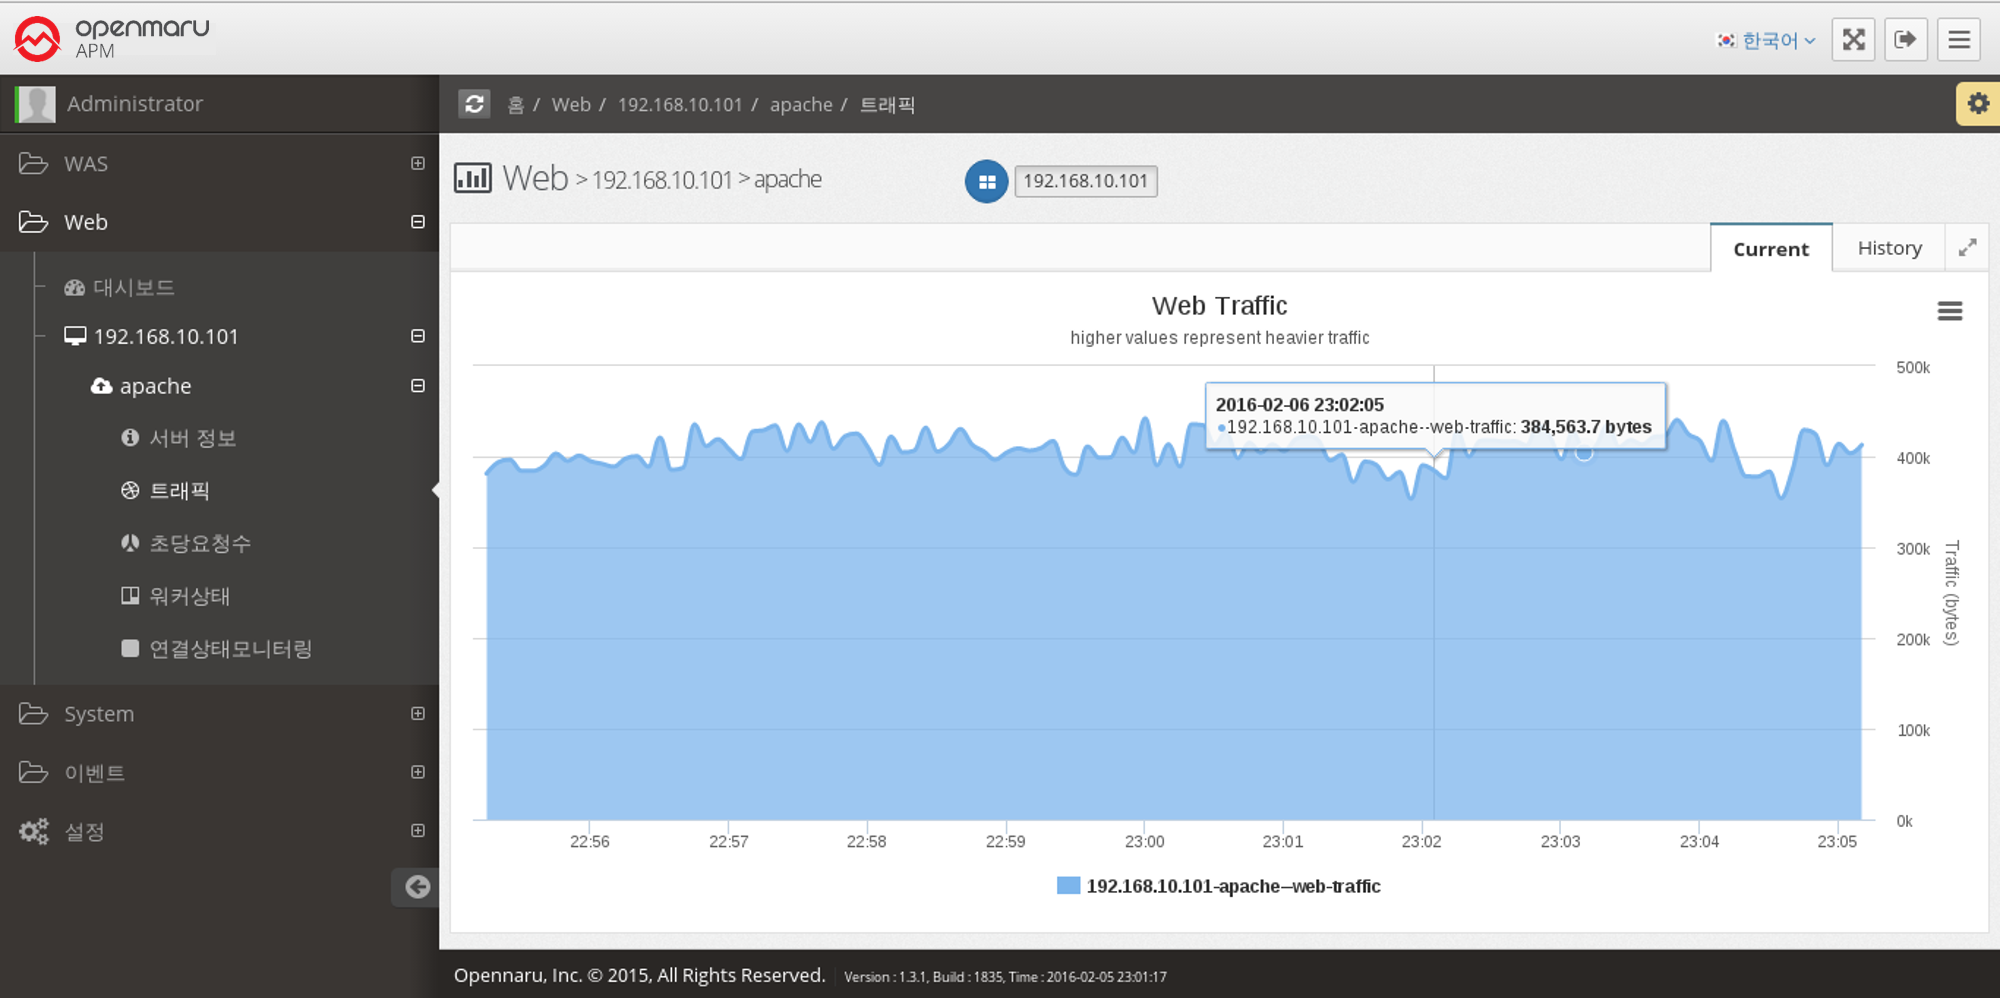
Web Server > Traffic
This graph displays the number of bytes processed by the Apache web server per second.
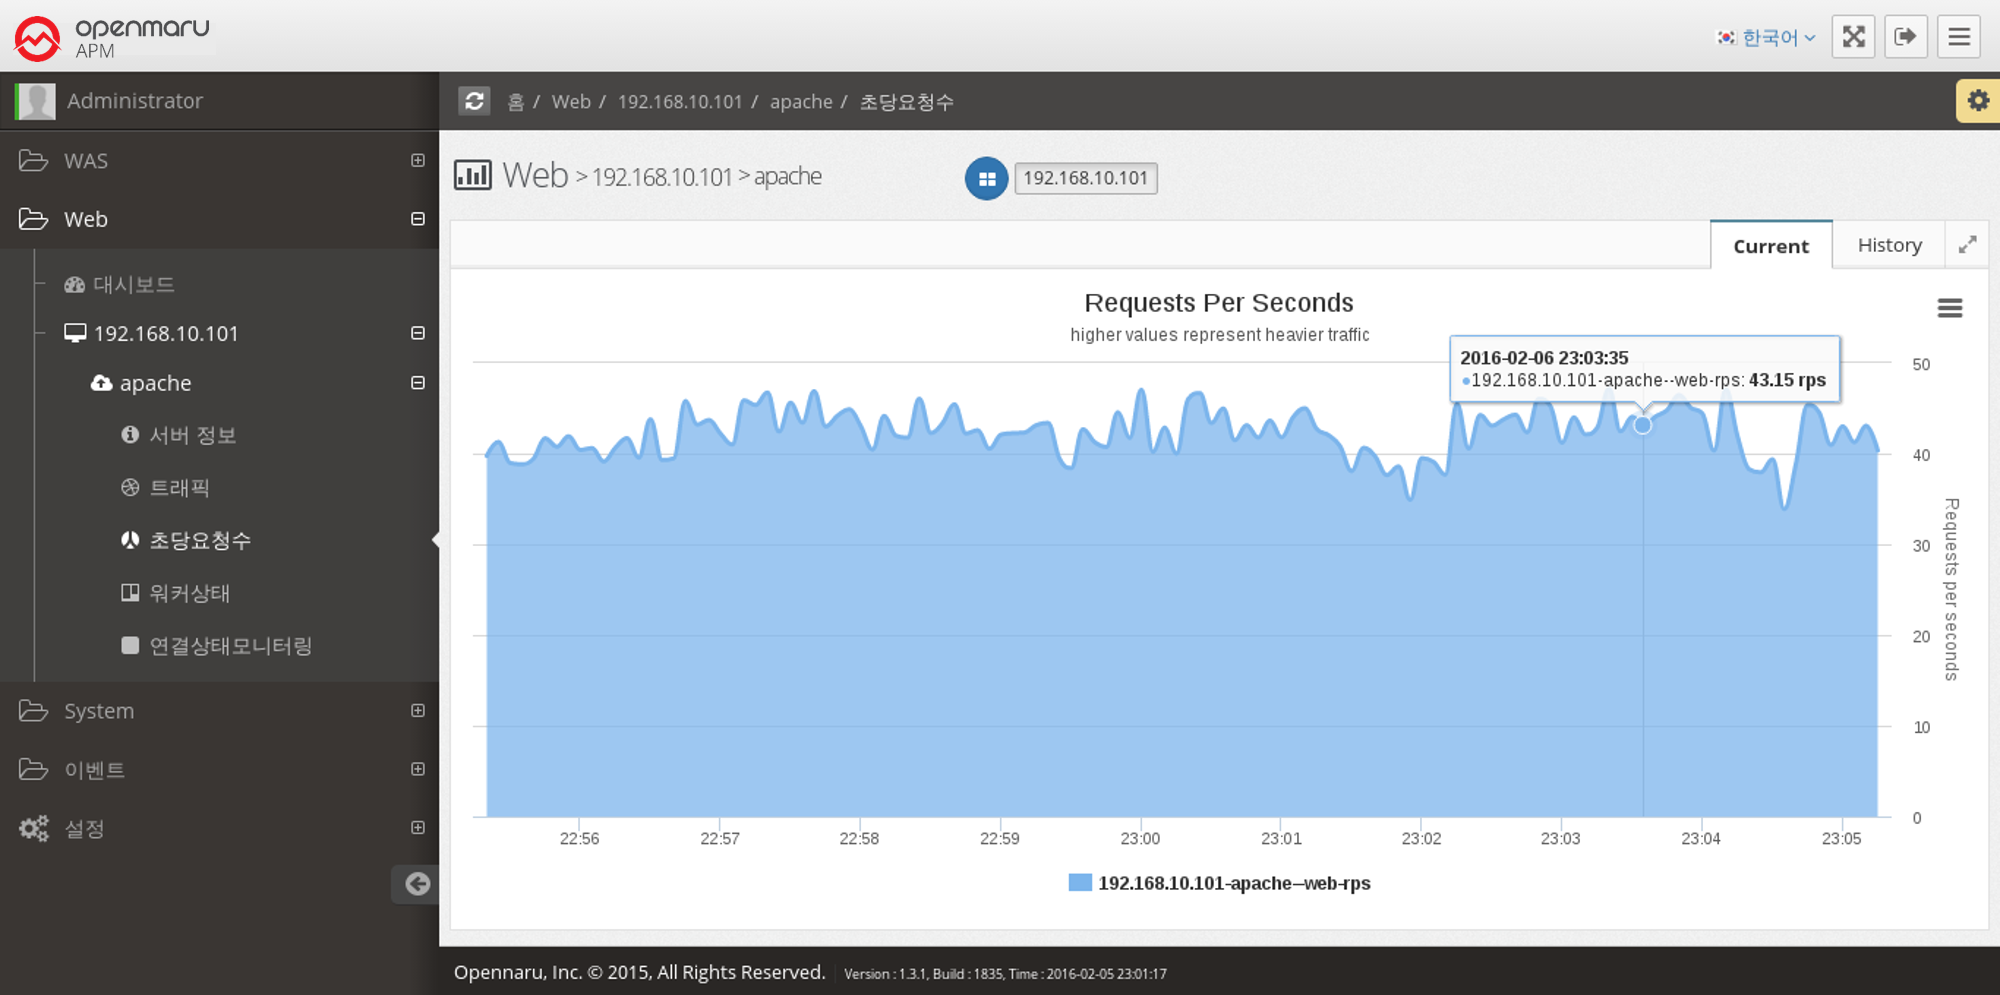
Web Server > Requests Per Second
This graph shows the number of requests the Apache web server serves per second.
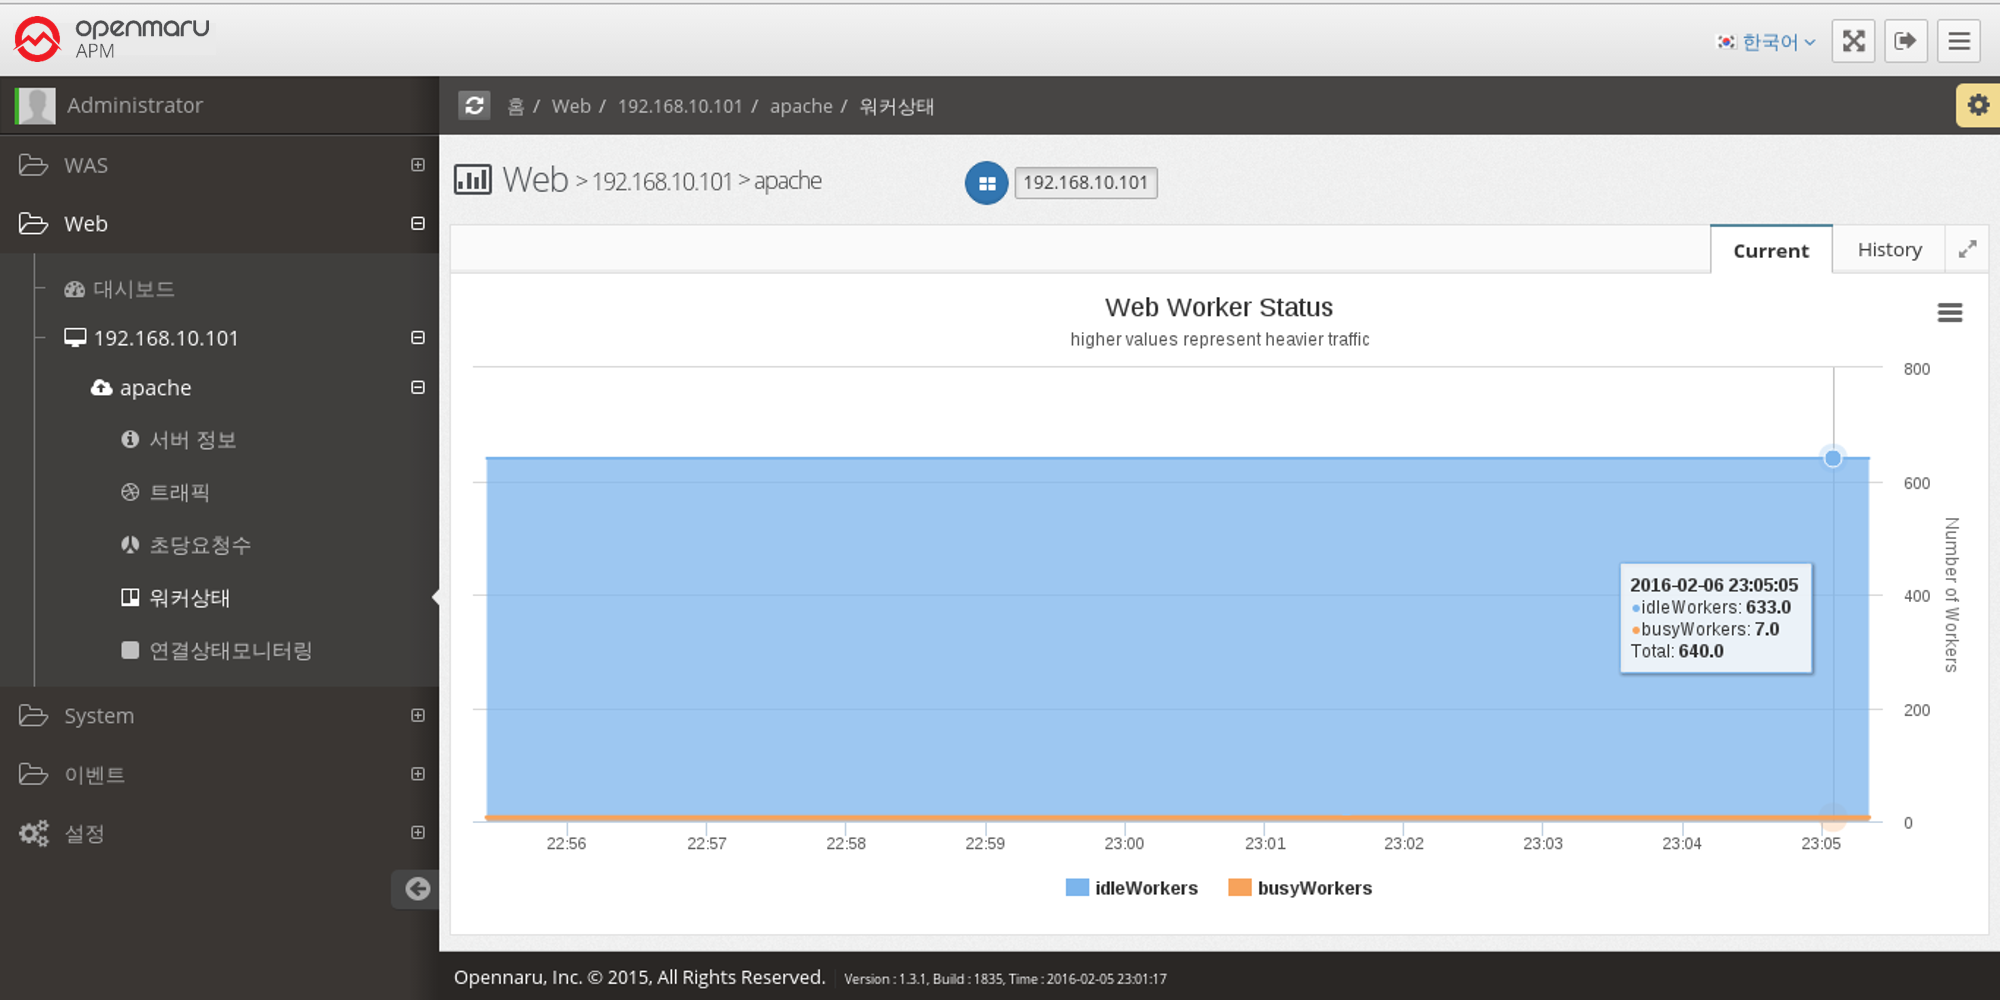
Web Server > Worker Status
This graph shows the number of workers in the Apache web server that are currently processing requests and the number of workers that are idle.
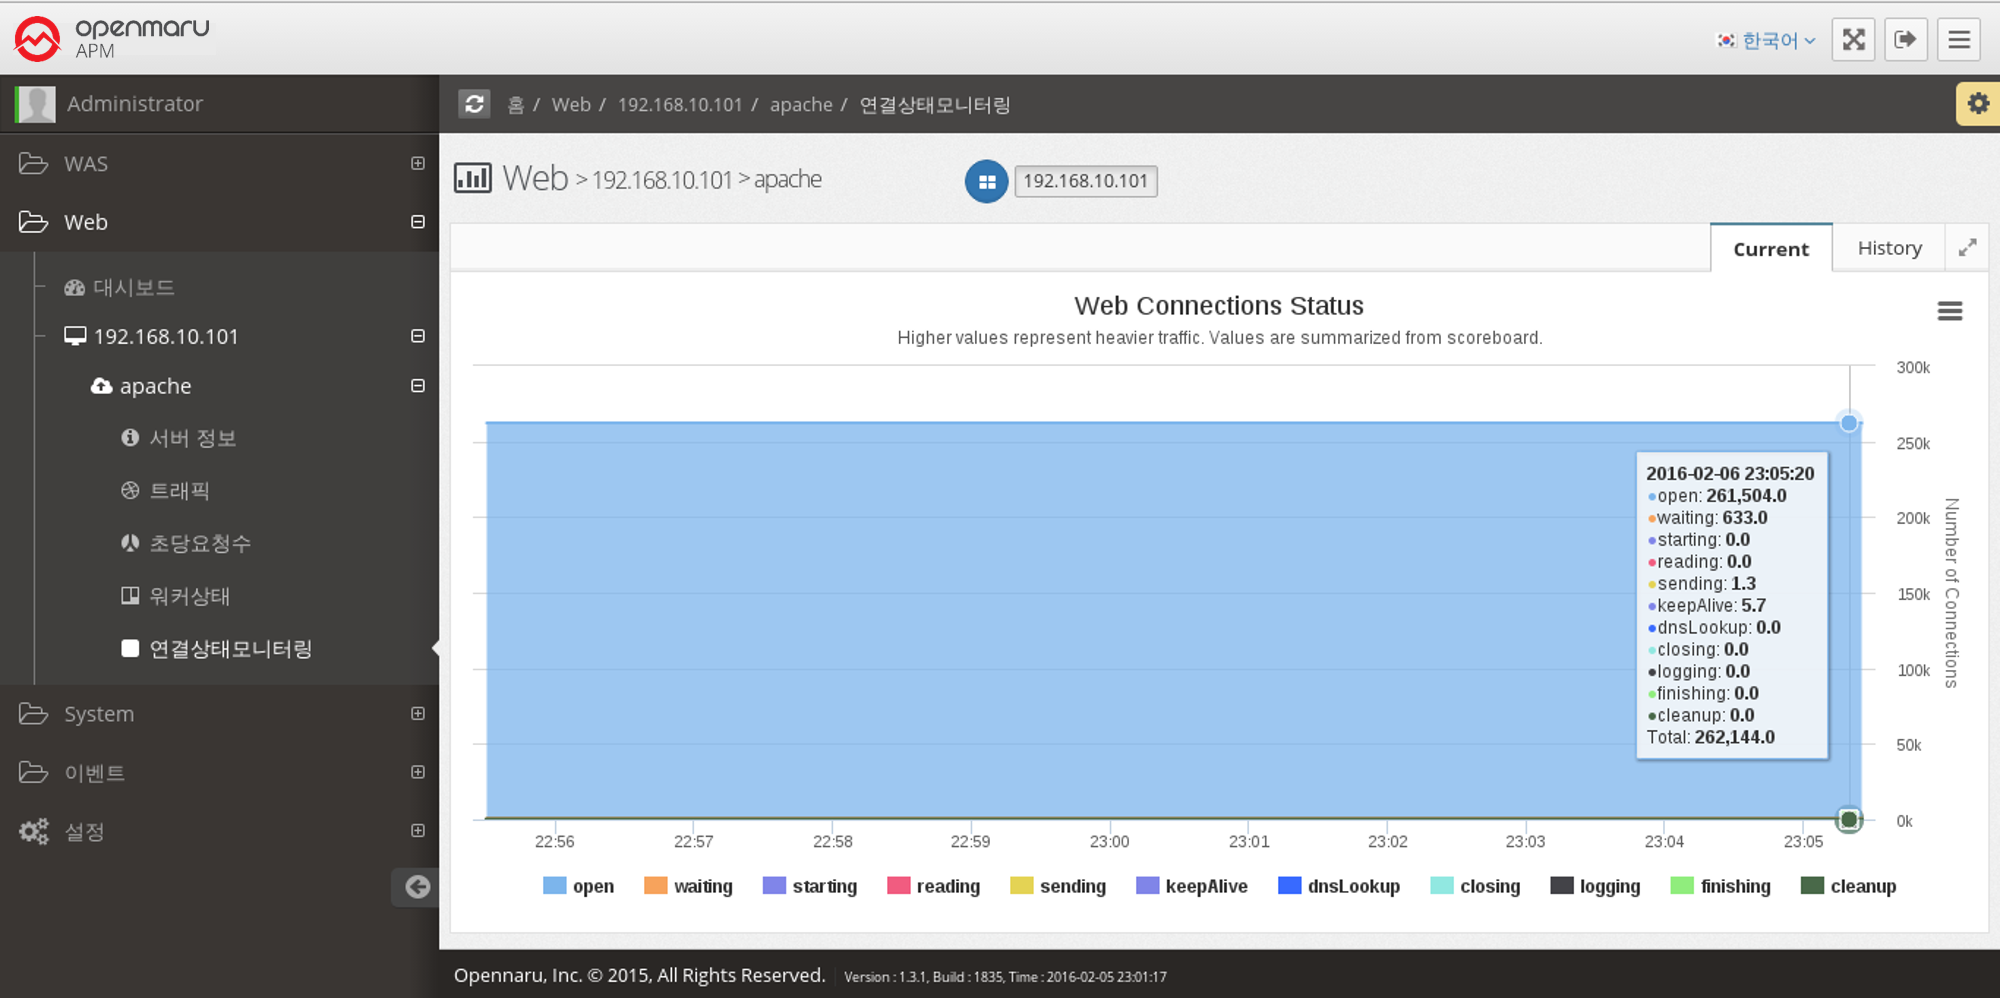
Web Server > Monitoring Connection Status
Displays a graph of the work currently being done by each of the connections on the Apache web server, categorized by the following items.
| Item | Description |
|---|---|
Open |
No requests are currently being processed |
Waiting |
Waiting for a connection |
Starting |
Starting |
Reading |
Reading the request |
Sending |
Sending a response |
KeepAlive |
Keep Alive status |
DNSLookup |
DNS lookup in progress |
Closing |
Closing the connection |
Logging |
Logging |
Finishing |
Gracefully closing the connection |
Cleanup |
Cleaning up the Idle Worker |
Web Server > HTTP Response Code Monitoring
Analyze and display the response code based on the web server Access log file.
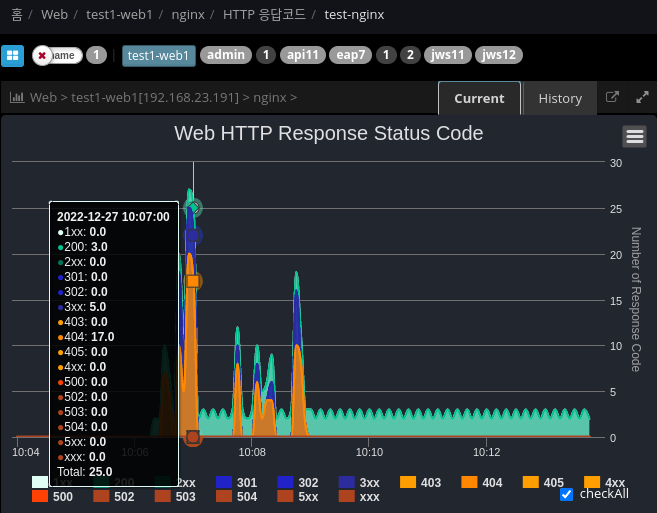
## /plugins/khan-plugin-apache.conf/config.properties
## /plugins/khan-plugin-nginx.conf/config.properties

## Specify the directory where the file is located
## Index with response codes separated by spaces
http.status.code.log.dir=test-nginx:/var/log/nginx:8

## Request URL patterns to exclude
http.status.code.log.exclude.url.patterns=\\*/,/status,/server-info,/jkstatus
## File patterns to exclude
http.status.code.log.exclude.file.patterns=^error.log$,.*.gz
2.4.2 DBMS Monitoring
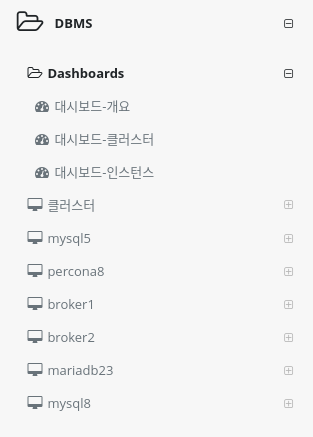
Menu Configuration
Dashboard
You can collect important items of monitoring indicators and check them in real time on one screen.
Cluster - Instance Groups
You can check the metrics of database instances in the same group, such as HA configuration, on one screen.
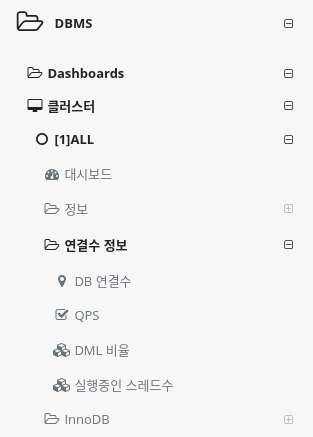
You can set up a cluster using the System Agent MySQL Plugin settings or the user cluster setting method in Application Group Management. +]
How to install System Agent MySQL
How to set up a user cluster
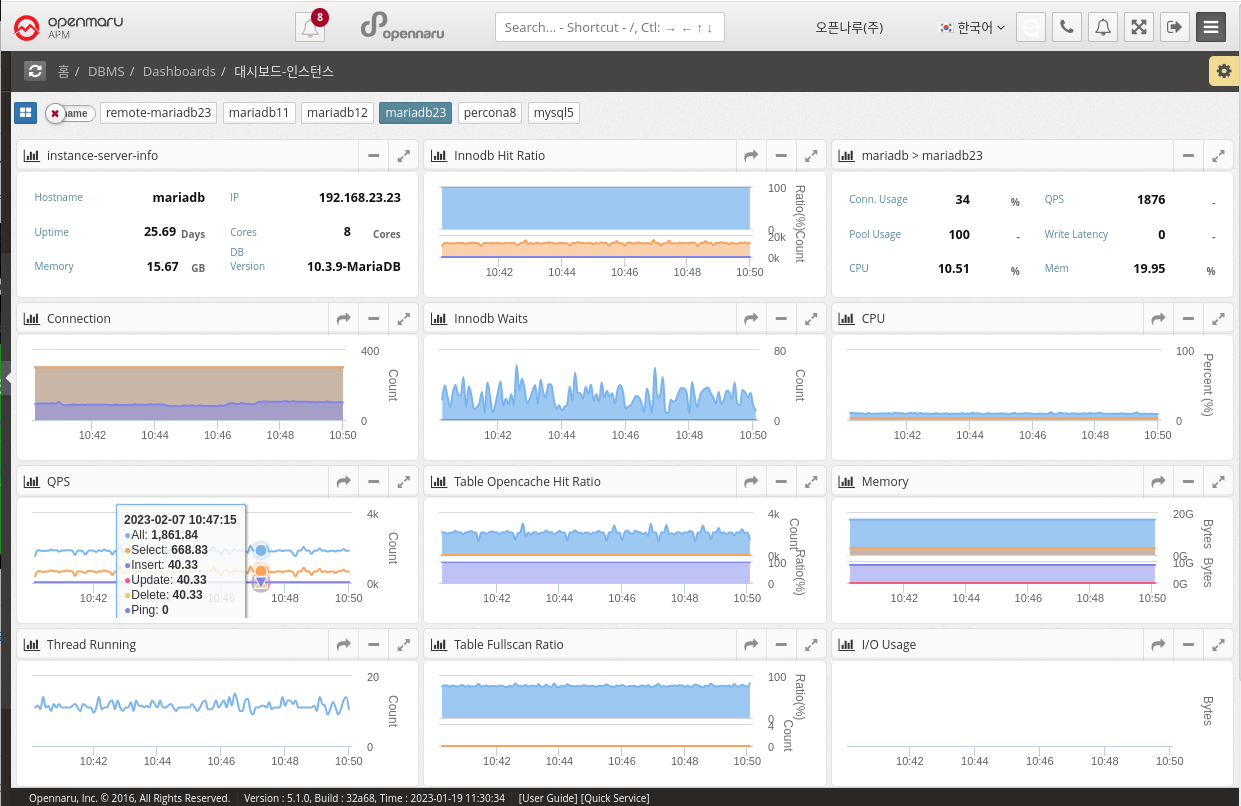
Single Database Instances
Displays a list of single database instances in the Metrics metrics menu.
The instance name can be specified in the System Agent MySQL Plugin settings and cannot be duplicated.
How to install System Agent MySQL
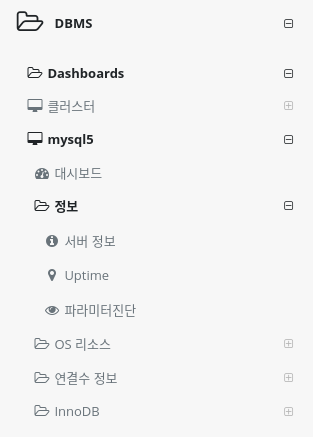
2.4.2 DBMS Dashboard
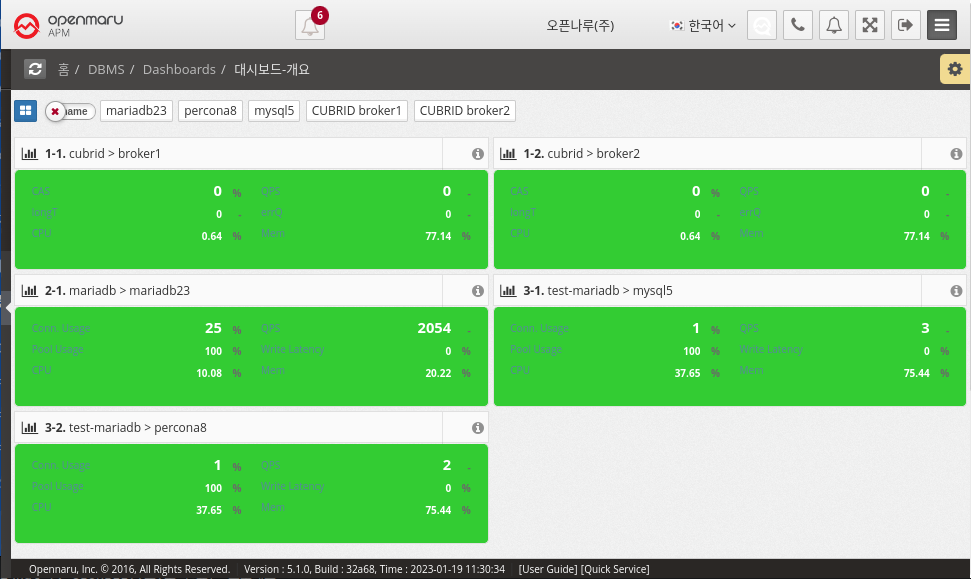
Dashboard - Overview
It collects information through MySQL (mysql, mariadb, percona) and CUBRID Plugin in System Agent on the machine where the database is installed or on an external machine. + MySQL How to Install System Agent MySQL
MySQL displays Connection Usage, QPS, Pool Usage, and Write Latency information, and CUBRID displays CAS, QPS, Long Transaction, and Error Queries on the dashboard screen. In the case of OS CPU and Memory, it is information of the machine where System Agent is installed, so it cannot be collected when monitoring a database in a remote location.
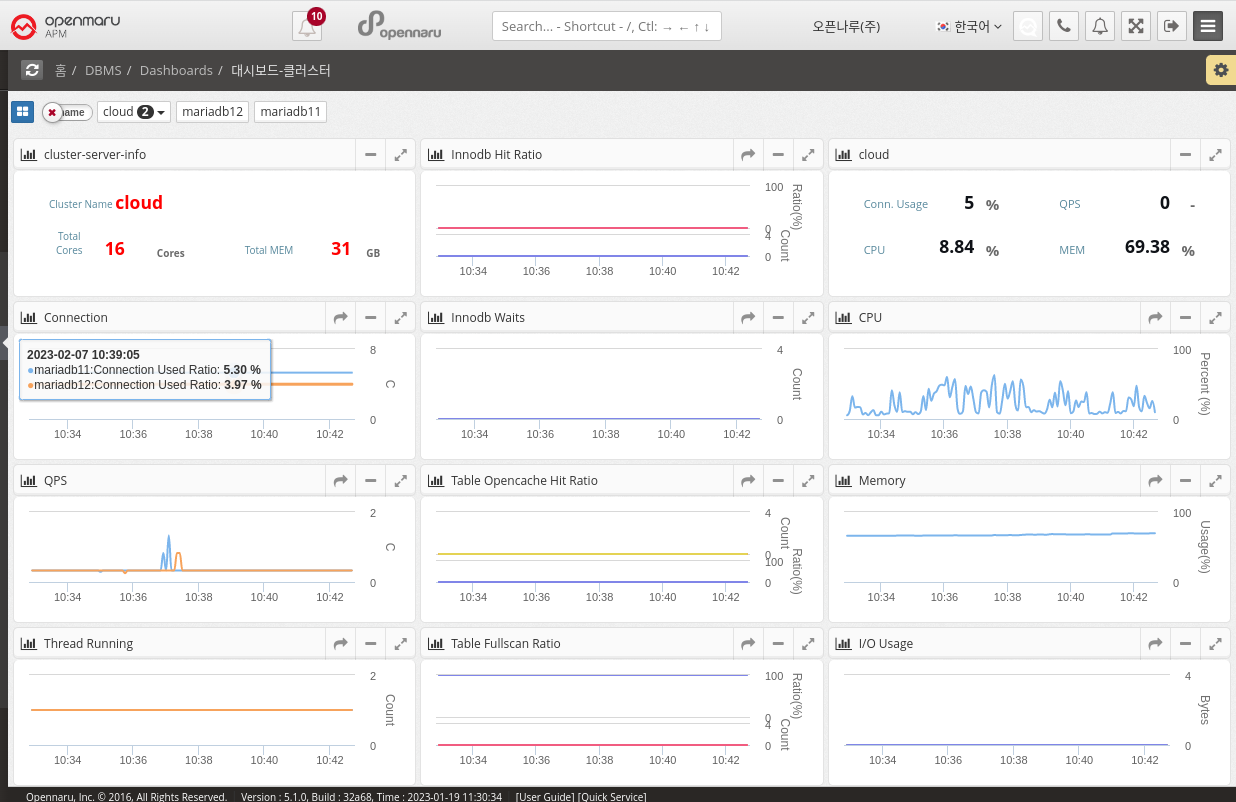
Dashboard - Clusters
This dashboard displays the monitoring items of a MySQL (mysql, mariadb, percona) Database cluster. Clusters can be grouped in the System Agent Mysql Plugin settings or customized in Application Group Management. Displays database cluster information and various metrics such as total resources and QPS on one screen. How to set up a user cluster
2.4.5 DBMS Monitoring: Connections
Number of DB connections
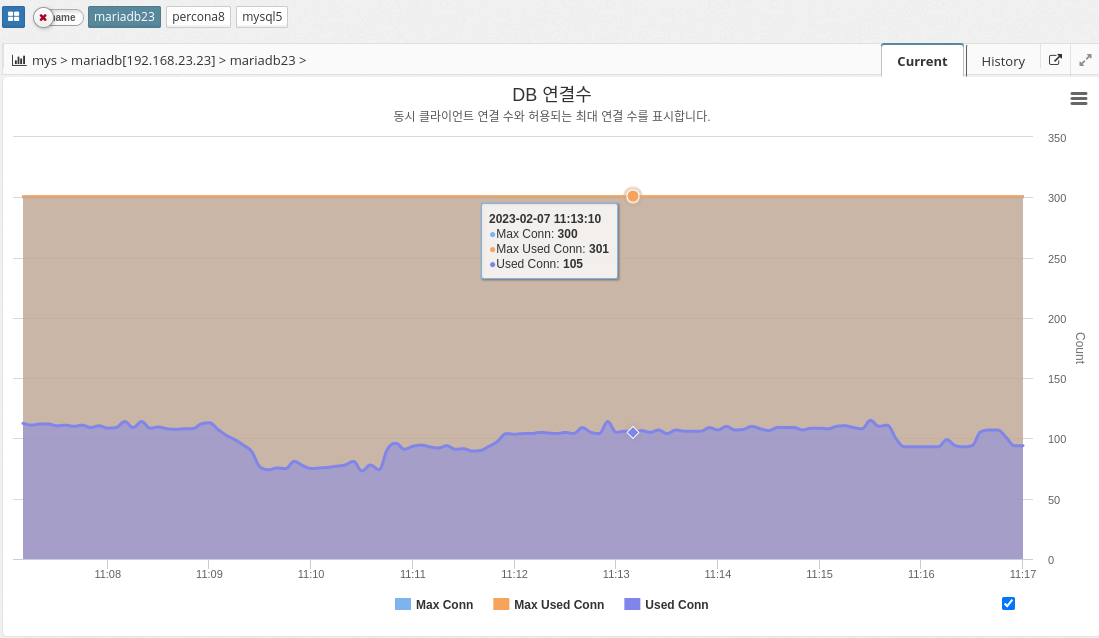
MAX_CONNECTIONS: The maximum number of concurrent connections to the MySQL server allowed. When this limit is reached, all new incoming connections are rejected until some of the existing connections are closed. This value can be set in the my.cnf file, or by using the "SET GLOBAL max_connections" command: +. In practice, Max Connections + 1 client connections are allowed. Additional connections are reserved for use by accounts with SUPER privileges, such as root.
MAX_USED_CONNECTIONS: A variable that indicates the maximum number of connections used since the MySQL server was started.
THREADS_CONNECTED: A variable that indicates the current number of connections to the MySQL server. If the number of connections is equal to the maximum number of connections, new connections are denied until some of the existing connections are closed.
To summarize, MAX_CONNECTIONS sets the limit on the number of concurrent connections that can be made to the MySQL server, MAX_USED_CONNECTIONS indicates the maximum number of connections used so far, and THREADS_CONNECTED indicates the current number of connections to the server.
QPS
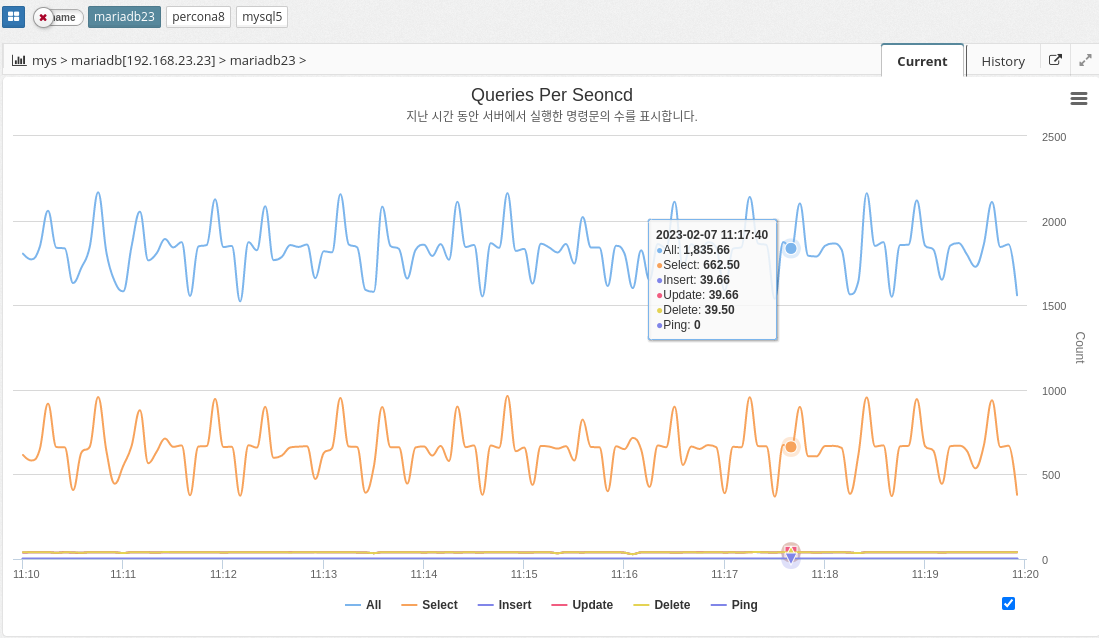
Queries per second (QPS) is a measure of the number of database queries running on the MySQL server in a given amount of time (typically one second). It is a useful metric for monitoring the performance and capacity of a MySQL database because it provides a way to track the workload and demand on the database server.
A high QPS indicates a high level of traffic to the database, which can affect the server’s performance and ability to handle workloads. On the other hand, a low QPS can indicate that the database is underutilized or that the application is not generating enough traffic.
The parameter information used is shown below.
-
QUERIES
-
COM_SELECT
-
COM_INSERT
-
COM_UPDATE
-
COM_DELETE
-
COM_PING
DML ratios
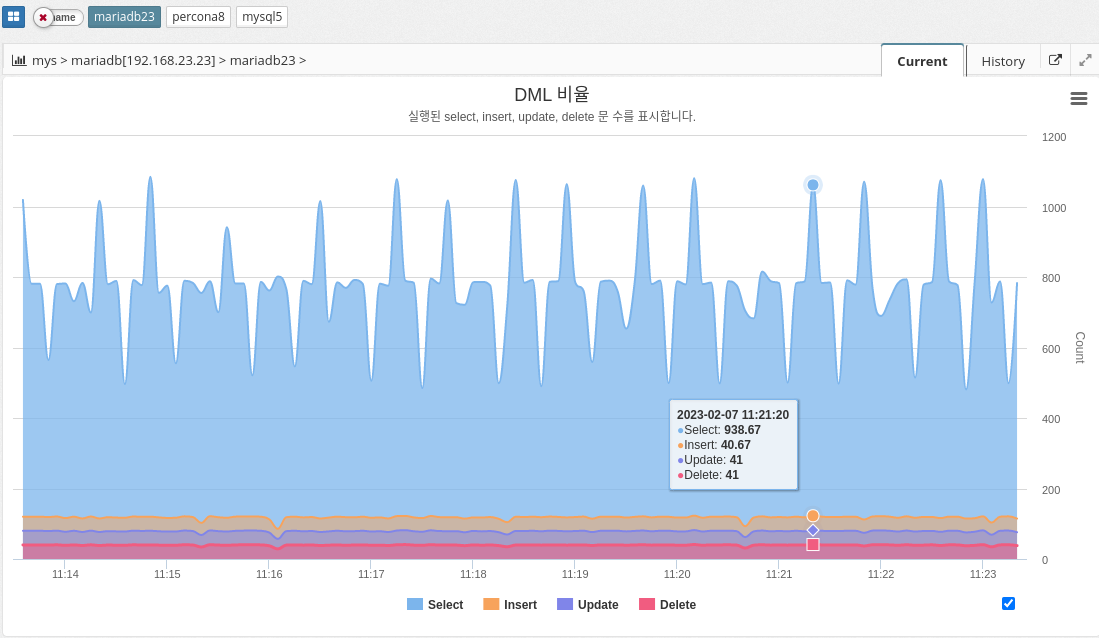
The DML ratio, or data manipulation language ratio, indicates the ratio of data manipulation language (DML) statements to the total number of statements executed in a MySQL database. DML statements include INSERT, UPDATE, and DELETE statements, which are used to modify data stored in the database. The DML ratio is an important metric to monitor in a database because it provides a way to understand the types of statements being executed and the balance between reading and writing data. A high DML ratio can indicate that the database is being heavily modified, which can affect the performance and responsiveness of the database.
The DML ratio is an important metric to monitor in a database because it provides a way to understand the types of statements being executed and the balance between reading and writing data. A high DML ratio can indicate that the database is heavily modified, which can affect the performance and responsiveness of the database.
The parameter information used is shown below.
-
COM_SELECT
-
COM_INSERT
-
COM_UPDATE
-
COM_DELETE
Number of threads running
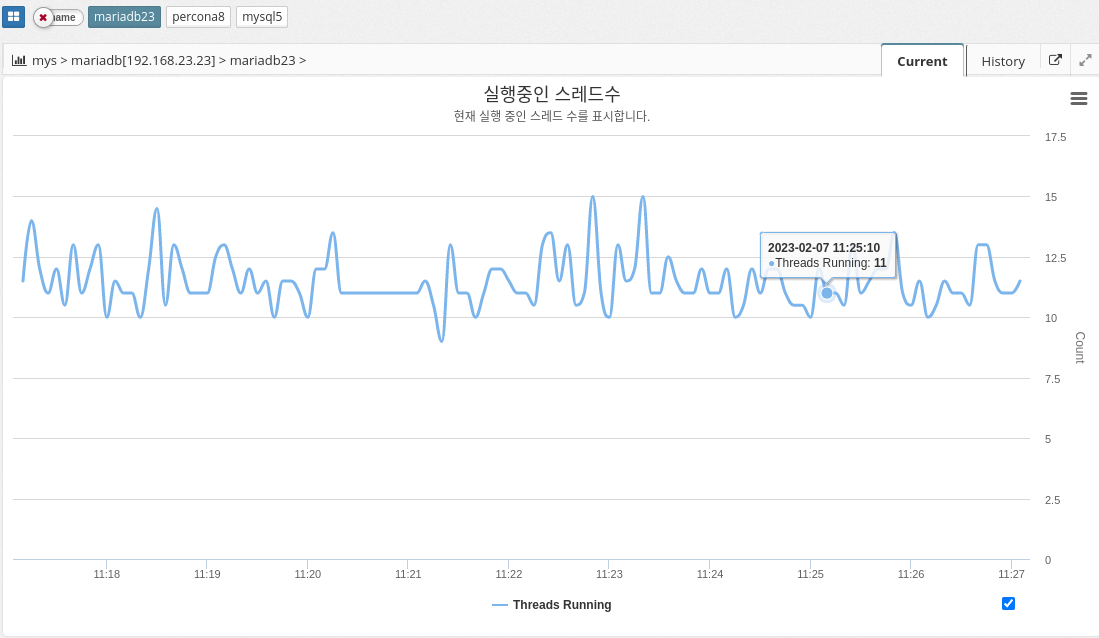
The number of running threads in MySQL indicates the number of active threads, or connections, that are currently executing queries on the database server. Each connection to the database server creates a new thread, and each thread is responsible for executing one or more queries. The Running Thread Count provides a way to monitor the number of concurrent connections to the database and the overall workload on the server.
A high Running Thread Count can indicate that the database is under heavy workload, which can lead to performance issues and slow query response times. A low Running Thread Count can indicate that the database is not being fully utilized or that the application is not generating enough traffic.
It’s important to monitor the Running Thread Count over time and track any changes or trends. This is because it provides a way to understand the overall demand and workload on the database. If the Running Thread Count is consistently high, it might indicate that the database needs to be optimized or scaled to handle increased workload.
The parameter information used is shown below.
-
threads_running
Session Analytics
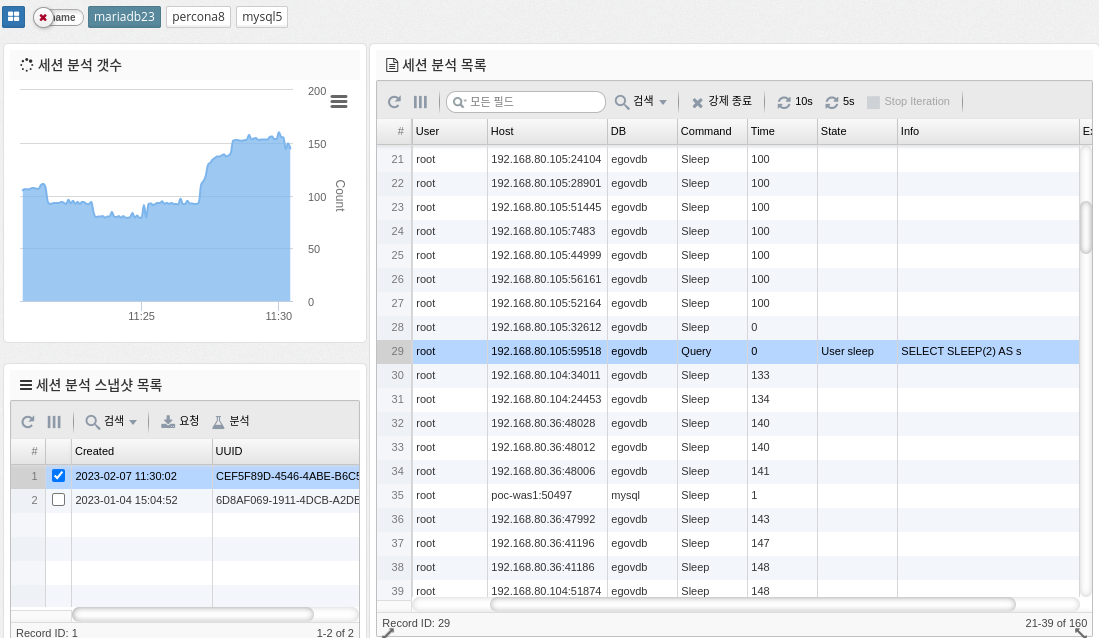
Session analysis in MySQL refers to the process of monitoring and analyzing the behavior of individual user sessions within a MySQL database. This includes analyzing the queries executed in each session, the resources used, and the overall performance of the session. This information can help you identify performance bottlenecks and optimize database performance.
-
Force Terminate: Force terminate the selected session.
| Terminate requires SUPER privileges to work. |
-
10s, 5s : Run requests periodically for the corresponding number of seconds
The parameter information used is shown below.
-
PROCESSLIST_COUNT :
2.4.6 DBMS Monitoring: Inno DB
Buffer pool allocation rate
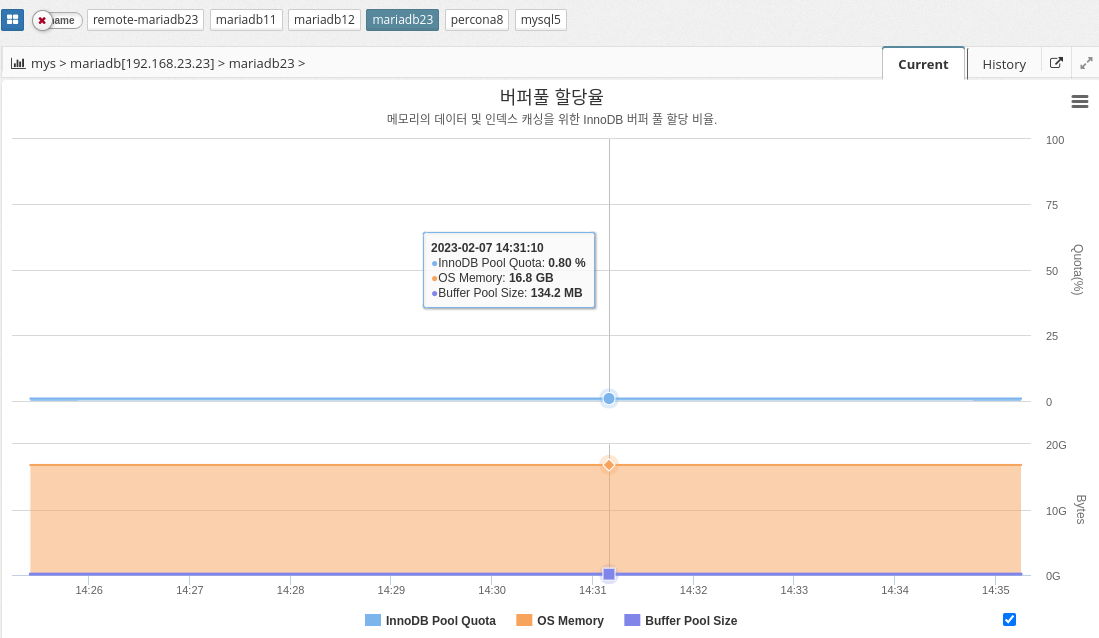
MySQL’s buffer pool allocation percentage indicates the amount of memory allocated to the buffer pool in relation to the total memory available on the system. The buffer pool is the area of memory in MySQL where pages of data are stored, allowing for faster access to data.
The buffer pool allocation percentage is set by the variable "innodb_buffer_pool_size". The default value is 128 MB, but you can change it to a higher value to allocate more memory to the buffer pool and improve performance. The buffer pool allocation percentage is calculated as follows
innodb_buffer_pool_size / total system memory
A higher buffer pool allocation percentage means that more memory is dedicated to the buffer pool and less memory is available for other tasks. A buffer pool that is too large can lead to swapping and poor performance. It is important to find the optimal value for the buffer pool allocation percentage by monitoring the performance of your system and adjusting the value accordingly.
In summary, MySQL’s buffer pool allocation ratio determines how much memory is allocated to the buffer pool to store data pages and improve performance. The optimal value for this ratio can vary depending on the database size and available system resources.
The parameter information used is shown below.
-
Calculation
INNODB_BUFFER_POOL_SIZE / OS_MEMORY * 100
| Enabled if the agent is a host with a DBMS installed. |
Buffer pool hit rate
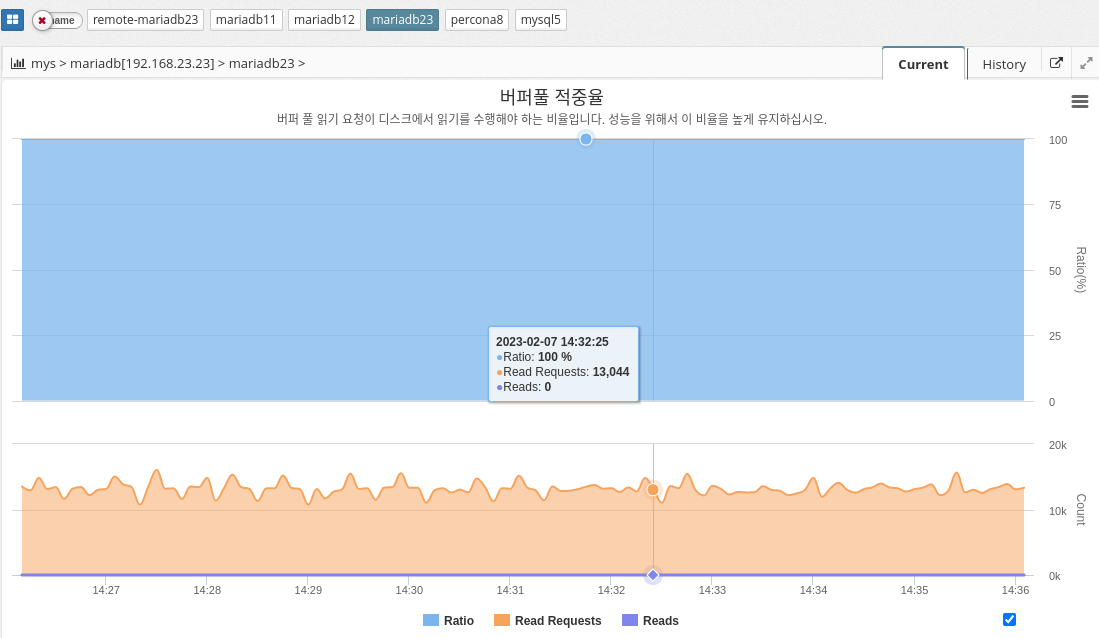
MySQL’s buffer pool hit ratio indicates the percentage of database page requests that are fulfilled in buffer pool memory, as opposed to being retrieved from disk. A buffer pool is an area of memory where frequently accessed data pages are stored for quick retrieval without accessing disk.
A high buffer pool hit ratio indicates that the buffer pool is effectively caching frequently accessed data, which improves performance. On the other hand, a low buffer pool hit ratio indicates that the buffer pool is not large enough to store all frequently accessed data pages, resulting in frequent disk accesses and poor performance.
To optimize the buffer pool hit ratio, administrators can resize the buffer pool to match the amount of available memory and workload requirements. You can also use the innodb_buffer_pool_instances configuration parameter to divide the buffer pool into multiple smaller pools to improve concurrency and avoid performance bottlenecks.
Keep this ratio high for good performance.
The parameter information used is shown below.
-
Calculation
INNODB_BUFFER_POOL_READ_REQUESTS / (INNODB_BUFFER_POOL_READ_REQUESTS + INNODB_BUFFER_POOL_READS) * 100
Buffer pool page
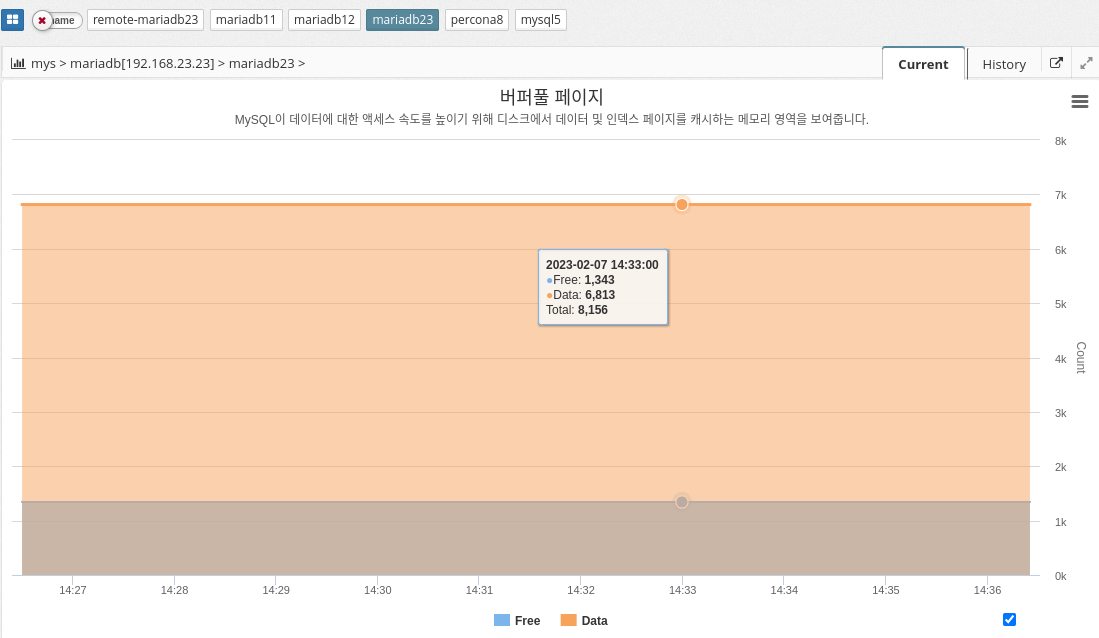
MySQL’s buffer pool is an area of memory used to cache frequently used pages of data to improve performance. When a query is executed, MySQL first checks the buffer pool to see if the required data pages are already in memory. If so, the query can execute much faster because the data pages don’t need to be read from disk. If the required data page is not in memory, it is read from disk and added to the buffer pool.
The buffer pool is divided into multiple buffer pool pages, each of which can store a single data page. You can configure the size of the buffer pool and the number of buffer pool pages to balance performance and memory usage. Larger buffer pools generally provide better performance but consume more memory.
In summary, MySQL’s buffer pool is an important component that helps improve performance by caching frequently used data pages in memory. By configuring the size and number of buffer pool pages, administrators can control the amount of memory used for caching and optimize performance for their specific needs.
IO rate
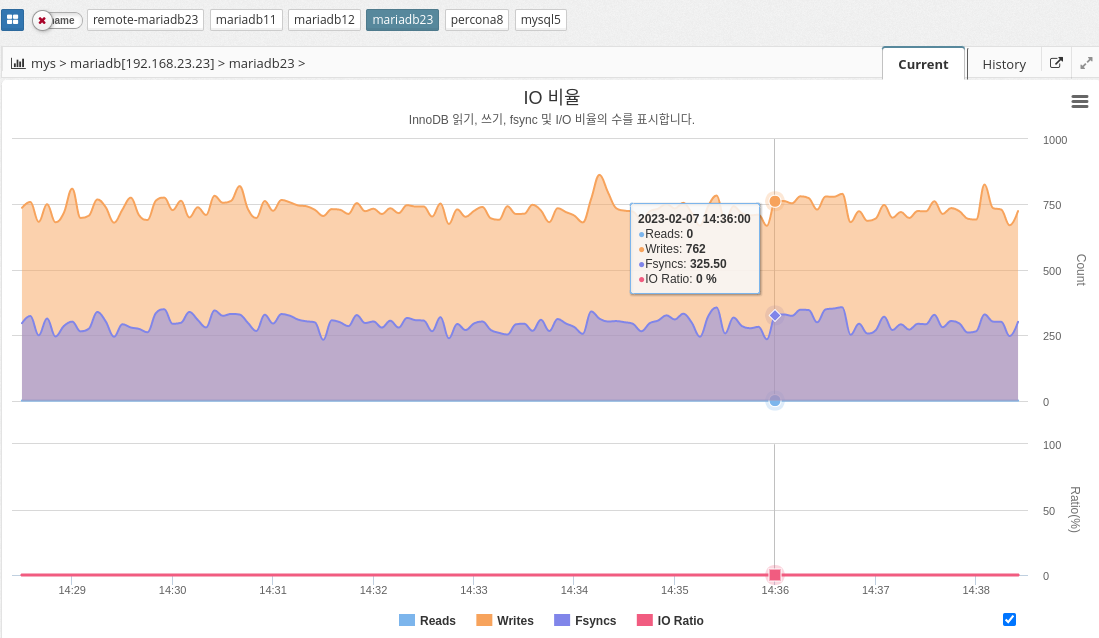
In MySQL, the IO ratio can be measured using various performance metrics such as InnoDB buffer pool hit ratio, query response time, and disk I/O latency. The exact calculation of the IO ratio can vary depending on the specific metric used, but it generally involves measuring the number of disk reads and writes against the number of database operations performed.
In conclusion, it is essential to monitor the IO ratio in MySQL to maintain efficient use of disk resources and optimal database performance.
The parameter information used is shown below.
-
INNODB_DATA_FSYNCS : Number of fsync() operations so far. How often fsync() is called.
-
INNODB_DATA_READS: Total number of data reads.
-
INNODB_DATA_WRITES: total number of data writes
-
Calculate
INNODB_DATA_READS/(INNODB_DATA_READS+INNODB_DATA_WRITES+INNODB_DATA_FSYNCS) * 100
Latency
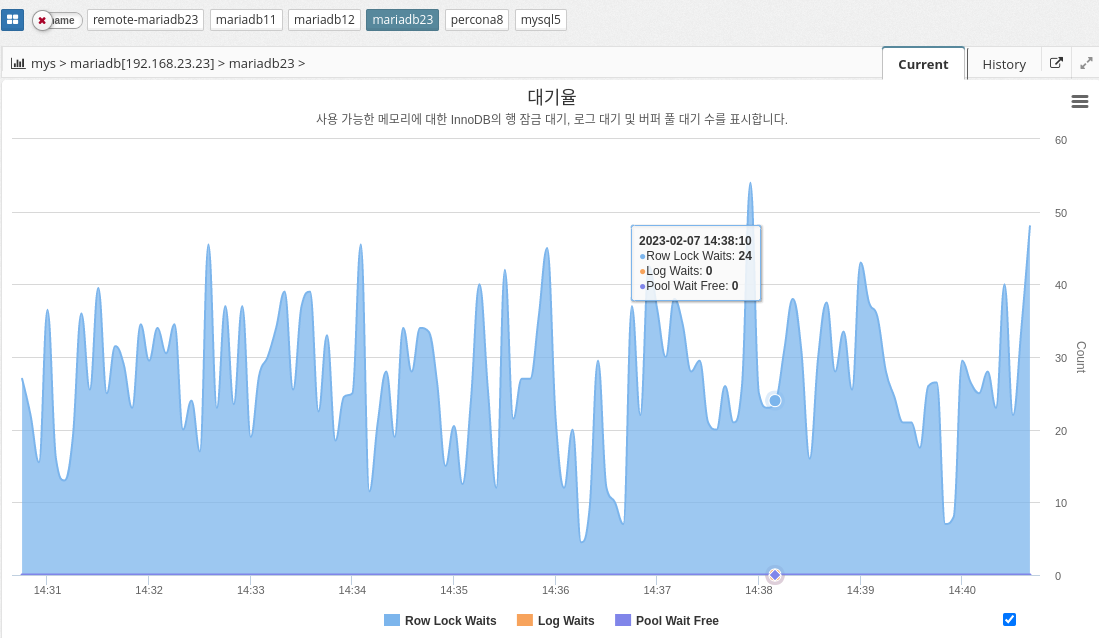
InnoDB wait represents the amount of time a thread in the InnoDB storage engine must wait for a resource to become available before continuing its work. This wait can be caused by a variety of factors, such as lock contention, disk I/O, or memory allocation.
InnoDB wait can affect the overall performance of the database because it delays query and transaction processing. It is important to monitor and identify the root cause of InnoDB wait and take appropriate action to reduce or eliminate it.
There are several common InnoDB waits that database administrators may encounter, including the following
The parameter information used is shown below.
-
INNODB_ROW_LOCK_WAITS: The number of waits to obtain an InnoDB row lock.
-
INNODB_BUFFER_POOL_WAIT_FREE: The number of times a thread should wait for a free page in the buffer pool.
-
INNODB_LOG_WAITS: The number of times the log buffer was too small to accommodate incoming write requests and had to wait until space was freed up.
2.4.7 DBMS Monitoring : Cache
Table open cache
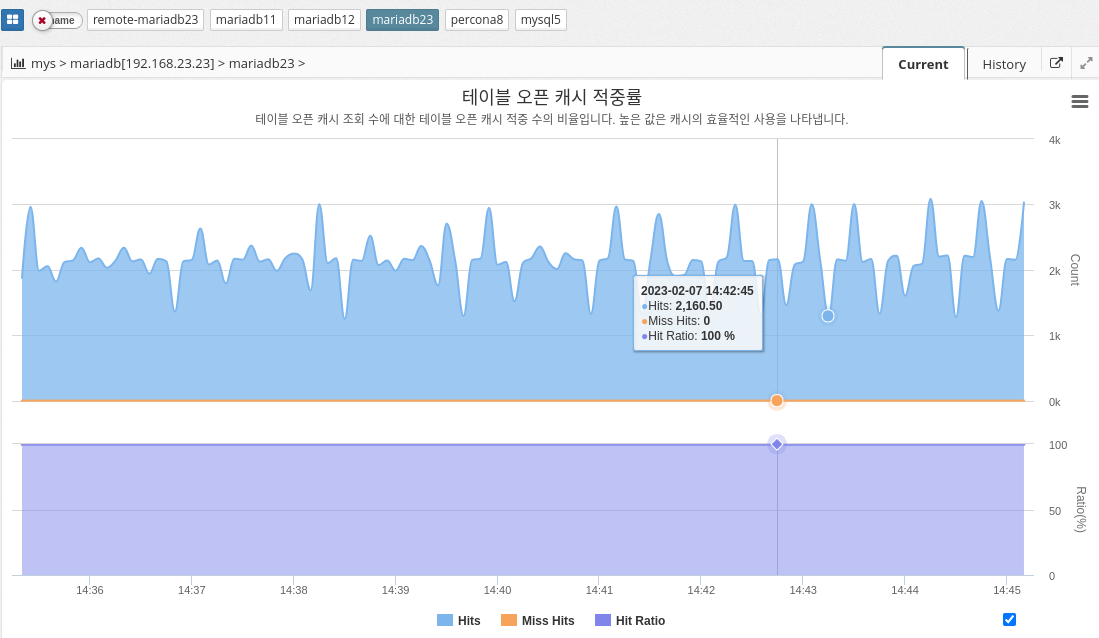
MySQL’s table open cache ratio indicates the percentage of tables that the MySQL server opens and caches in memory, relative to the total number of tables in the database. The table open cache ratio is a measure of the MySQL server’s efficiency in using memory to store frequently accessed tables and can affect the overall performance of the database.
In general, a high table open cache ratio means that more tables are being stored in memory, which can reduce the amount of disk I/O required to access the tables and speed up database queries. However, a high table open cache ratio also means that the MySQL server is using more memory, which affects the overall performance of the system and can lead to memory constraints if not managed properly.
To optimize the table open cache ratio, it is important to monitor cache usage and adjust the table_cache system variable as needed to ensure that the most frequently accessed tables are stored in memory. It is also important to track the overall memory usage of the system and adjust the available memory as needed to ensure that the MySQL server has enough resources to operate efficiently.
The parameter information used is shown below.
-
TABLE_OPEN_CACHE : Maximum number of tables deamon can open.
-
Calculated as
TABLE_OPEN_CACHE_HITS / (TABLE_OPEN_CACHE_HITS + TABLE_OPEN_CACHE_MISSES) * 100
Thread cache hit rate
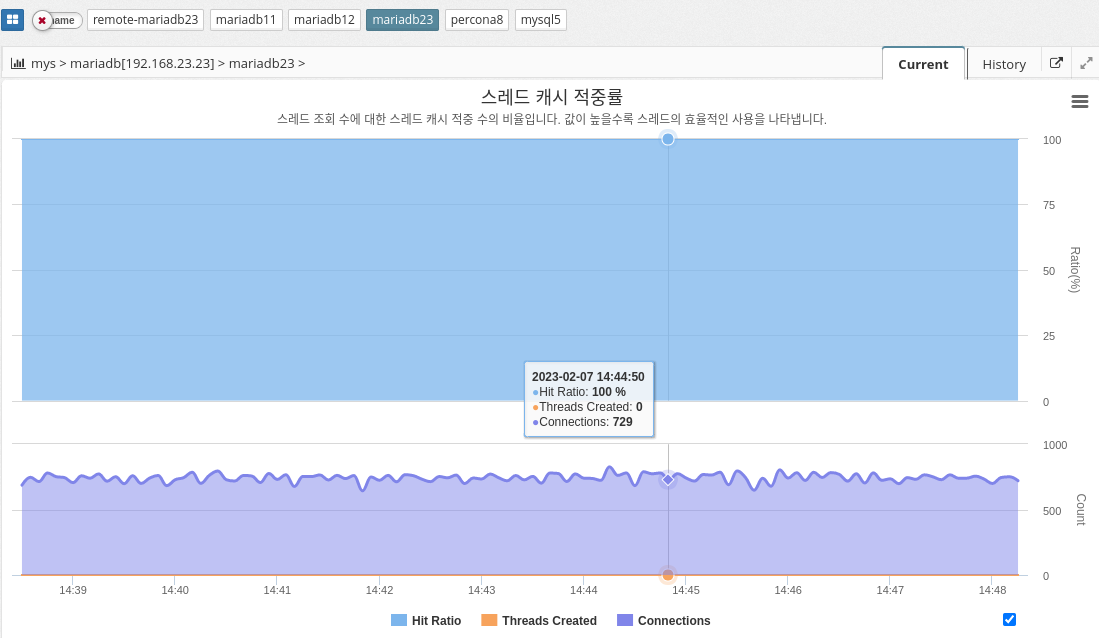
MySQL’s thread cache hit ratio is a performance metric that shows how efficiently the server uses the thread cache. It is calculated as the ratio of successful thread reuse to total thread creation requests. A high thread cache hit ratio indicates that the server is able to reuse threads efficiently and minimize the overhead of creating a new thread for each connection request.
A thread cache hit ratio of 100% means that all connection requests are being processed by cached threads, while a low hit ratio might indicate that the server is not using the thread cache efficiently, resulting in new threads being created for each request. This can reduce server performance.
To optimize the thread cache hit ratio, you can increase the size of the thread cache by adjusting the thread_cache_size variable in the MySQL configuration file. The larger the cache size, the more threads the server can reuse and minimize the overhead of creating new threads, which improves performance.
The parameter information used is shown below.
-
THREAD_CACHE_SIZE: The number of threads the daemon caches for reuse. Typically max_connections/100. See Connections and Threads_created.
-
SLOW_LAUNCH_THREADS: Number of threads whose thread creation took more than slow_launch_time.
-
Calculation
100 - threadsCreated / connections * 100
Binlog cache disk utilization
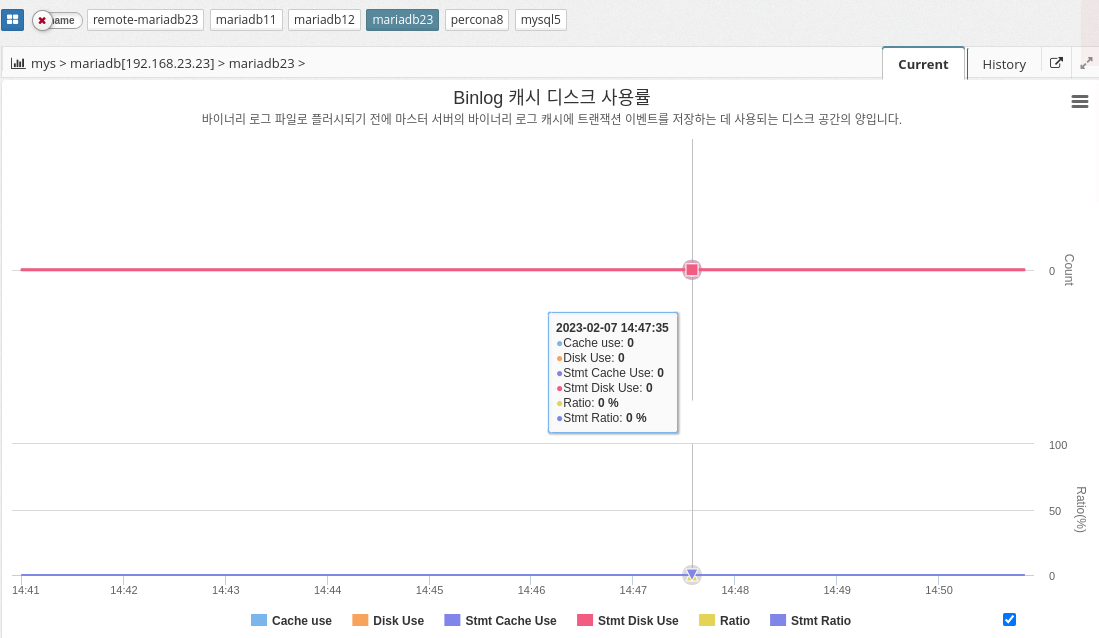
Binlog cache disk usage indicates the amount of disk space used by the MySQL database system to store binary log files. Binary log files, also known as binary log cache, are used to track database changes such as data insertions, updates, and deletions.
In MySQL, binary log files are stored on disk, and the amount of disk space required to store these files depends on the amount of database changes and the frequency of database transactions. The Binlog cache disk usage metric is important because it can affect the performance and reliability of your database system. High disk usage can result in slow database performance and increased disk I/O operations.
To reduce Binlog cache disk usage, administrators can optimize database configuration, such as increasing the cache size and regularly removing old binary log files. They can also use the Binary Log Rotate feature to automatically rotate and archive old binary log files to free up disk space and improve performance.
In conclusion, monitoring and optimizing Binlog cache disk usage is an important aspect of maintaining a healthy and efficient MySQL database system.
The parameter information used is shown below.
-
BINLOG_CACHE_SIZE : Caching memory size for binary logs per thread.
-
BINLOG_STMT_CACHE_SIZE : Cache memory size for statement (non-transaction) binary logs per thread.
2.4.8 DBMS Monitoring : Table
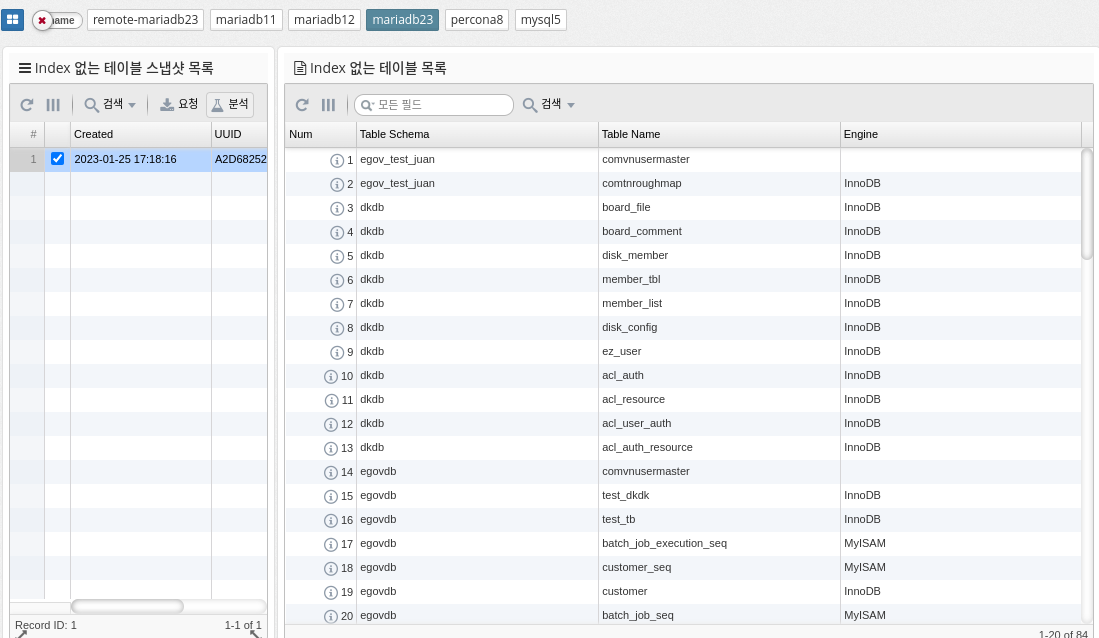
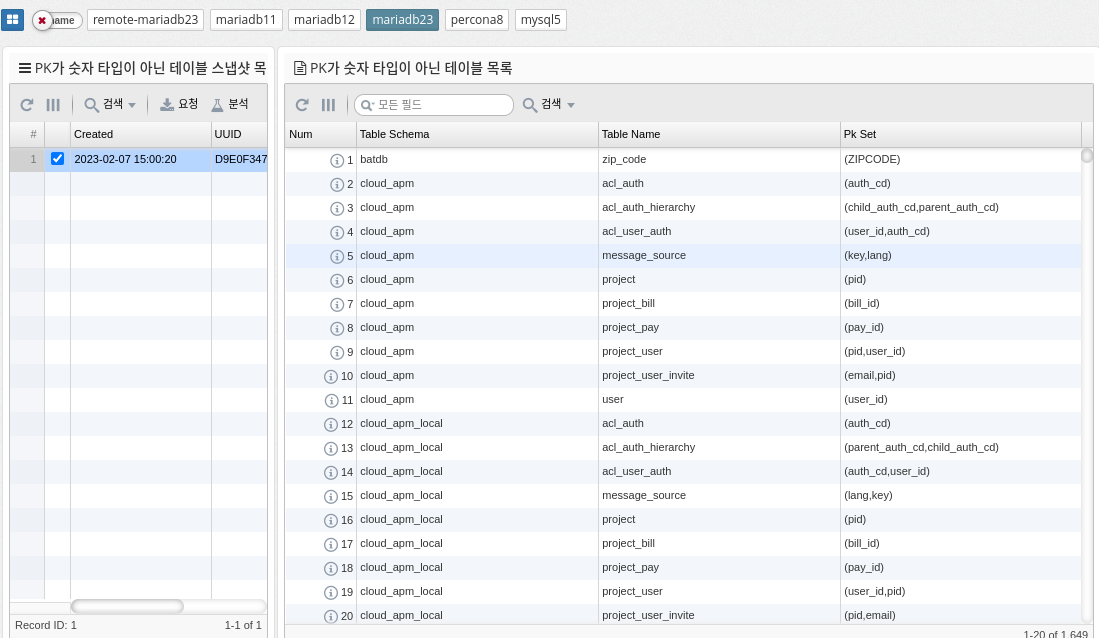
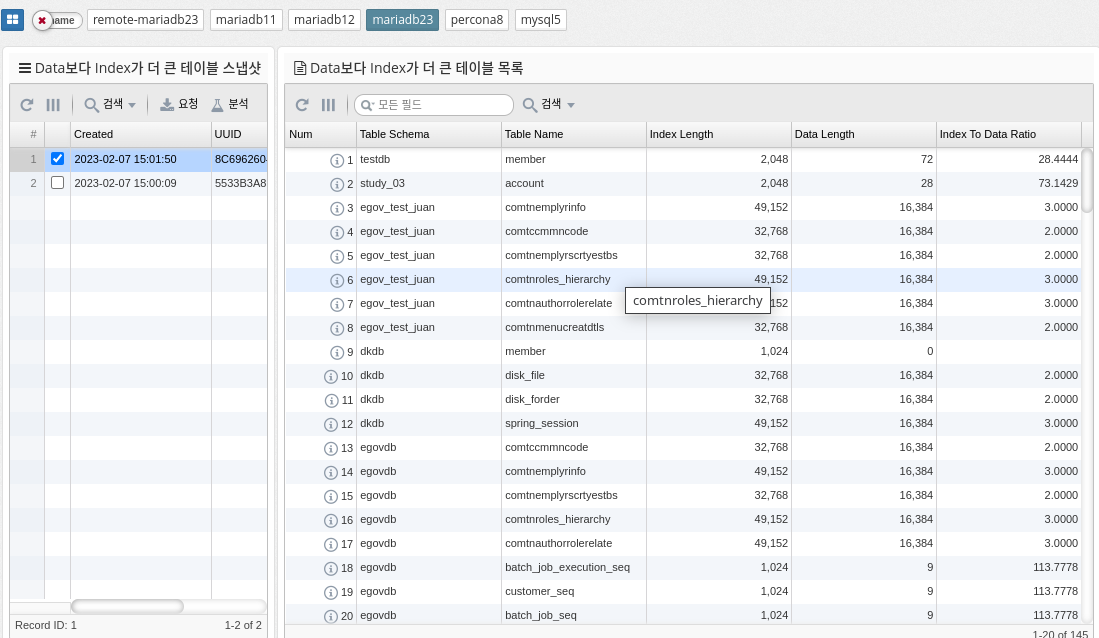
Fullscan ratio
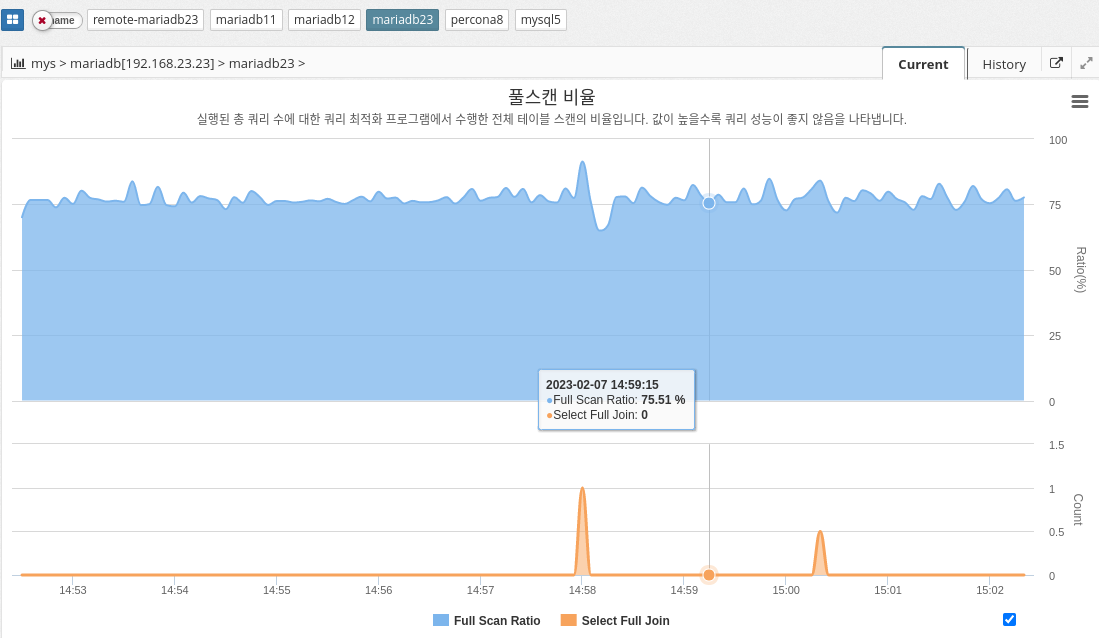
MySQL’s full-scan ratio indicates the percentage of times the database server scans the entire table instead of using indexes to retrieve data. A high full scan ratio indicates that the database is not using indexes efficiently, resulting in slow query performance.
To minimize the overall scan ratio, we recommend creating indexes on frequently used columns and building queries using the indexes. Optimizing indexes can significantly improve query performance because the database server can quickly find the desired data in the index instead of searching the entire table.
The parameter information used is shown below.
-
SELECT_FULL_JOIN
-
Calculation
(HANDLER_READ_RND_NEXT + HANDLER_READ_RND) / (HANDLER_READ_RND_NEXT + HANDLER_READ_RND + HANDLER_READ_FIRST + HANDLER_READ_NEXT + HANDLER_READ_KEY + HANDLER_READ_PREV) * 100.0");
Lock wait count
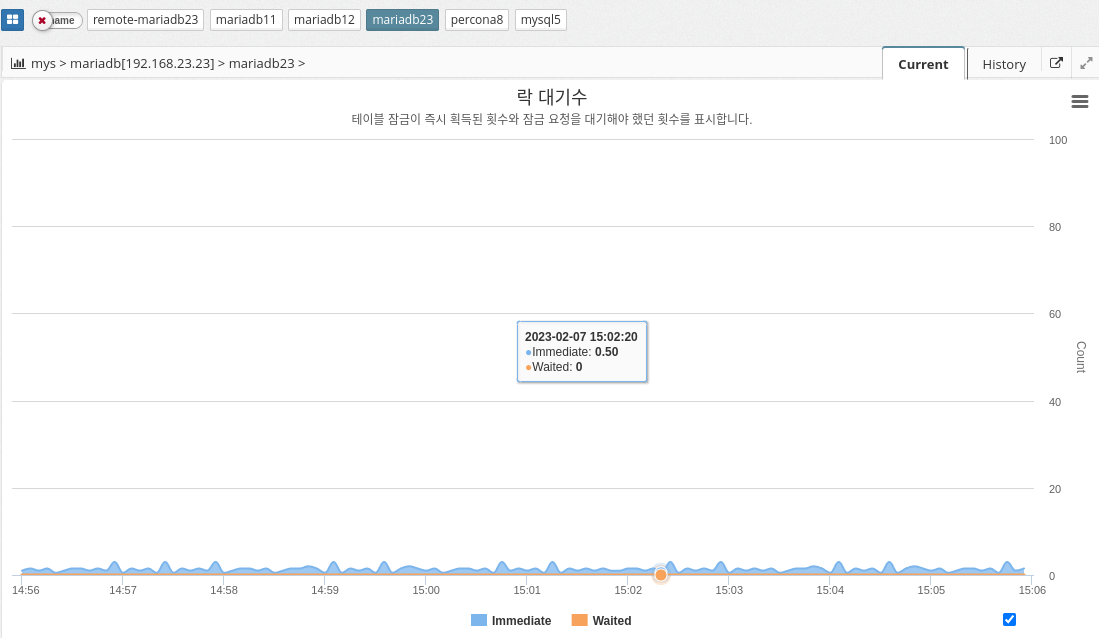
Immediate and waited are two performance metrics in the MySQL performance schema that show the number of table lock requests that are immediately authorized and the number of table lock requests that must wait to be unlocked, respectively.
IMMEDIATE reflects the number of lock requests that were immediately granted because the table was not locked or the lock was immediately available. This metric indicates the performance of the locking mechanism and the overall load on the server. A large number of immediate lock grants can indicate a well-tuned server that handles a large number of requests.
On the other hand, waited reflects the number of lock requests that have to wait for a lock to be released. This metric can indicate the presence of lock contention, where multiple queries are trying to access the same table at the same time and one must wait for the others to complete. A high value of waited can be an indicator of poor performance and may indicate that the database is not optimized for high concurrent usage.
In summary, these two metrics provide important information about the performance of MySQL’s locking mechanism and can be used to identify potential bottlenecks or problems in the system.
The parameter information used is shown below.
-
TABLE_LOCKS_IMMEDIATE: Number of table locks acquired immediately.
-
TABLE_LOCKS_WAITED: Number of table locks waited for.
Tmp Disk Utilization
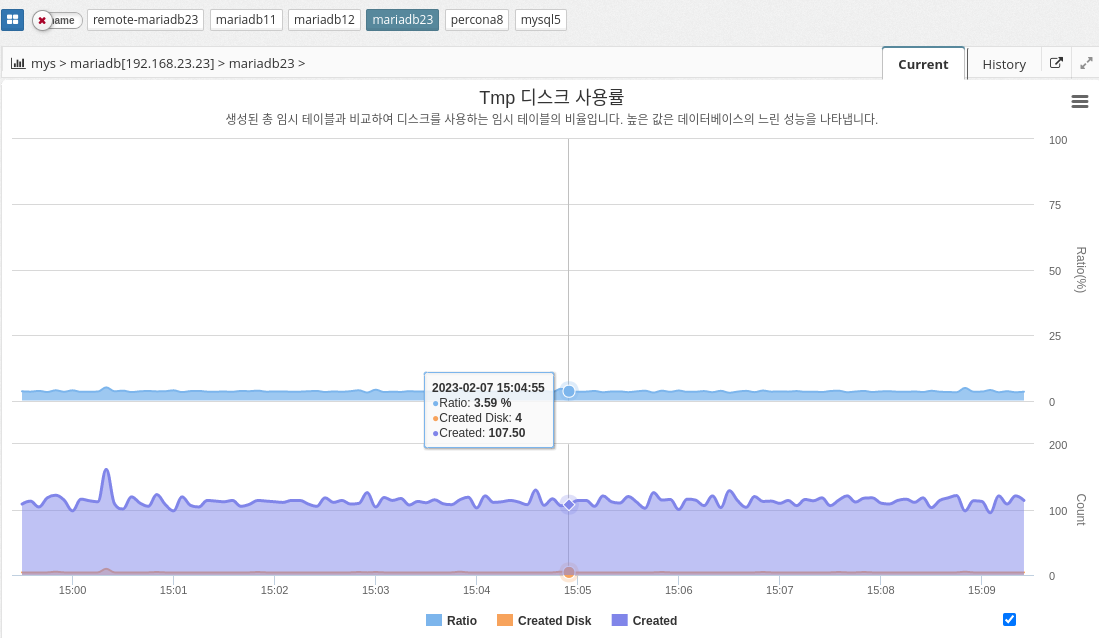
The tmp disk percentage in MySQL indicates the percentage of disk space used for temporary storage compared to the total disk space available to the database server. This temporary storage is used to store intermediate results during complex queries and is also used to sort and group data.
CREATED_TMP_TABLES is a performance metric in MySQL that indicates the number of temporary tables created on disk rather than in memory. The value of this metric is an indicator of how much temporary disk space the MySQL server is using. A high value for CREATED_TMP_TABLES indicates that the MySQL server is running out of memory and needs to use temporary disk space to store temporary tables.
The parameter information used is shown below.
-
CREATED_TMP_TABLES: The number of temporary tables created in memory.
-
Calculation
CREATED_TMP_TABLES / QUERIES * 100
2.4.9 DBMS Monitoring: Query Information
Slow queries
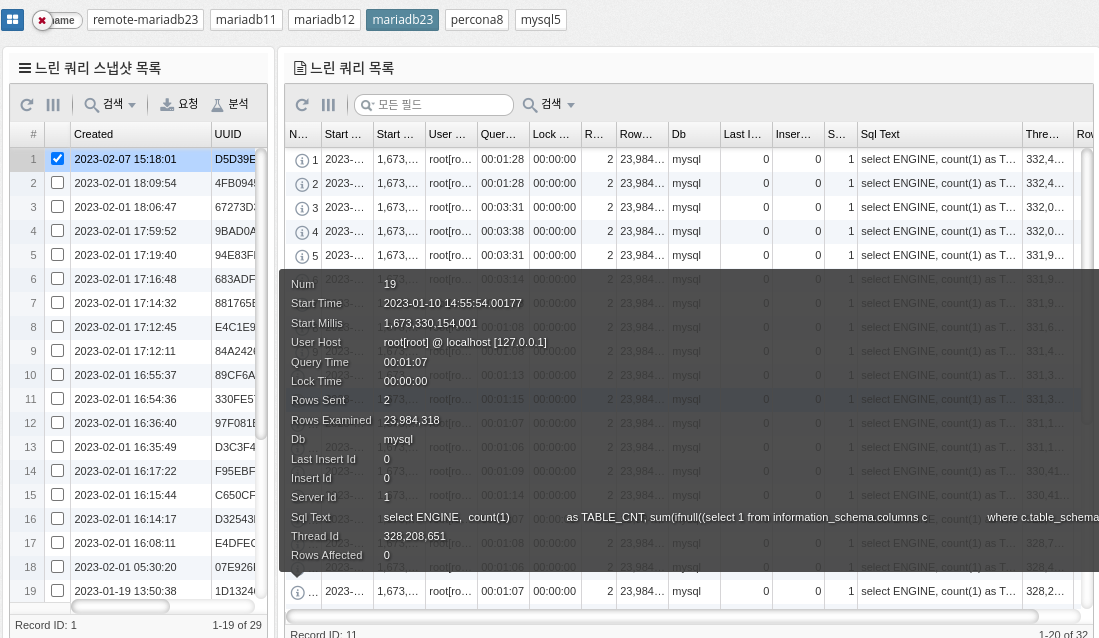
The slow_log table in MySQL is a log file that tracks slow running queries in the database. It is used to diagnose and improve database performance by identifying the source of slow-running queries.
The slow_log table stores information about each slow query, such as the start time, execution time, SQL statements, and number of rows processed. You can use this information to identify which queries are taking too long to execute and what changes you need to make to improve performance.
To enable the slow_log table in MySQL, you need to modify the my.cnf file or my.ini file on Windows and add the following line.
[mysqld]
slow_query_log=1
slow_query_log_file=<path to the file>.
long_query_time=<time in seconds>.
The "slow_query_log" parameter enables the slow query log, the "slow_query_log_file" parameter specifies the path to the slow query log file, and the "long_query_time" parameter sets the threshold time in seconds for defining a slow query.
The slow_log table is a useful tool for database administrators to optimize database performance and improve query performance.
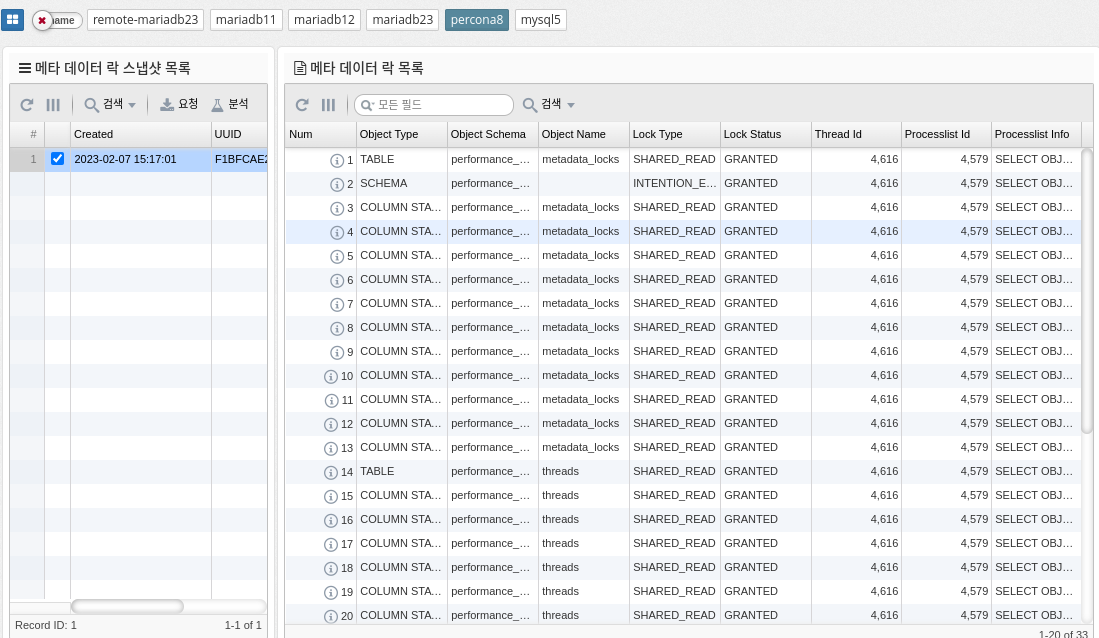
Memory usage by account
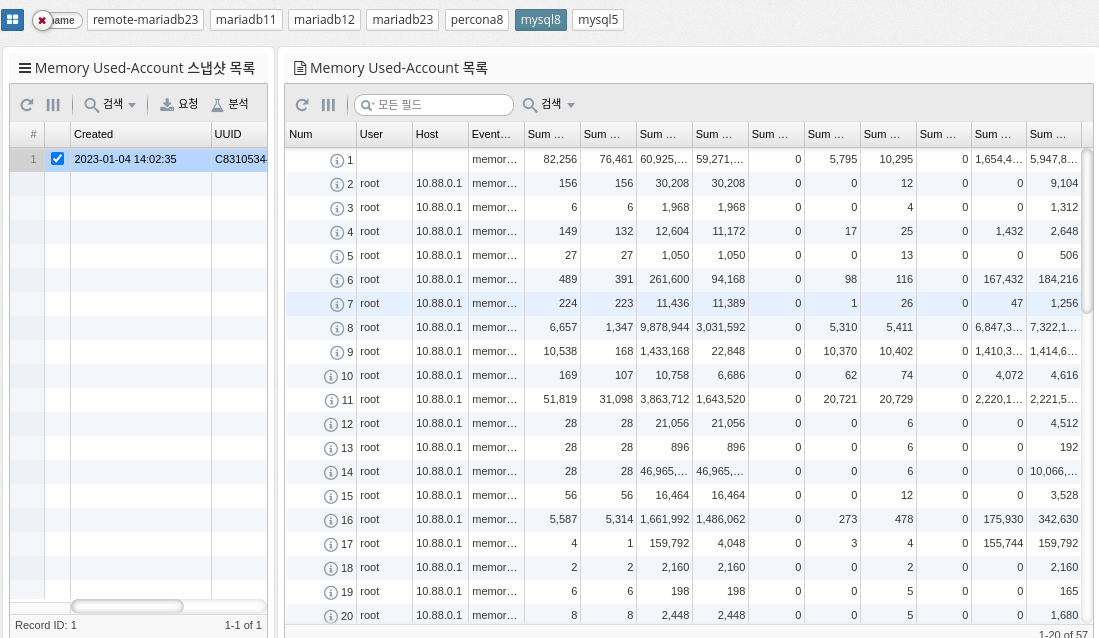
MySQL’s "memory_summary_by_account_by_event_name" represents a query that summarizes the memory usage of different accounts in the database by event name. It provides a breakdown of how much memory is used by each account and what types of events (queries, table operations, etc.) consume the most memory.
This information can be useful for database administrators to identify areas where memory usage should be optimized or resources should be allocated differently. You can run the query by running a SELECT statement with a group by clause against relevant database tables and columns, such as the "performance_schema.memory_summary_by_thread_by_event_name" table.
The query output provides a summary of the total memory used by each account, categorized by event name. You can use this information to identify areas where you can improve performance, such as optimizing database queries, reducing the amount of data stored, or adding additional resources.
| Supported by mysql, percona 8.0 and later, and mariadb 10.5.2 and later. |
Memory Usage by Host
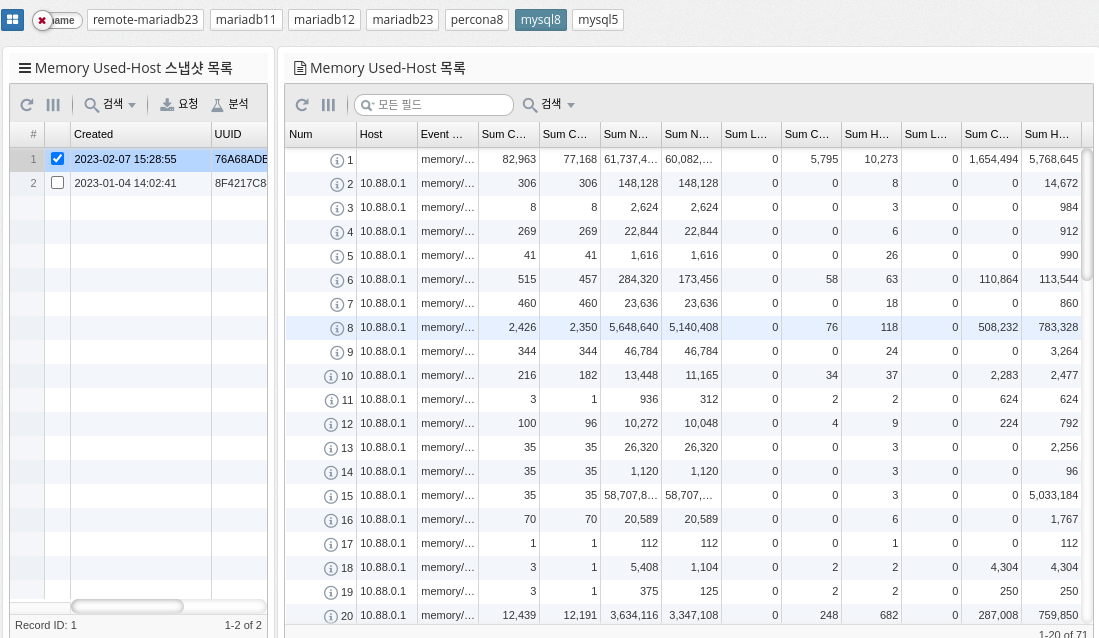
memory_summary_by_host_by_event_name is a performance schema table in MySQL that provides information about memory usage for various events grouped by host. This table is part of the performance schema, a feature of MySQL that provides real-time information about server performance.
The memory_summary_by_host_by_event_name table contains information about the amount of memory allocated and used by each event and the number of instances of the event that were executed. This information can be useful for identifying which events consume the most memory, which can be useful for identifying performance bottlenecks and improving the performance of your server.
Some of the columns in the memory_summary_by_host_by_event_name table are.
-
host: Host name of the server on which the event ran
-
event_name: The name of the event
-
sum_alloc: The total amount of memory allocated by the event instance
-
sum_free: The total amount of memory freed by the event instance
-
current_alloc: The current amount of memory allocated by the event instance
-
current_free: The current amount of memory freed by the event instance
-
count_alloc: Number of memory allocations by event instance
-
count_free: the amount of memory freed by the event instance
In summary, the memory_summary_by_host_by_event_name table provides important information about the memory usage of server events that can be useful for identifying performance bottlenecks and improving server performance.
| Supported by mysql, percona 8.0 and later, and mariadb 10.5.2 and later. |
Memory Usage by Thread
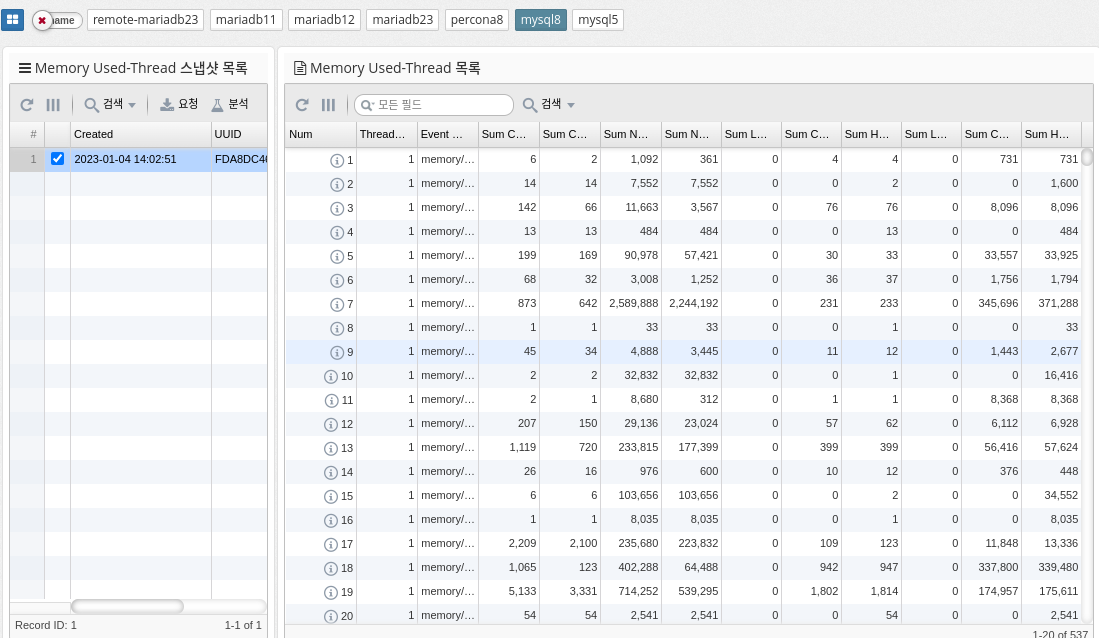
memory_summary_by_thread_by_event_name is a table in MySQL’s performance_schema that provides memory usage statistics for each thread on the server, categorized by event name. The table shows the amount of memory used by each thread, grouped by the type of event it is running (for example, parsing SQL statements, executing stored procedures, and so on).
The columns in this table include
-
THREAD_ID: The unique identifier of the thread.
-
EVENT_NAME: The name of the type of event the thread is running.
-
COUNT_ALLOC: The number of memory allocations for this event type and thread.
-
SUM_NUMBER_OF_BYTES_ALLOC: The total number of bytes allocated for this event type and thread.
-
AVG_BYTES_ALLOC: The average number of bytes allocated for each allocation of this event type and thread.
This table can be useful for determining which threads are using the most memory and which event types are contributing to that usage. Database administrators can analyze the data in this table to identify areas where memory can be over-allocated or freed to optimize memory usage.
| Supported by mysql, percona 8.0 and later, and mariadb 10.5.2 and later. |
Memory Usage by User
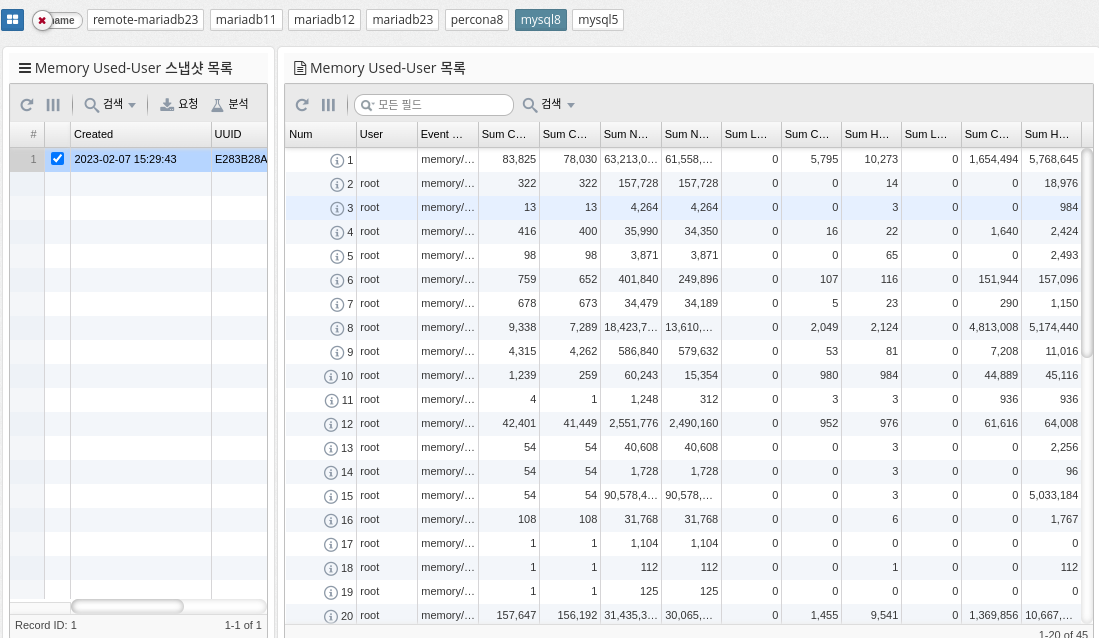
Memory_summary_by_user_by_event_name is a metric in MySQL that provides a summary of memory usage by user and event name. It helps you monitor the amount of memory consumed by different users and events within your database. This information is useful for identifying performance issues and managing database resources efficiently.
The memory_summary_by_user_by_event_name metric provides information about the following aspects of memory usage.
By regularly monitoring this metric, database administrators can identify performance bottlenecks and optimize resource utilization by adjusting query execution plans or tuning database configuration.
| Supported by mysql, percona 8.0 and later, and mariadb 10.5.2 and later. |
Memory Usage by Event
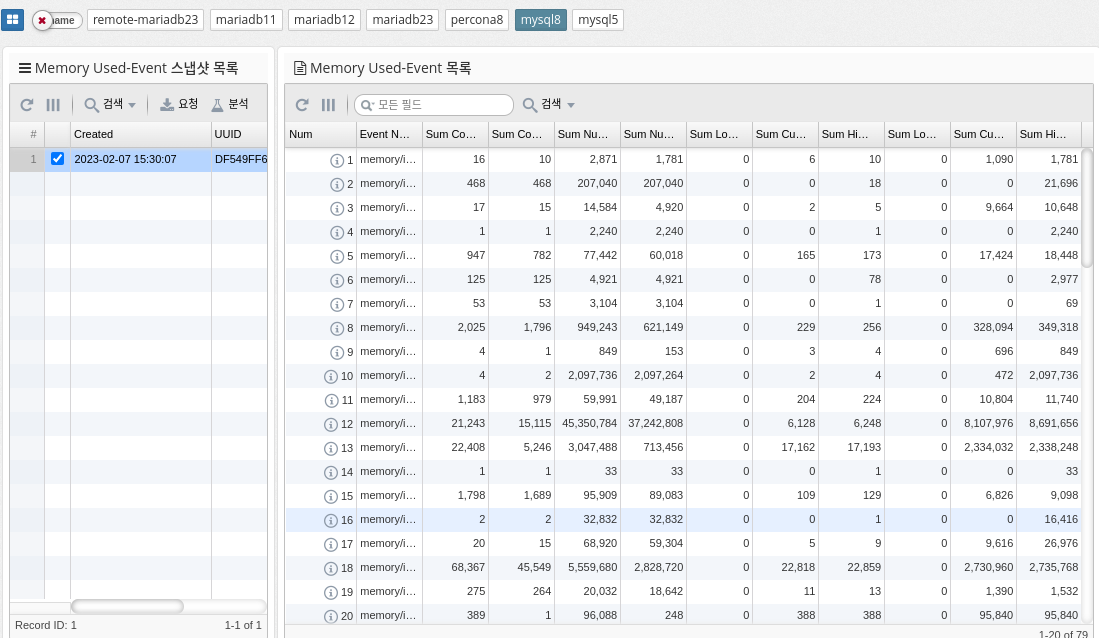
MySQL’s memory_summary_global_by_event_name references a performance schema table that provides information about memory usage by various events on the MySQL server. This table stores data about memory usage for various events and categories of events, such as memory used for sorting, memory used for hash tables, memory used to store query results, and so on. The data in this table is aggregated at a global level and can be used to identify the largest memory consumers on your MySQL server. This information is useful for optimizing memory usage and improving performance.
| Supported by mysql, percona 8.0 and later, and mariadb 10.5.2 and later. |
2.4.10 DBMS Monitoring: Reports
Report
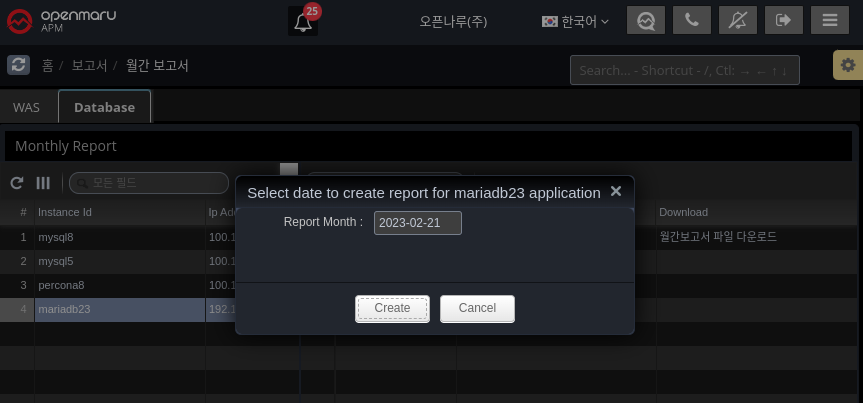
On the first day of every month, it automatically generates a report for the previous month.
Alternatively, you can generate it manually using the "Generate report" button.
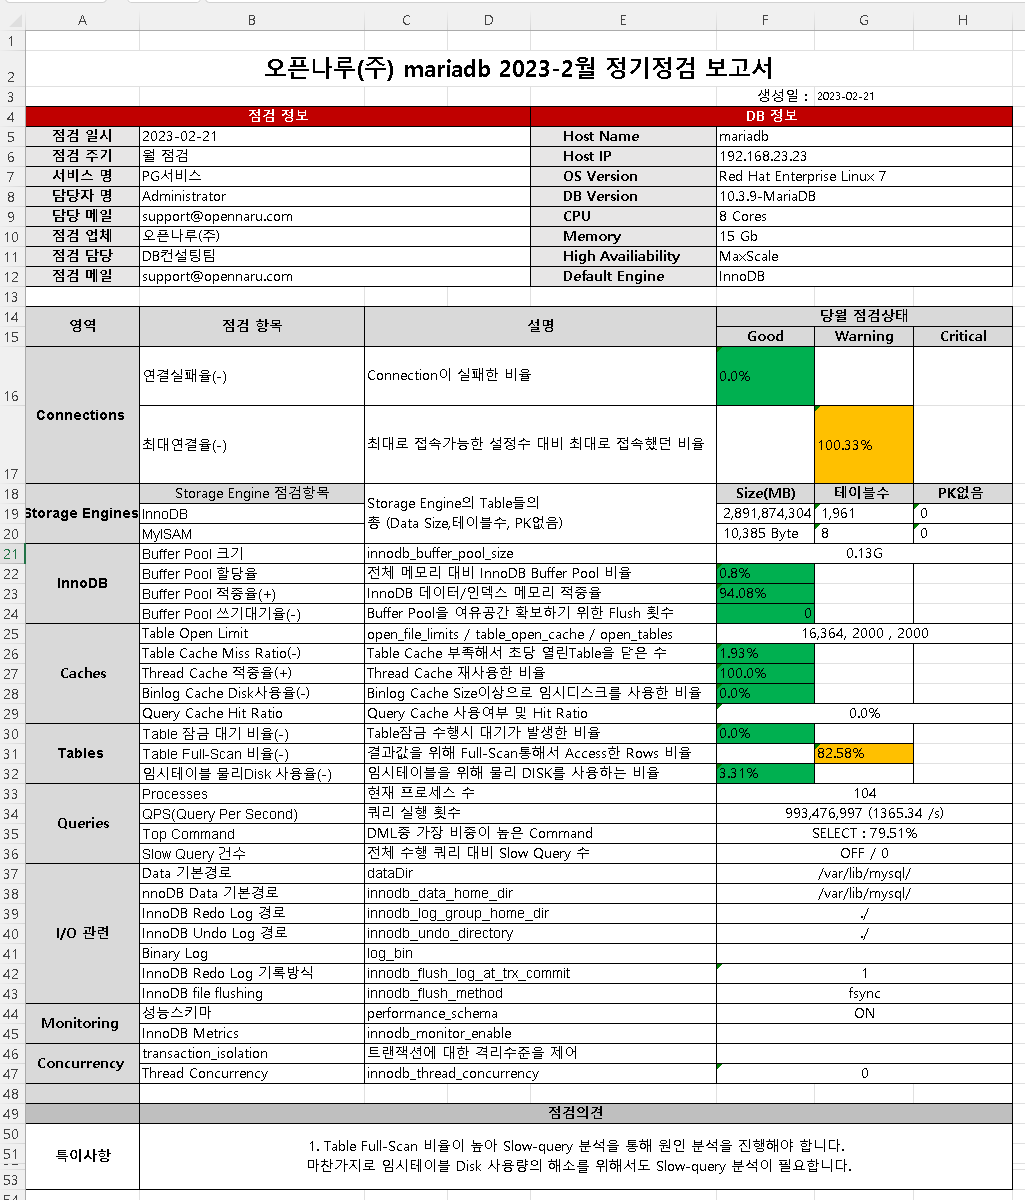
The report is organized by Connections, Storage Engines, InnoDB, Caches, Tables, Queries, I/O related, Monitoring, and Concurrency to give you a quick overview of whether your DBMS is running stably.
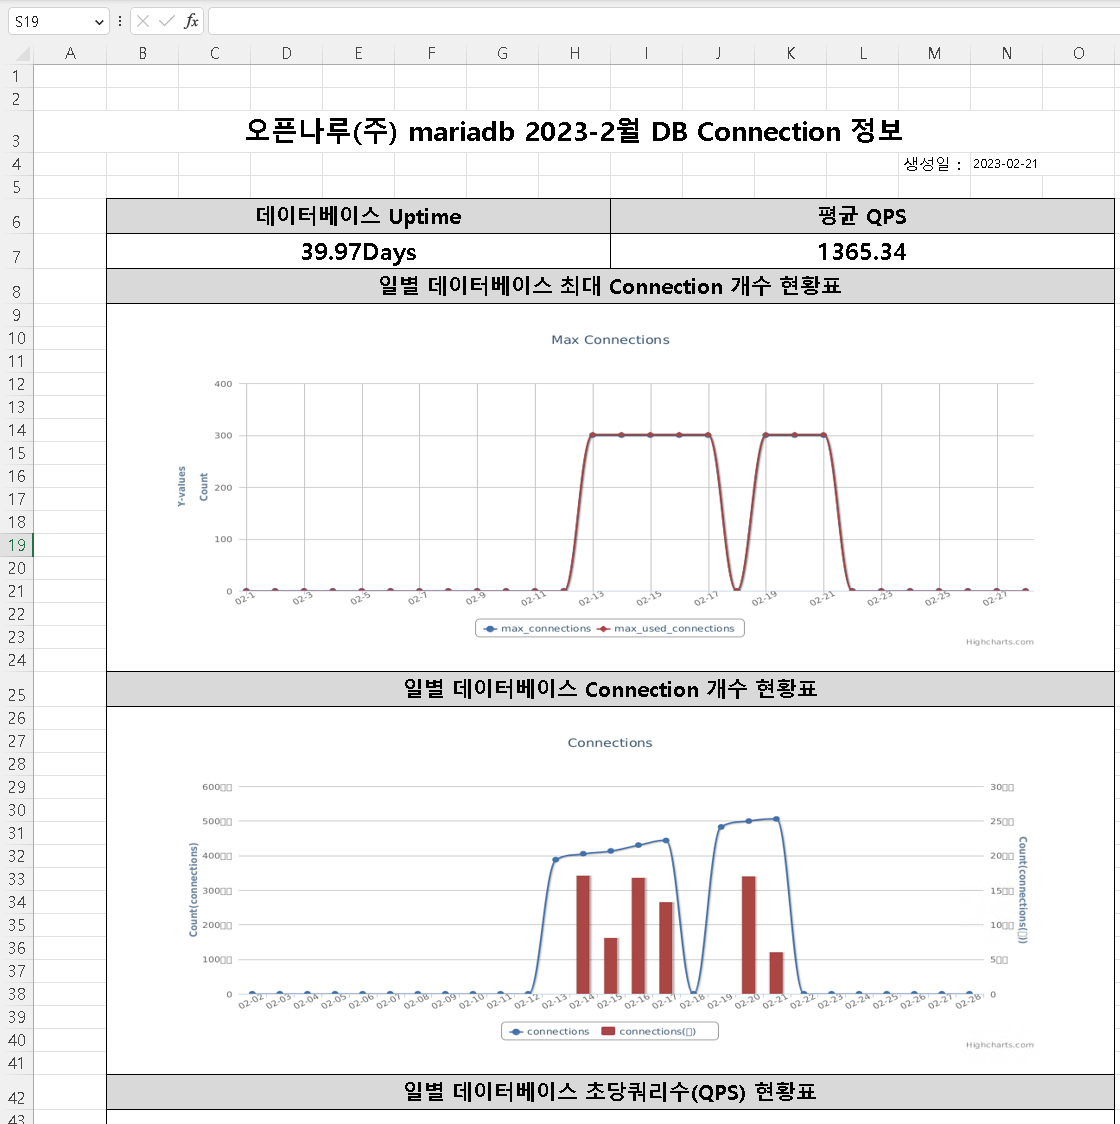
The simplified report shows the daily fluctuations in usage through graphs.
-
Maximum number of database connections
-
Database Connection Count
-
Database Queries Per Second (QPS)
-
Database Command Usage
-
Database innodb buffer pool size
-
Database innodb data activity
-
Database innodb waits
-
Database table locks
-
database full table scan rate
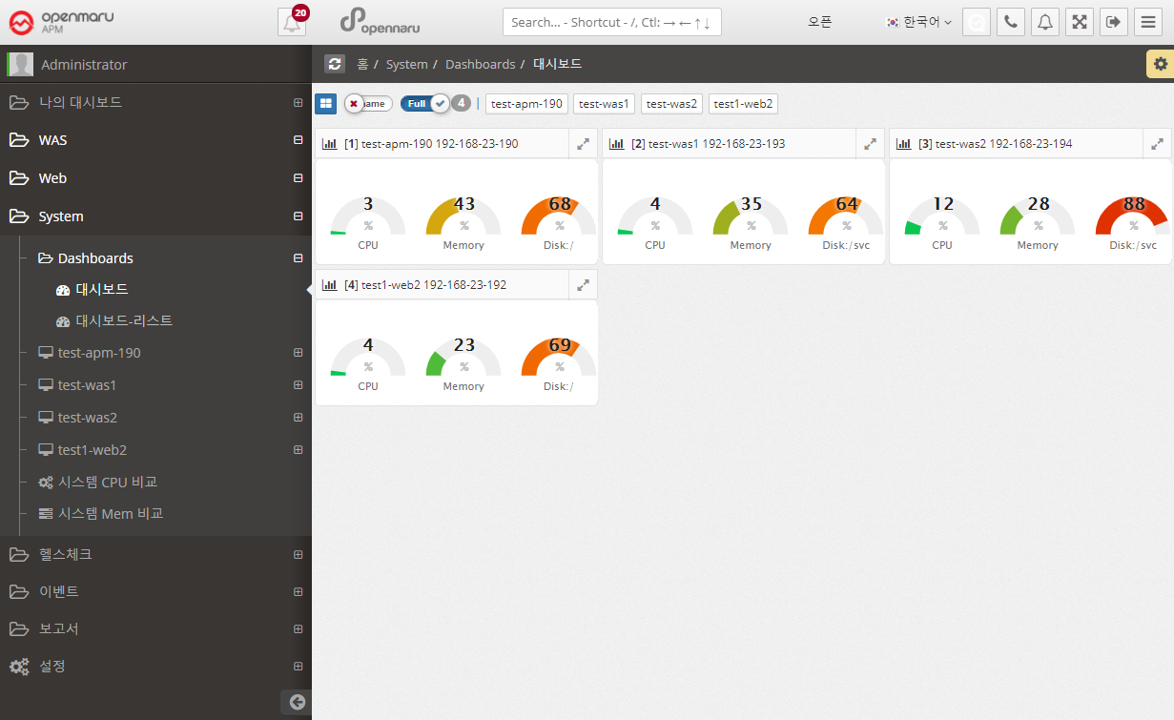
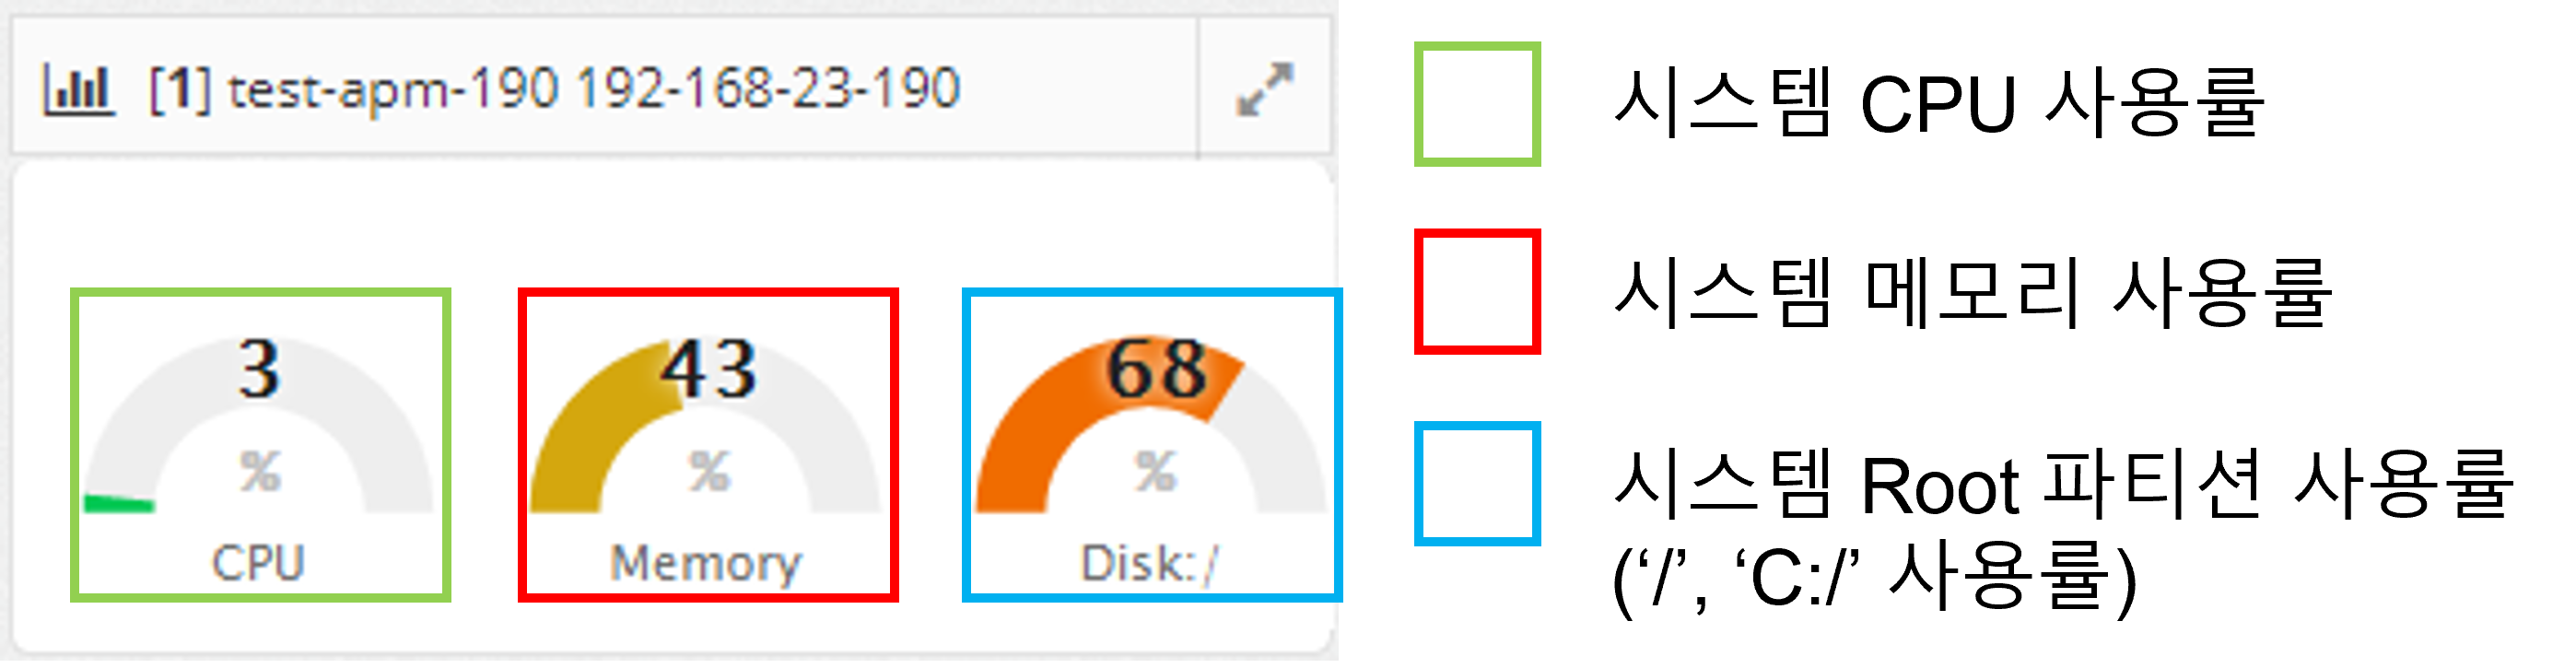
2.5.1 System Dashboard
Among the many data that the System Agent collects, a dashboard is organized and provided so that you can identify problems that may occur in the system at a glance.
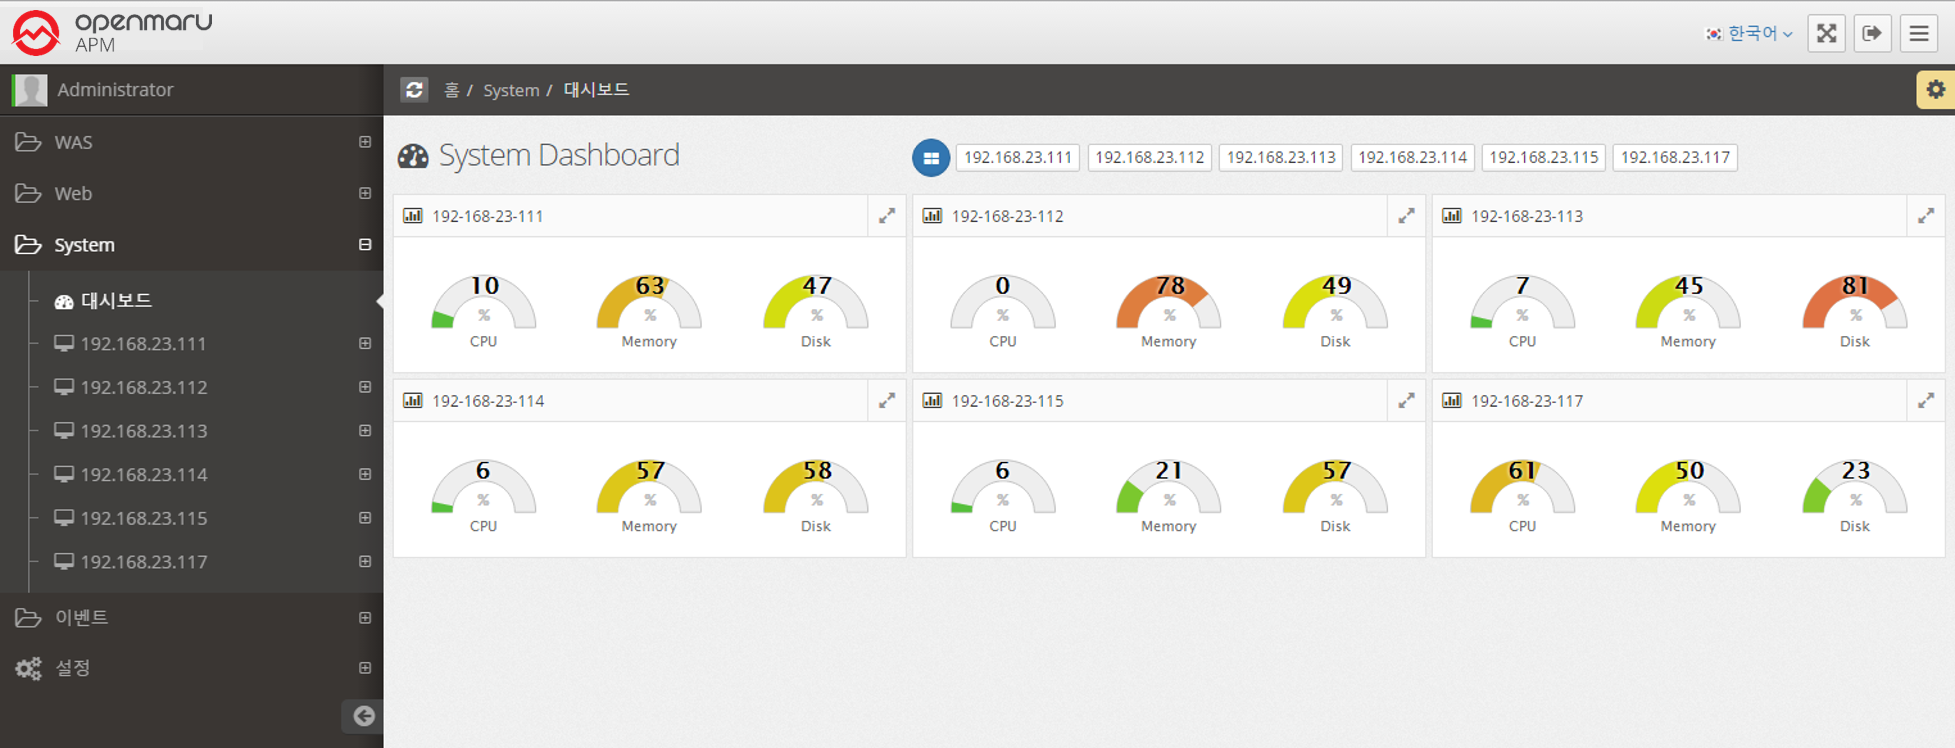
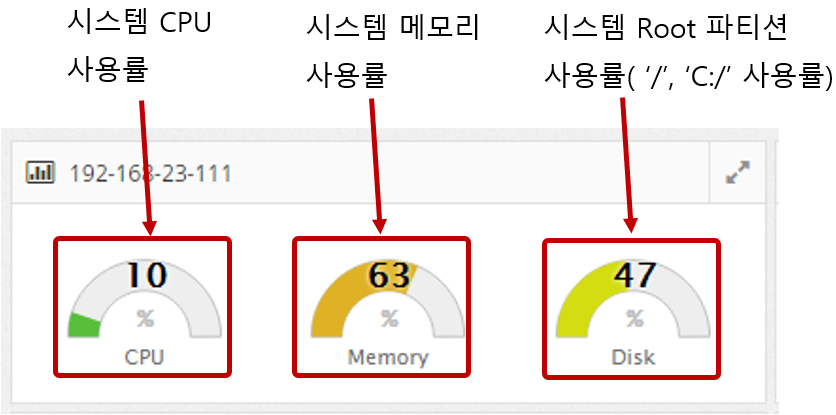
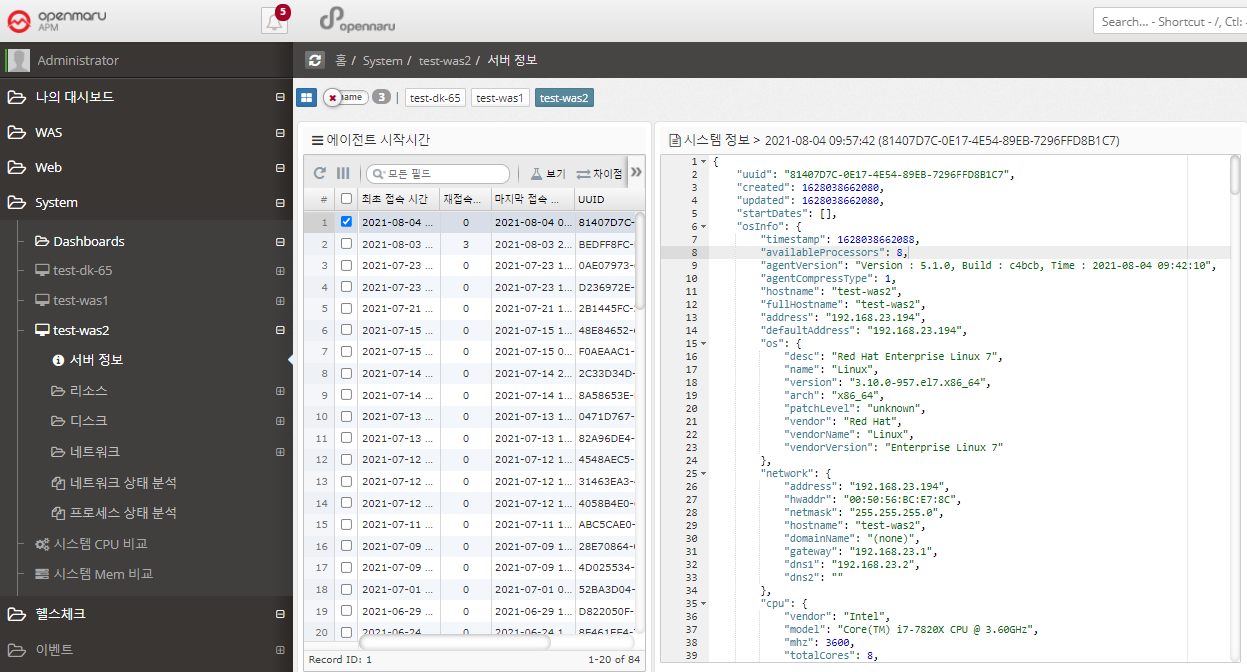
2.5.1 System Status Monitoring - Server Information
System status monitoring items are collected through the separately installed System Agent. It monitors the CPU, Memory, Disk, and Network status of the system and displays the information in a graph.
System > Server Information
Each time the System Agent is run, it collects and stores OS basic information such as version, kernel version, architecture, and number of cores, OS network basic information such as netmask, gateway, and DNS, disk partition information, and network interface card information.
If you press 'Ctrl + F', you can search for the desired text.
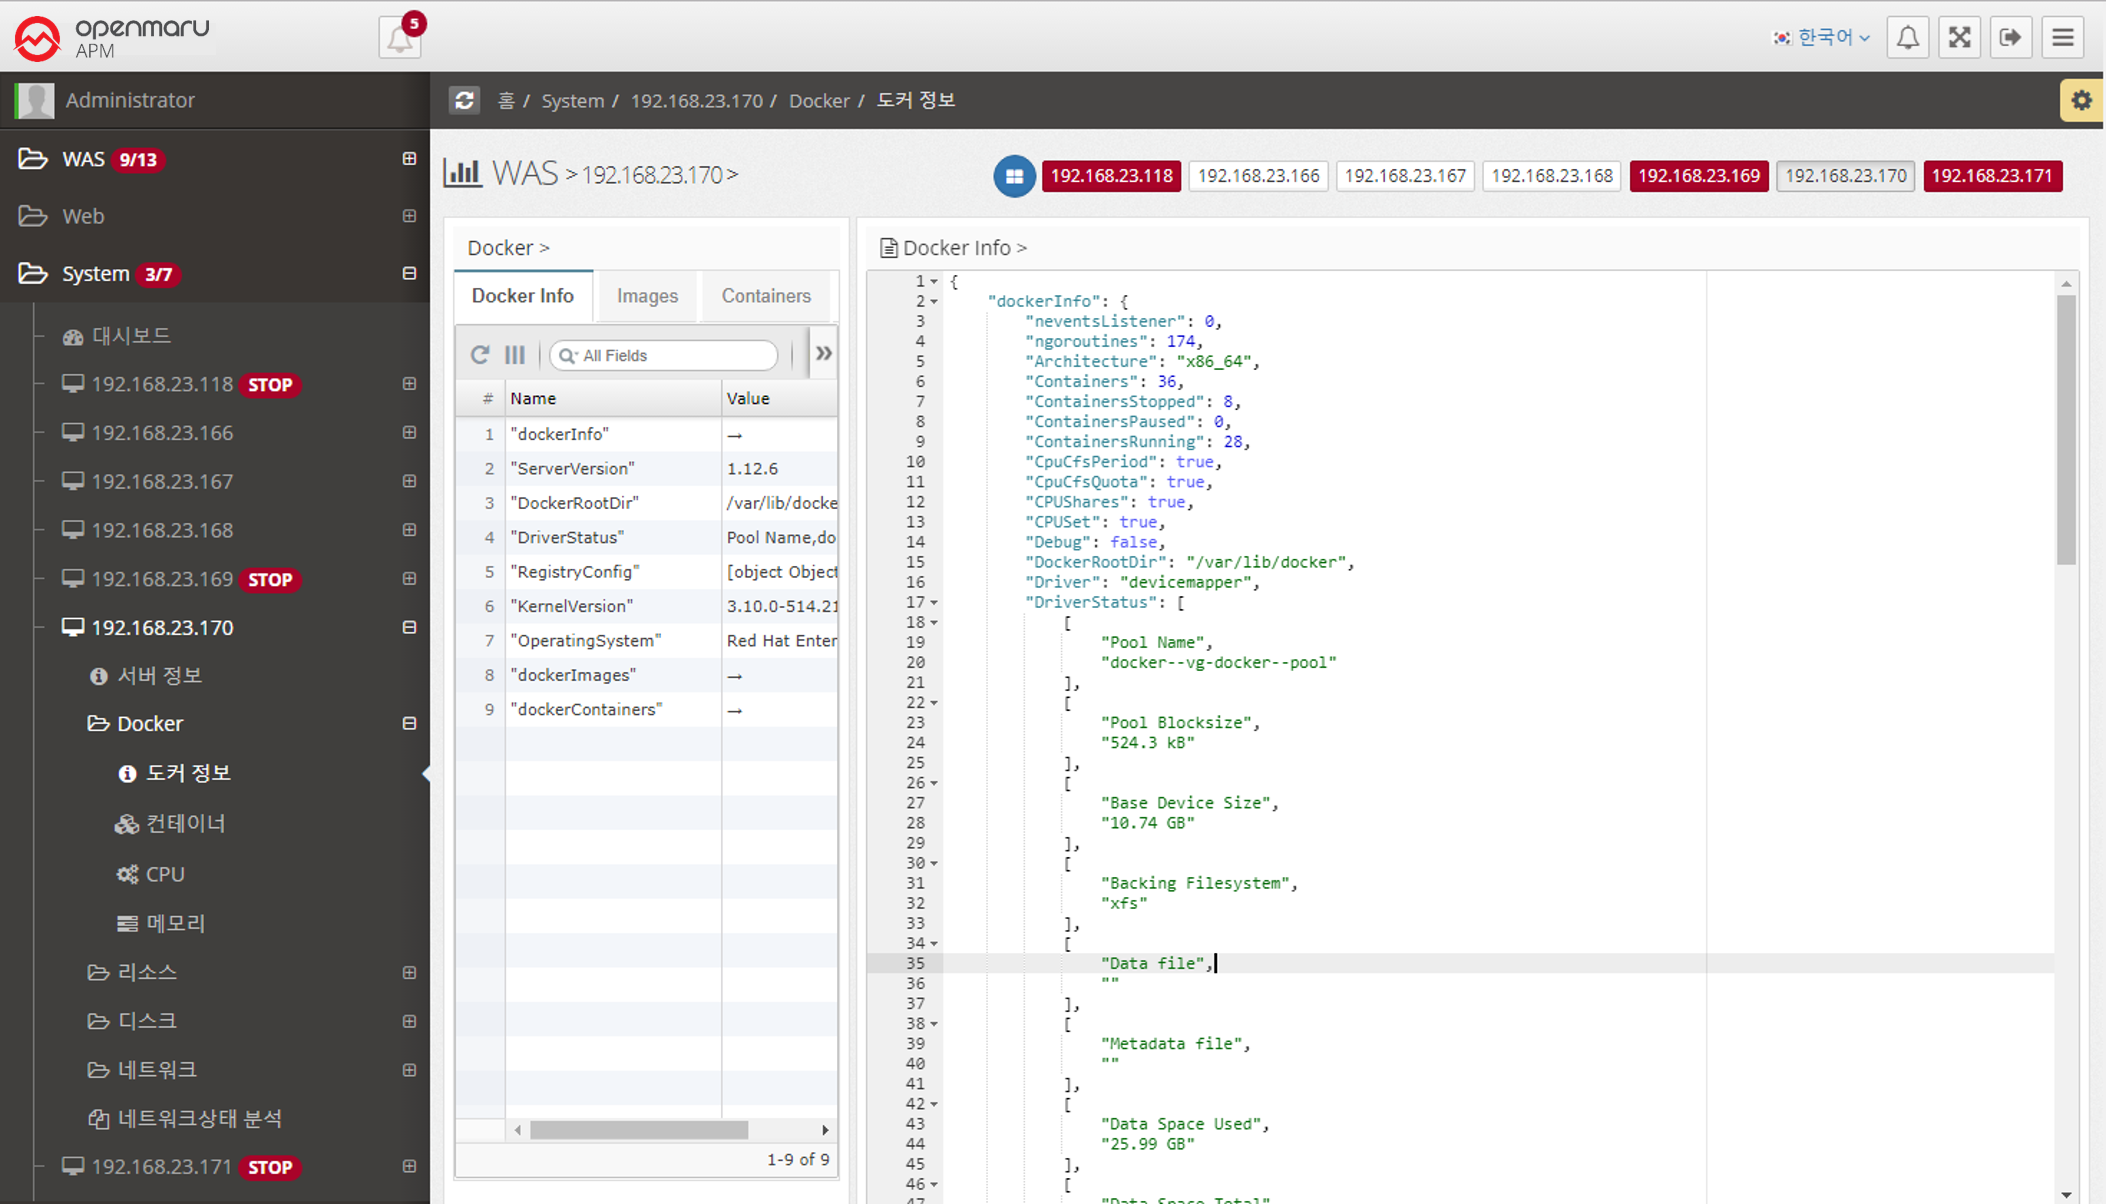
2.5.2 System - Docker
System > Docker > Docker Info
You can check the current Docker basic information, Image list, and Container list information.
| Item | Description |
|---|---|
Docker Info |
Installation information such as server version, kernel version, etc. |
Images |
List of pulled images |
Containers |
List of executed containers |
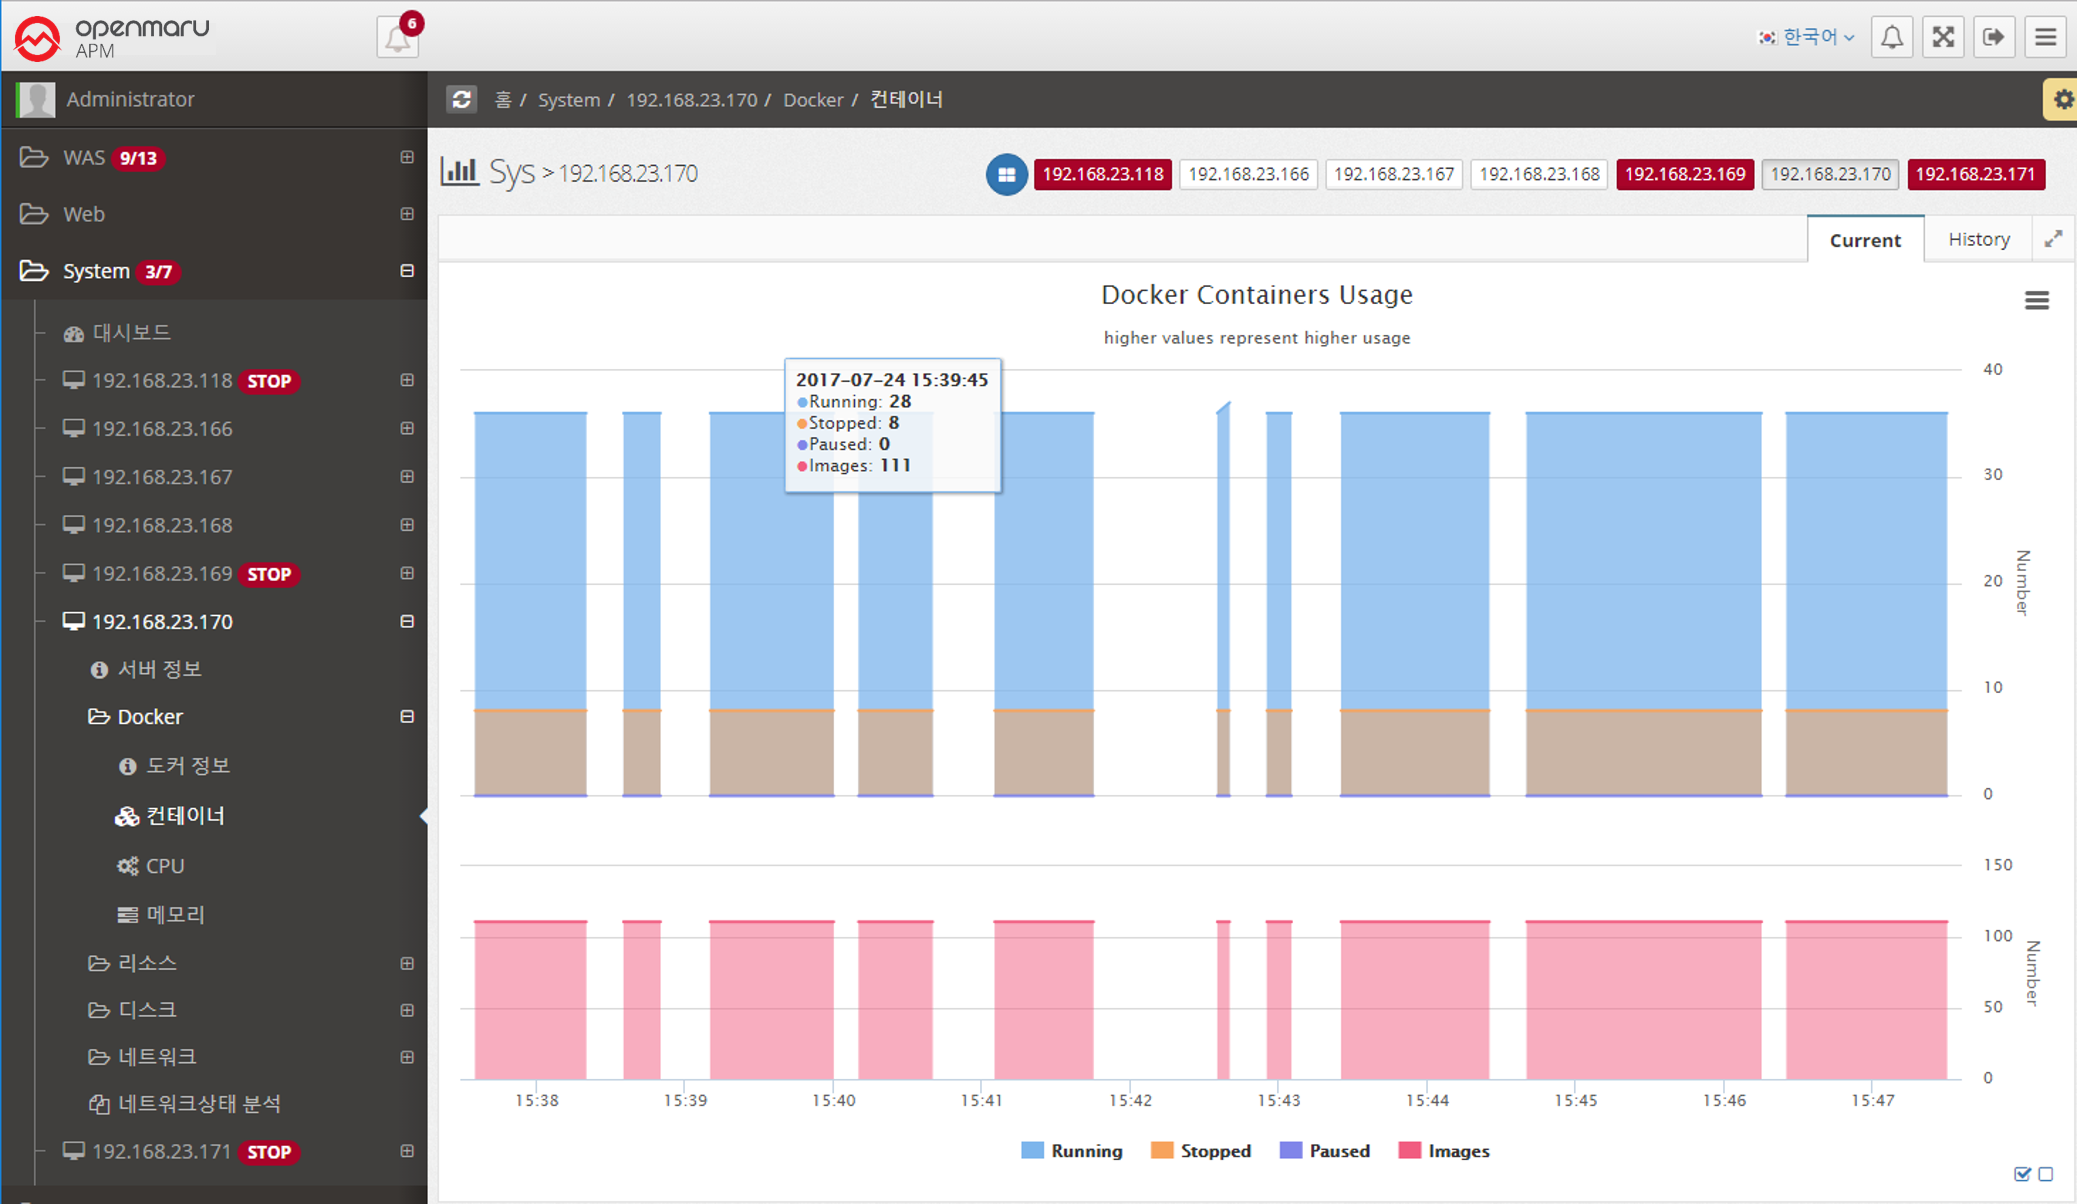
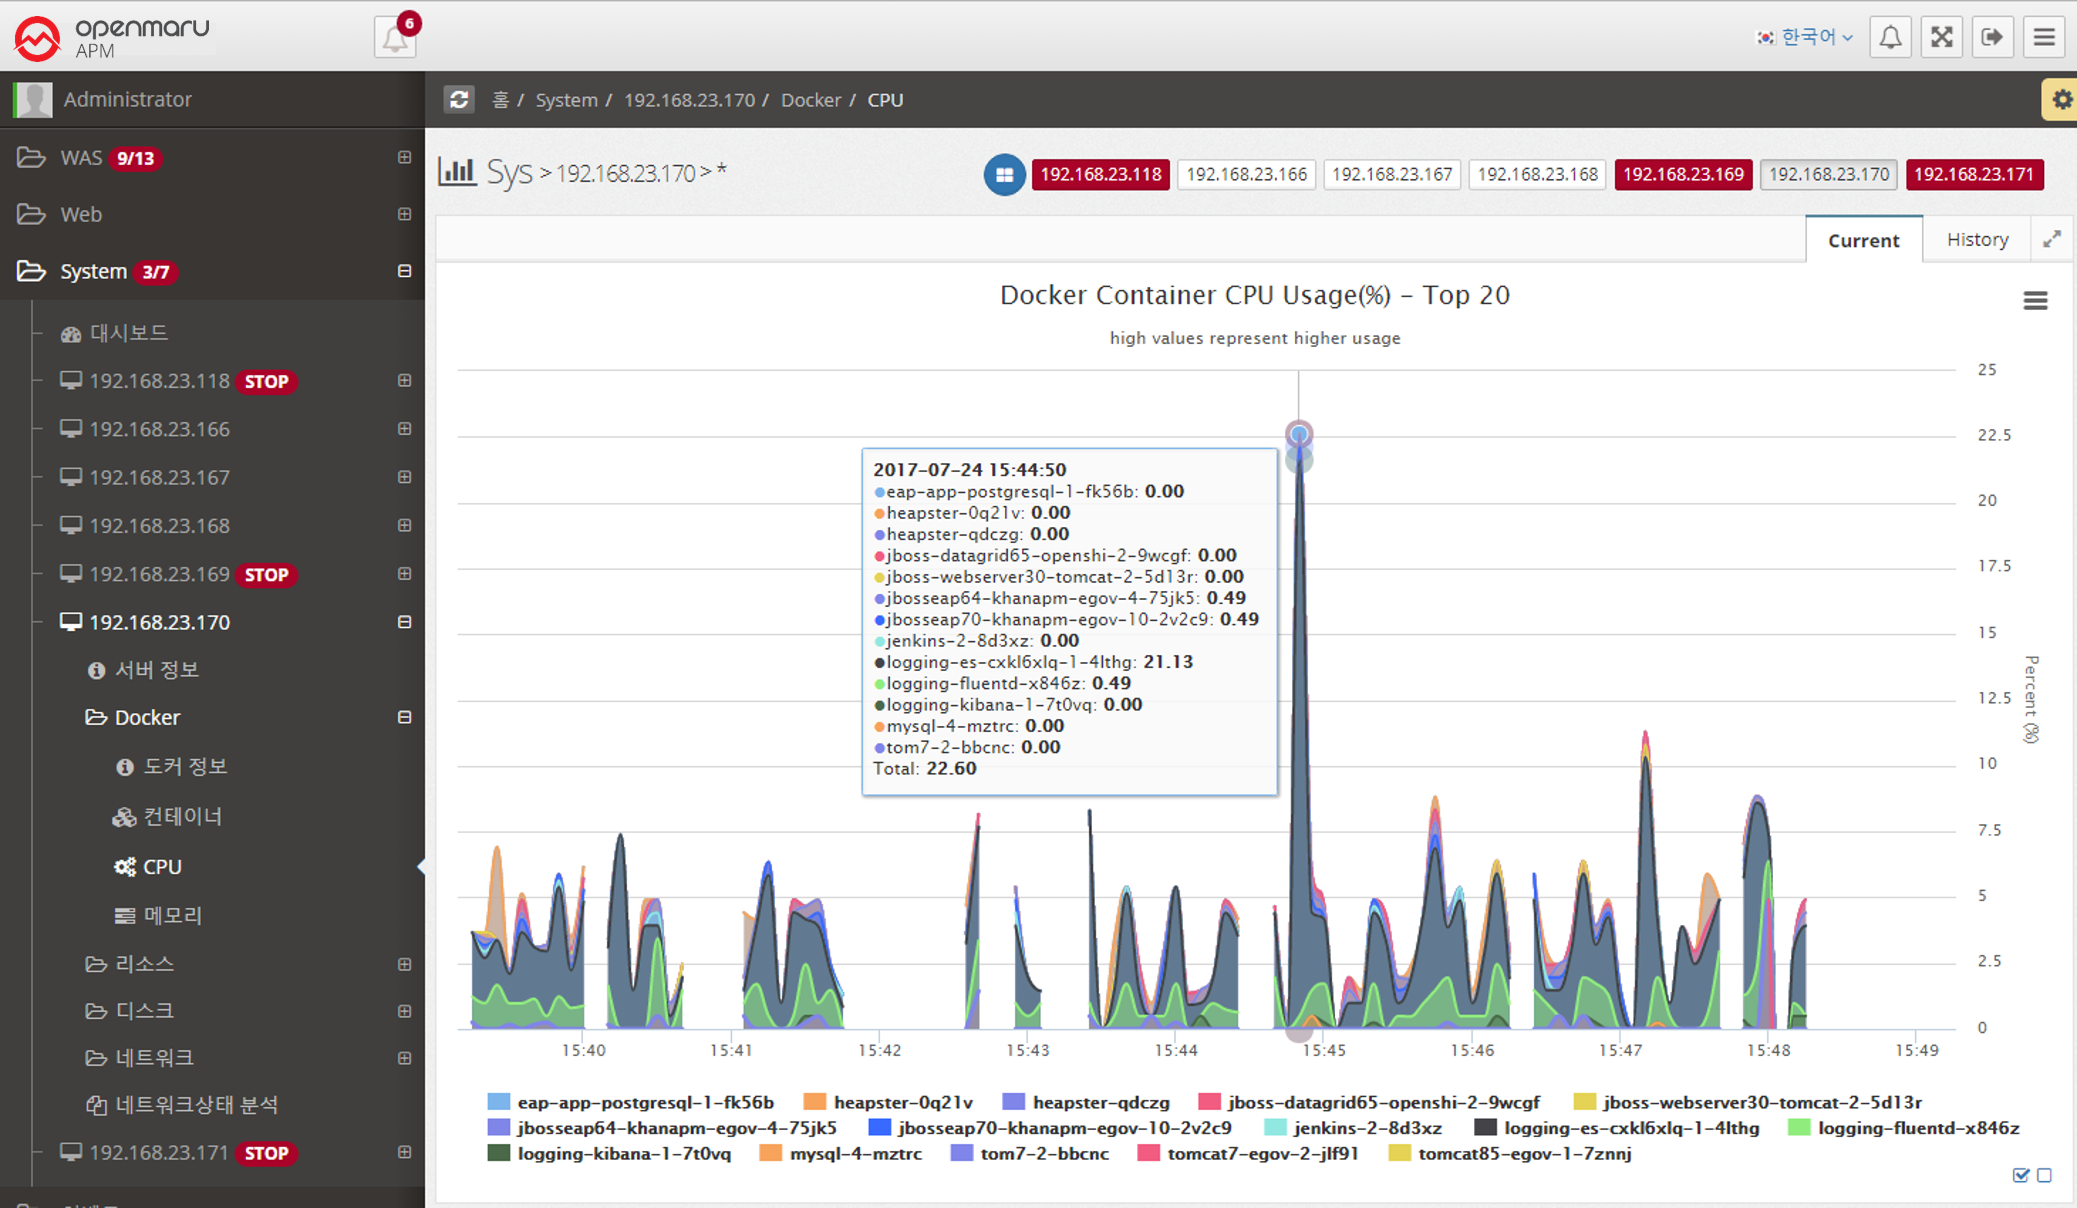
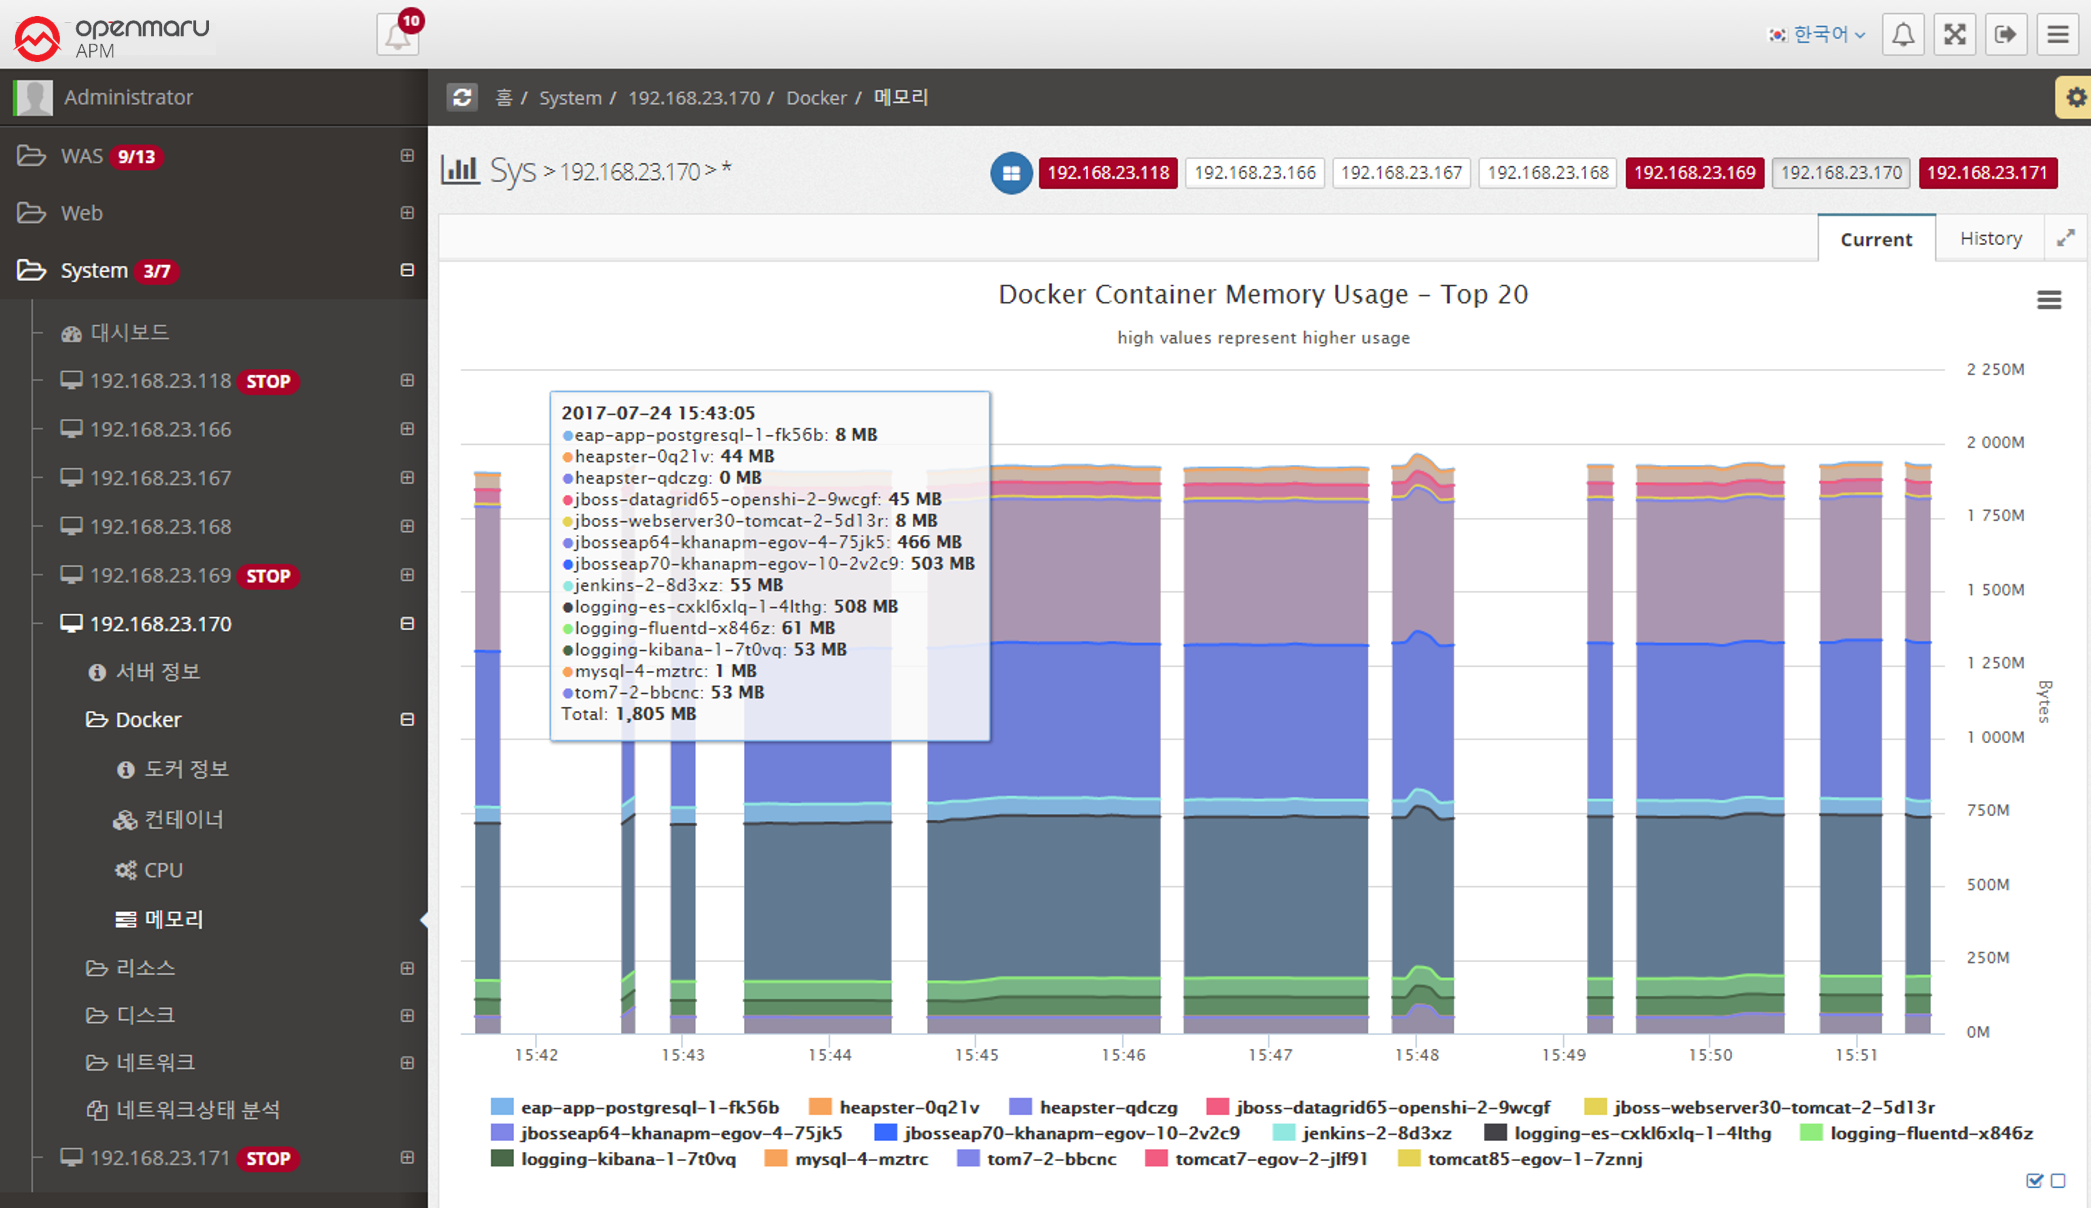
System > Docker > Containers
You can check the current container status.
Running, Stopped, Paused, and Number of Images
2.5.3 System - Resources
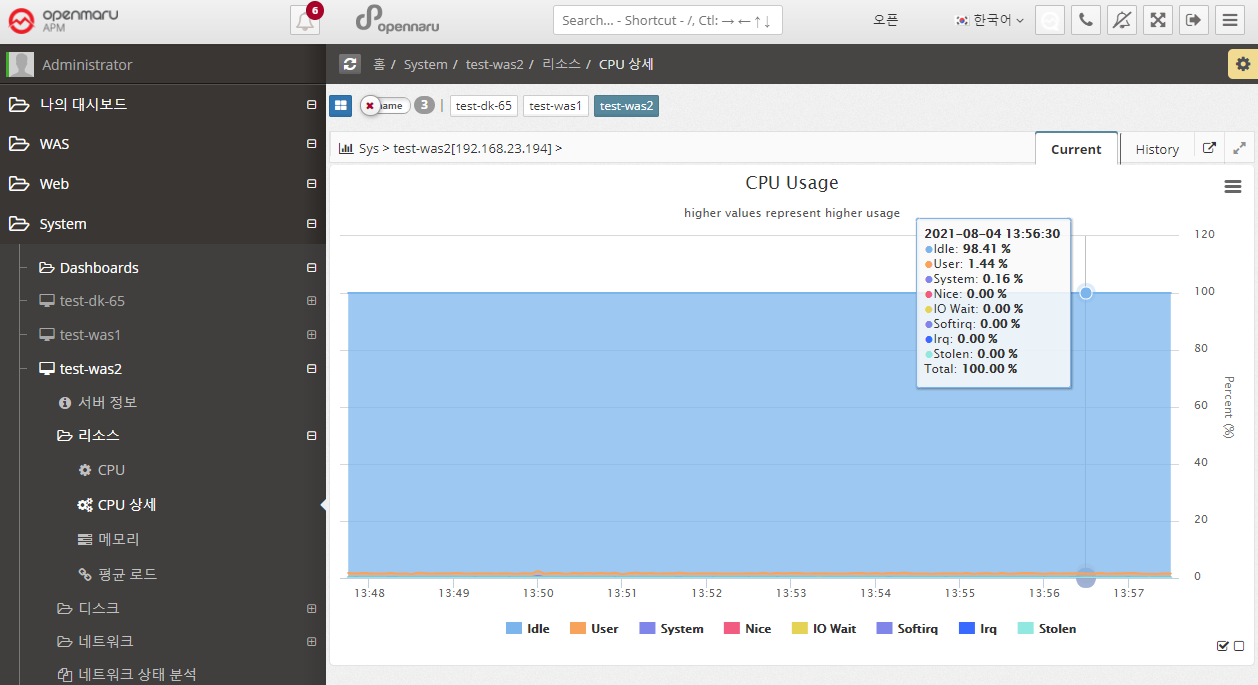
System > Resources > CPU Details
Displays a graph of all items of the system’s CPU utilization.
The meaning of each item is as follows
| Item | Description |
|---|---|
User |
CPU utilization by user (application) |
Nice |
CPU utilization for applications running with Nice priority |
System |
CPU utilization at the system level (kernel) |
Iowait |
Percentage of CPU used or idle due to processing disk I/O requests |
Irq |
Percentage of CPU used to handle interrupts |
Softirq |
Percentage of CPU used to handle software interrupts (Softirq) |
Stolen |
Percentage of CPU lost in a virtualized environment |
Idle |
Percentage of CPU not in use |
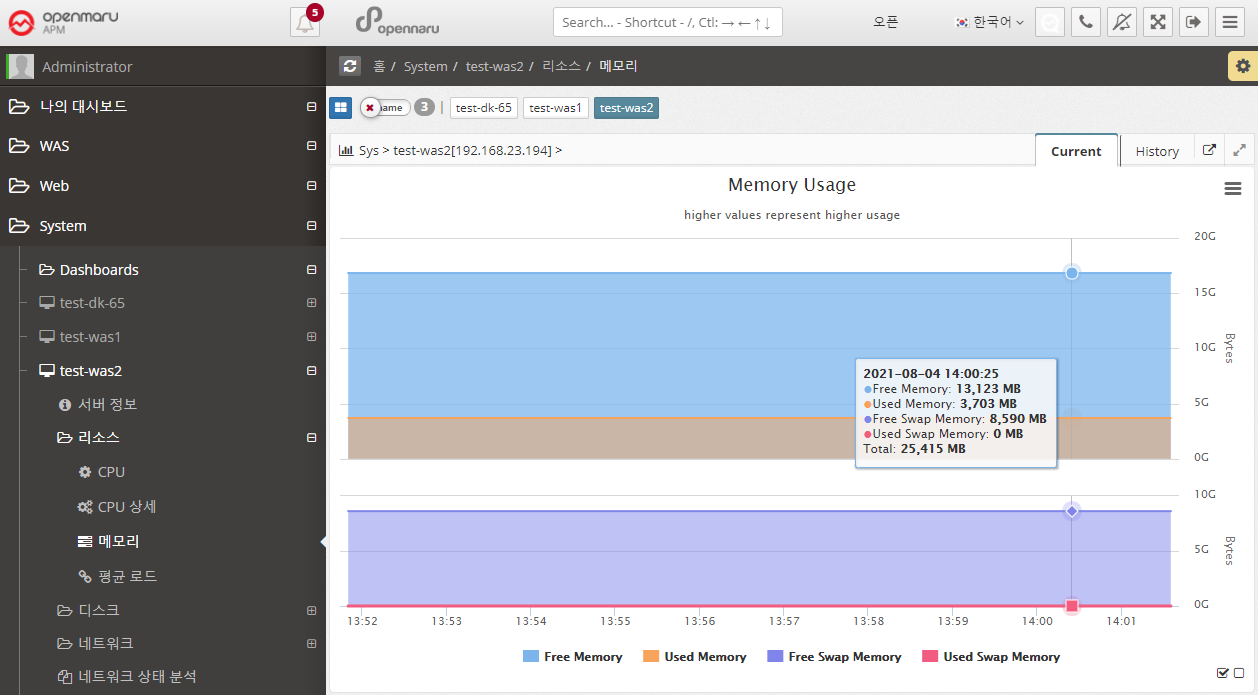
System > Resources > Memory
Graphically displays the system’s memory usage and swap usage. It displays total memory and the amount of memory currently in use, as well as the total swap memory size and swap memory usage that you have set. Swap memory is a way to use the file system on disk as memory. Therefore, unless the system suddenly runs out of physical memory, using swap memory in the operating system will significantly reduce the overall performance of the system. It also has a significant impact on the performance of JVM > applications running on the OS, so it’s a good idea to check Swap usage.
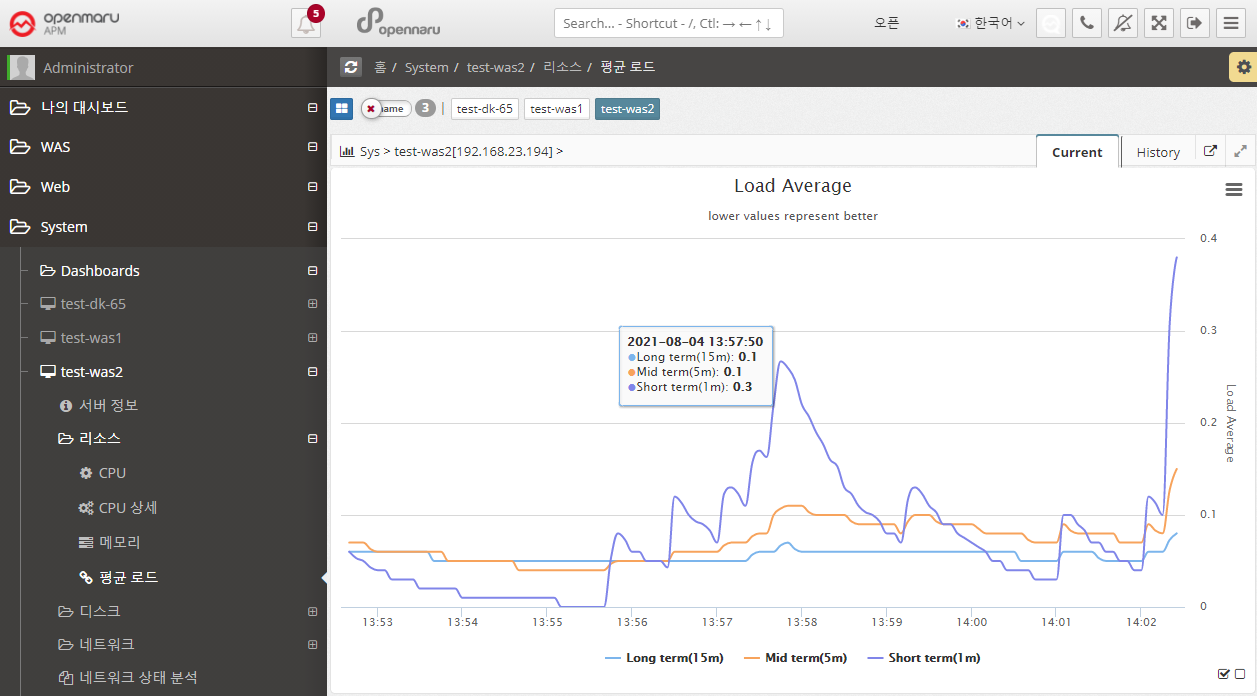
System > Resources > Average Load
Graphically display the average load of the system.
| Item | Description |
|---|---|
Short Term |
The average number of processes waiting to run in one minute. |
Mid Term |
The average number of processes waiting to run in 5 minutes. |
Long Term |
The average number of processes waiting to run in 15 minutes. |
A high Load Average can indicate that the system is overloaded. If you have a system with 1 core, a load average of 1 means that it is using all of its cores. Most system administrators agree that a Load Average of 0.7 or higher will sooner or later lead to an overload situation, so it’s a good idea to find the cause and fix it. If it’s above 1.0, you need to find and fix the problem immediately. If it’s over 5.0, it’s really serious. If left unchecked, the system will either hang or slow down significantly.
On multi-core systems, the average load value is affected by the number of cores available. If it is 100% utilized, it will show 1.0 on a single core and 2.0 on a dual core. Naturally, it would be 4.0 on a quad-core system with four cores.
It also shows the 1, 5, and 15 minute averages, so if the 15 minute average is over 1.0 on a single core, it means you are in a constant overload situation.
Of course, the Current chart shows the 1-, 5-, and 15-minute averages better, but the History chart shows averaged data over hours and tens of minutes, so the 1-, 5-, and 15-minute averages are almost identical overall.
To check the current CPU and Core count of your system, go to System - Server Information and check the 'CPU' section.
2.5.4 System - Disk
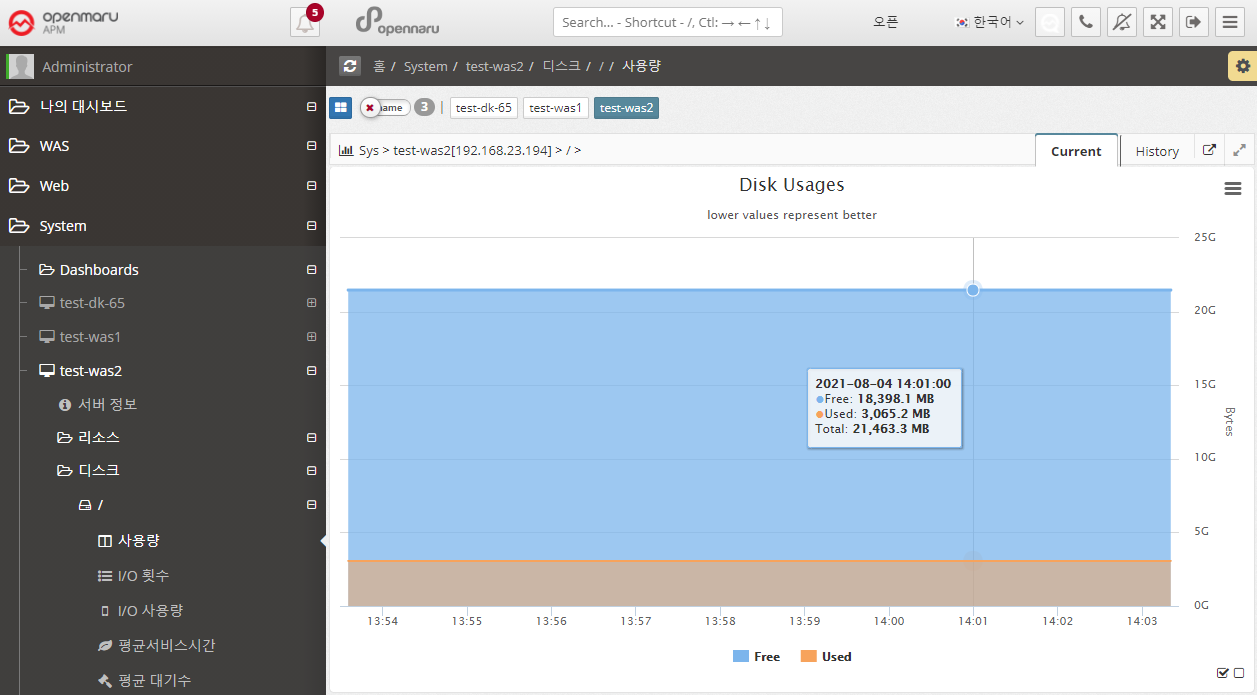
System > Disk > Usage
Displays the system’s disk usage graphically for each partition. It shows the total size and usage. Because it calculates and displays usage in bytes, the size will be slightly different from the size output by df, which displays in blocks.
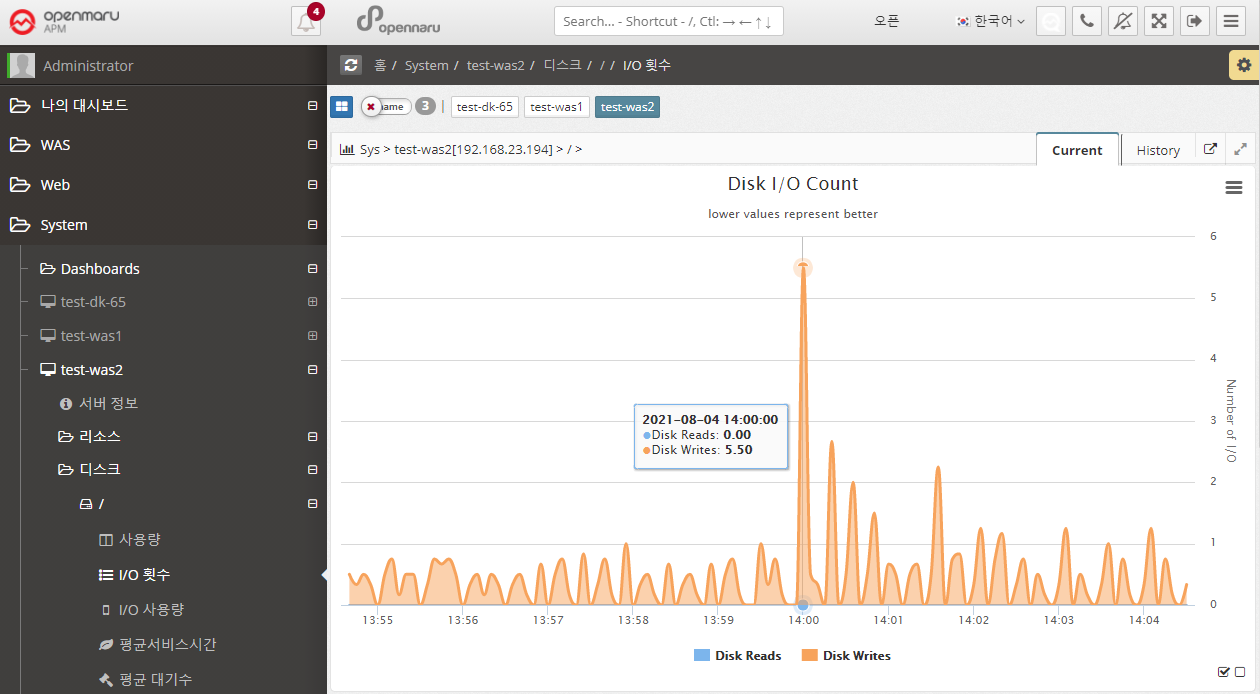
System > Disk > I/O Counts
Displays the number of disk I/Os for each partition in the system, separated by Read / Write.
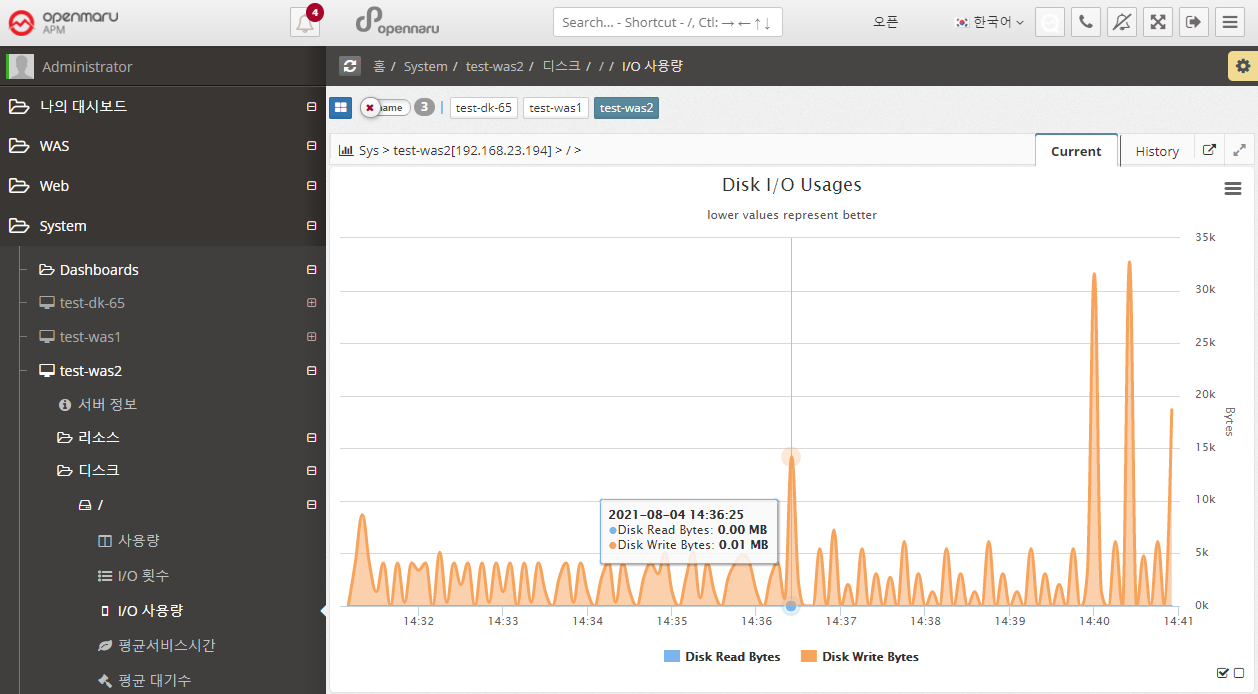
System > Disk > I/O Usage
Displays the amount of disk I/O bytes for each partition in the system, separated by Read / Write.
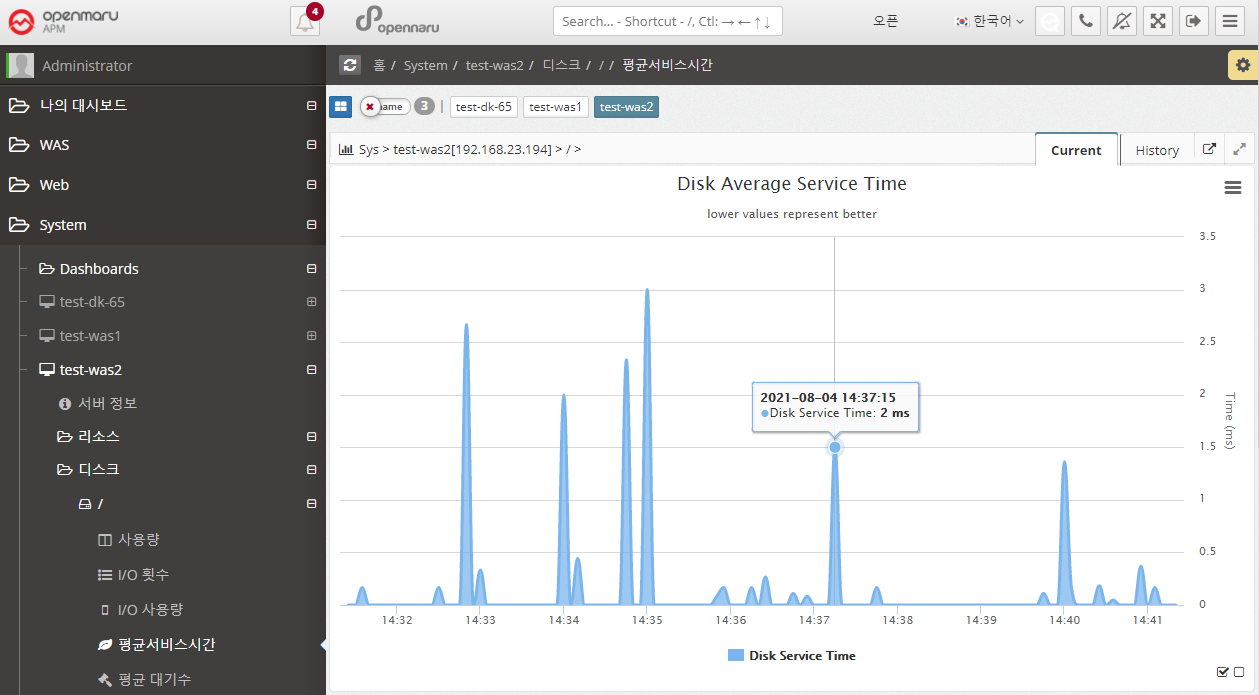
System > Disk > Average Service Time
Disk Average Service Time (ms) shows the average amount of time it took to process a disk read/write request. This time does not include the time spent waiting in the queue for processing. A service time of 10 ms or less is considered a good value. Anything above 20 ms is a potential bottleneck.
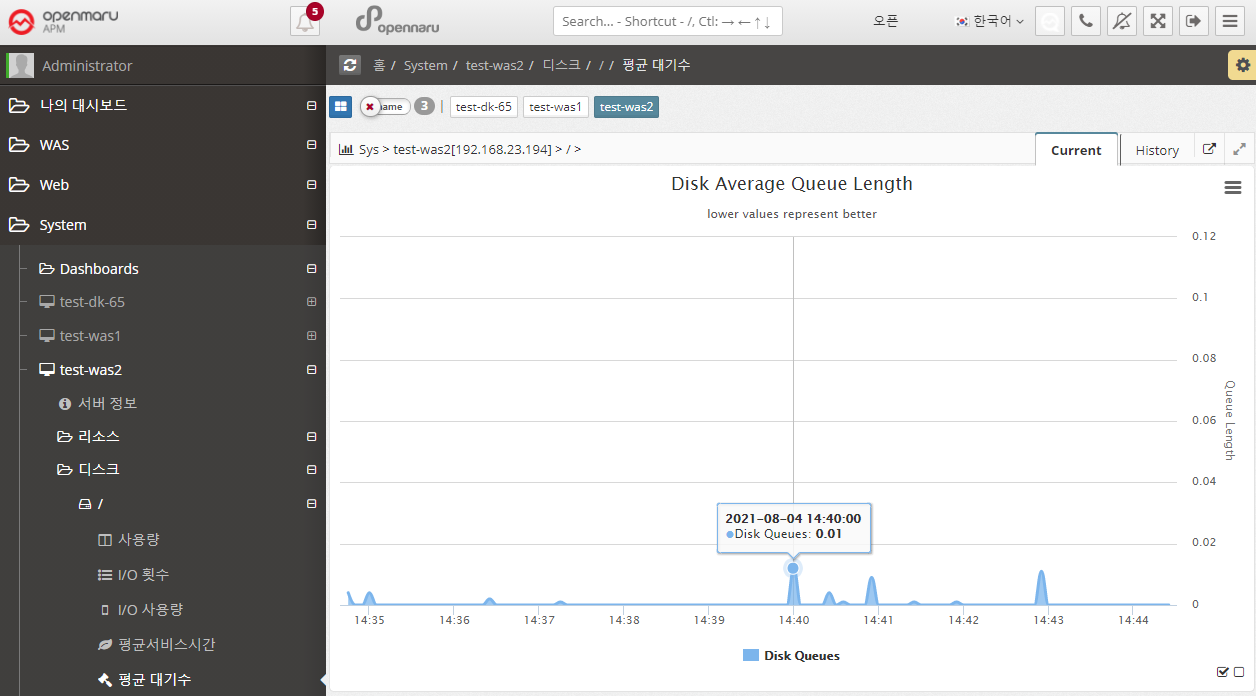
System > Disk > Average Wait
Graphically displays the average size of the queue of requests waiting for disk writes/reads.
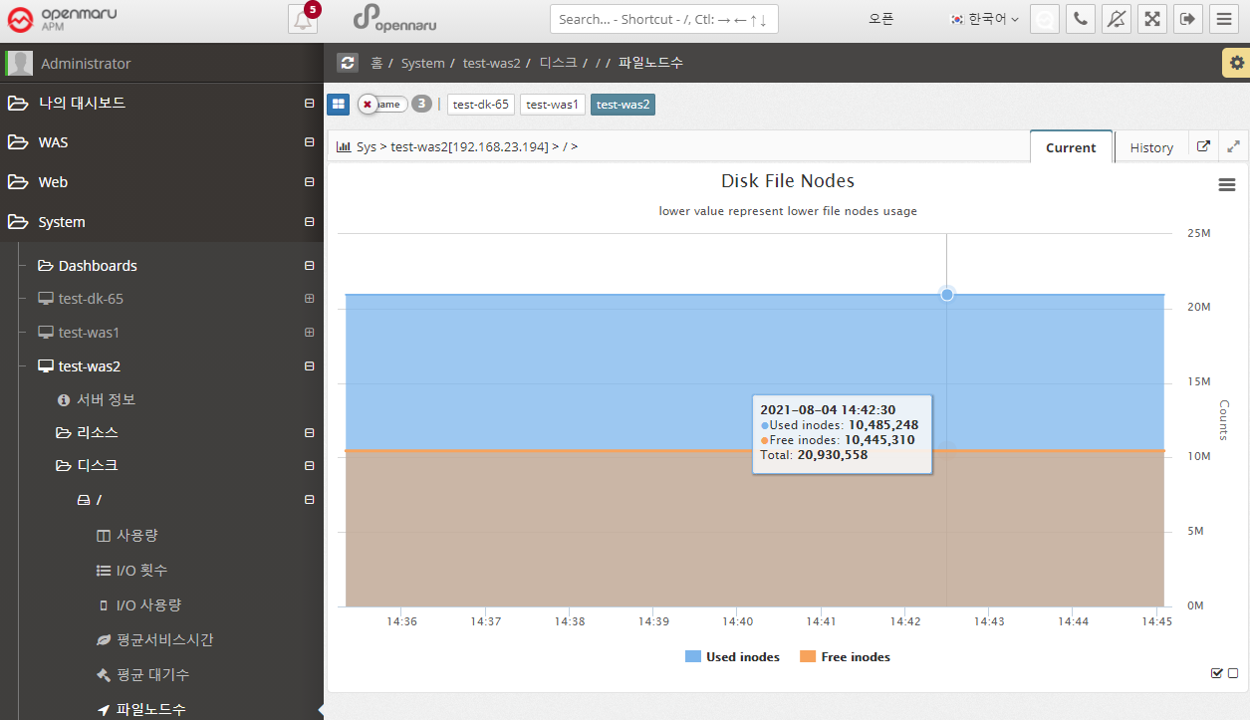
System > Disk > File Node Count
File Node Count graphs the number of inodes. An inode is a data structure used by Unix-like file systems that holds information about the file system, such as files and directories. Each file has one inode, which contains information about the file, such as the owner group, access mode (read, write, execute), and file type. Files within a file system are identified by their unique inode number.
Typically, when a file system is created, about 1% of the total space is allocated for inodes. Once the number of available inodes is used up, no more files can be created, even if disk space is available. You can easily run out of inodes by creating too many files in one directory.
2.5.5 System - Network
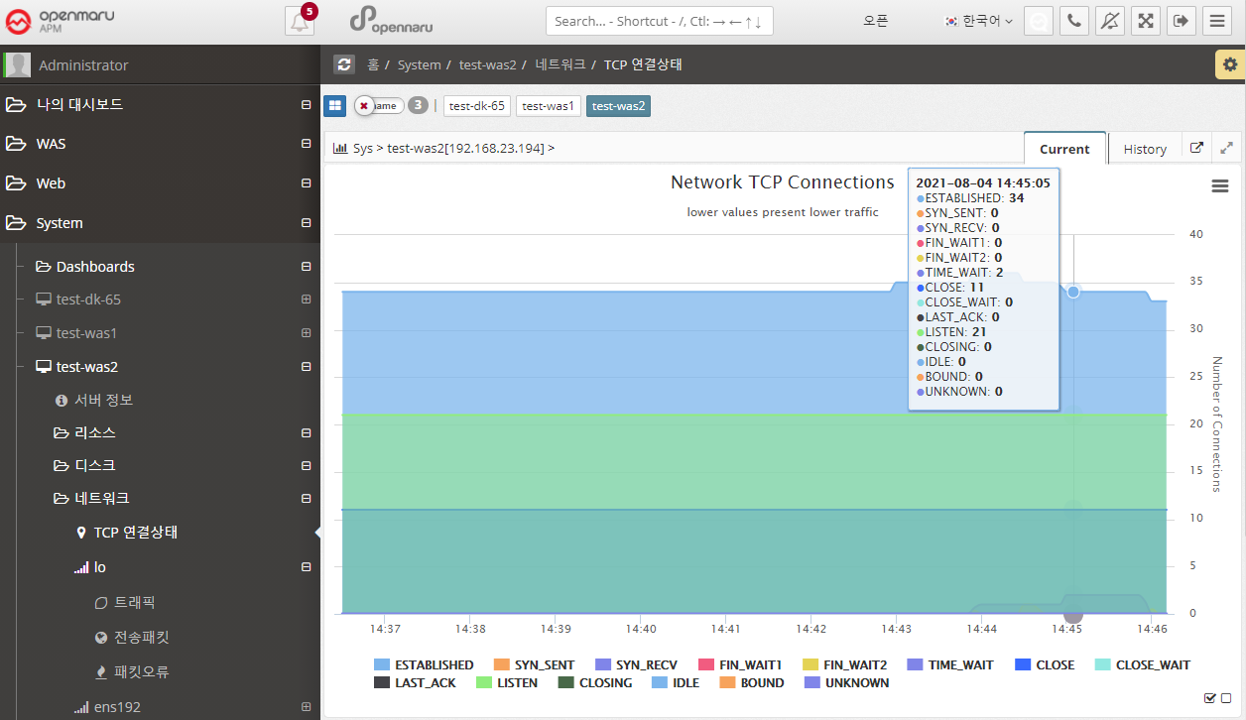
System > Network > TCP Connection Status
Displays the system-wide Network TCP connection status information in a graph.
Each item looks like this
| Item | Description |
|---|---|
LISTEN |
The port is open and waiting for a connection request so it can receive the request. |
SYN_SENT |
The local has attempted to remotely signal a connection request (SYN). |
SYN_RECV |
Connection request received from the remote The request was received and responded with SYN and ACK signals, but no ACK was received. If there are a lot of SYN_RECVs, you can suspect a TCP SYNC Flooding attack. |
ESTABLISHED |
Still connected to each other. |
FIN_WAIT1 |
The socket is closed and the connection is being terminated, but you can still receive responses from the remote. |
FIN_WAIT2 |
The local connection is waiting for a request to close the connection from the remote. |
CLOSE_WAIT |
The local connection has received a remote connection request and is waiting for the connection to be closed. FIN and ACK signals are received from the remote and an ACK is sent to the remote. |
TIME_WAIT |
The connection is closed but waiting for an acknowledgment signal from the remote. You will see this value a lot when Apache has KeepAlive turned off. |
LAST_ACK |
The connection is closed and waiting for an acknowledgment. |
CLOSE |
The connection is completely closed. |
CLOSING |
Connection closed but data was lost in transit |
UNKNOWN |
The socket status is unknown. |
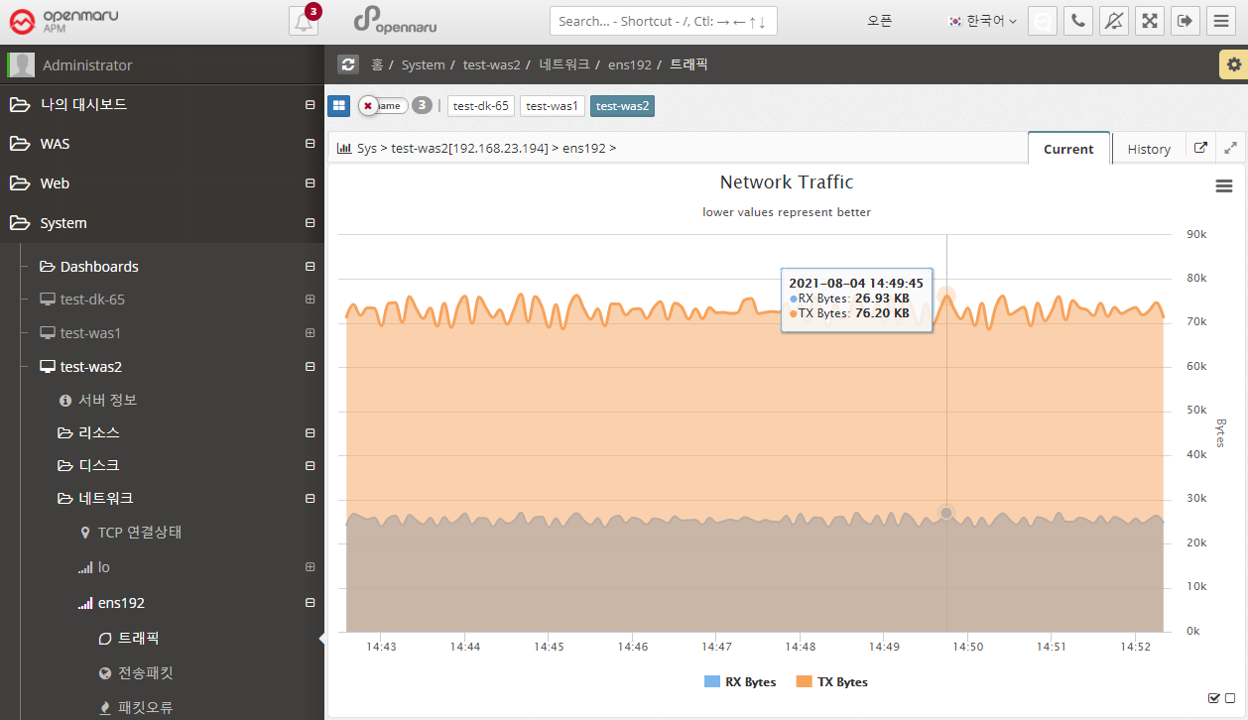
System > Network > Traffic
Graphically displays the number of send and receive bytes per second of data for each network interface card in the system.
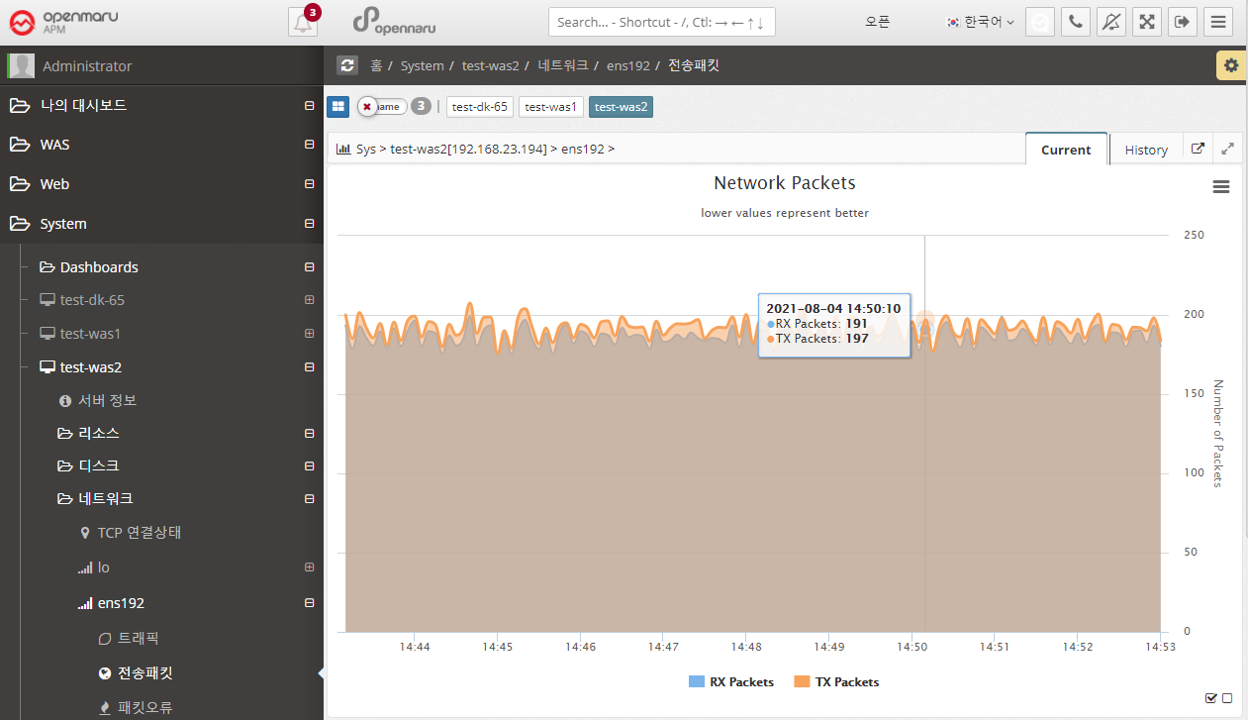
System > Network > Transmission Packets
Graphs the number of send/receive packets per second of data for each network interface card in the system.
System > Network > Packet Errors
Graphs the number of packet errors per second of data for each network interface card in the system.
If you are experiencing packet errors or drops, it is likely that you are experiencing excessive network load. It is recommended to check the network or operating system kernel parameters (network related).
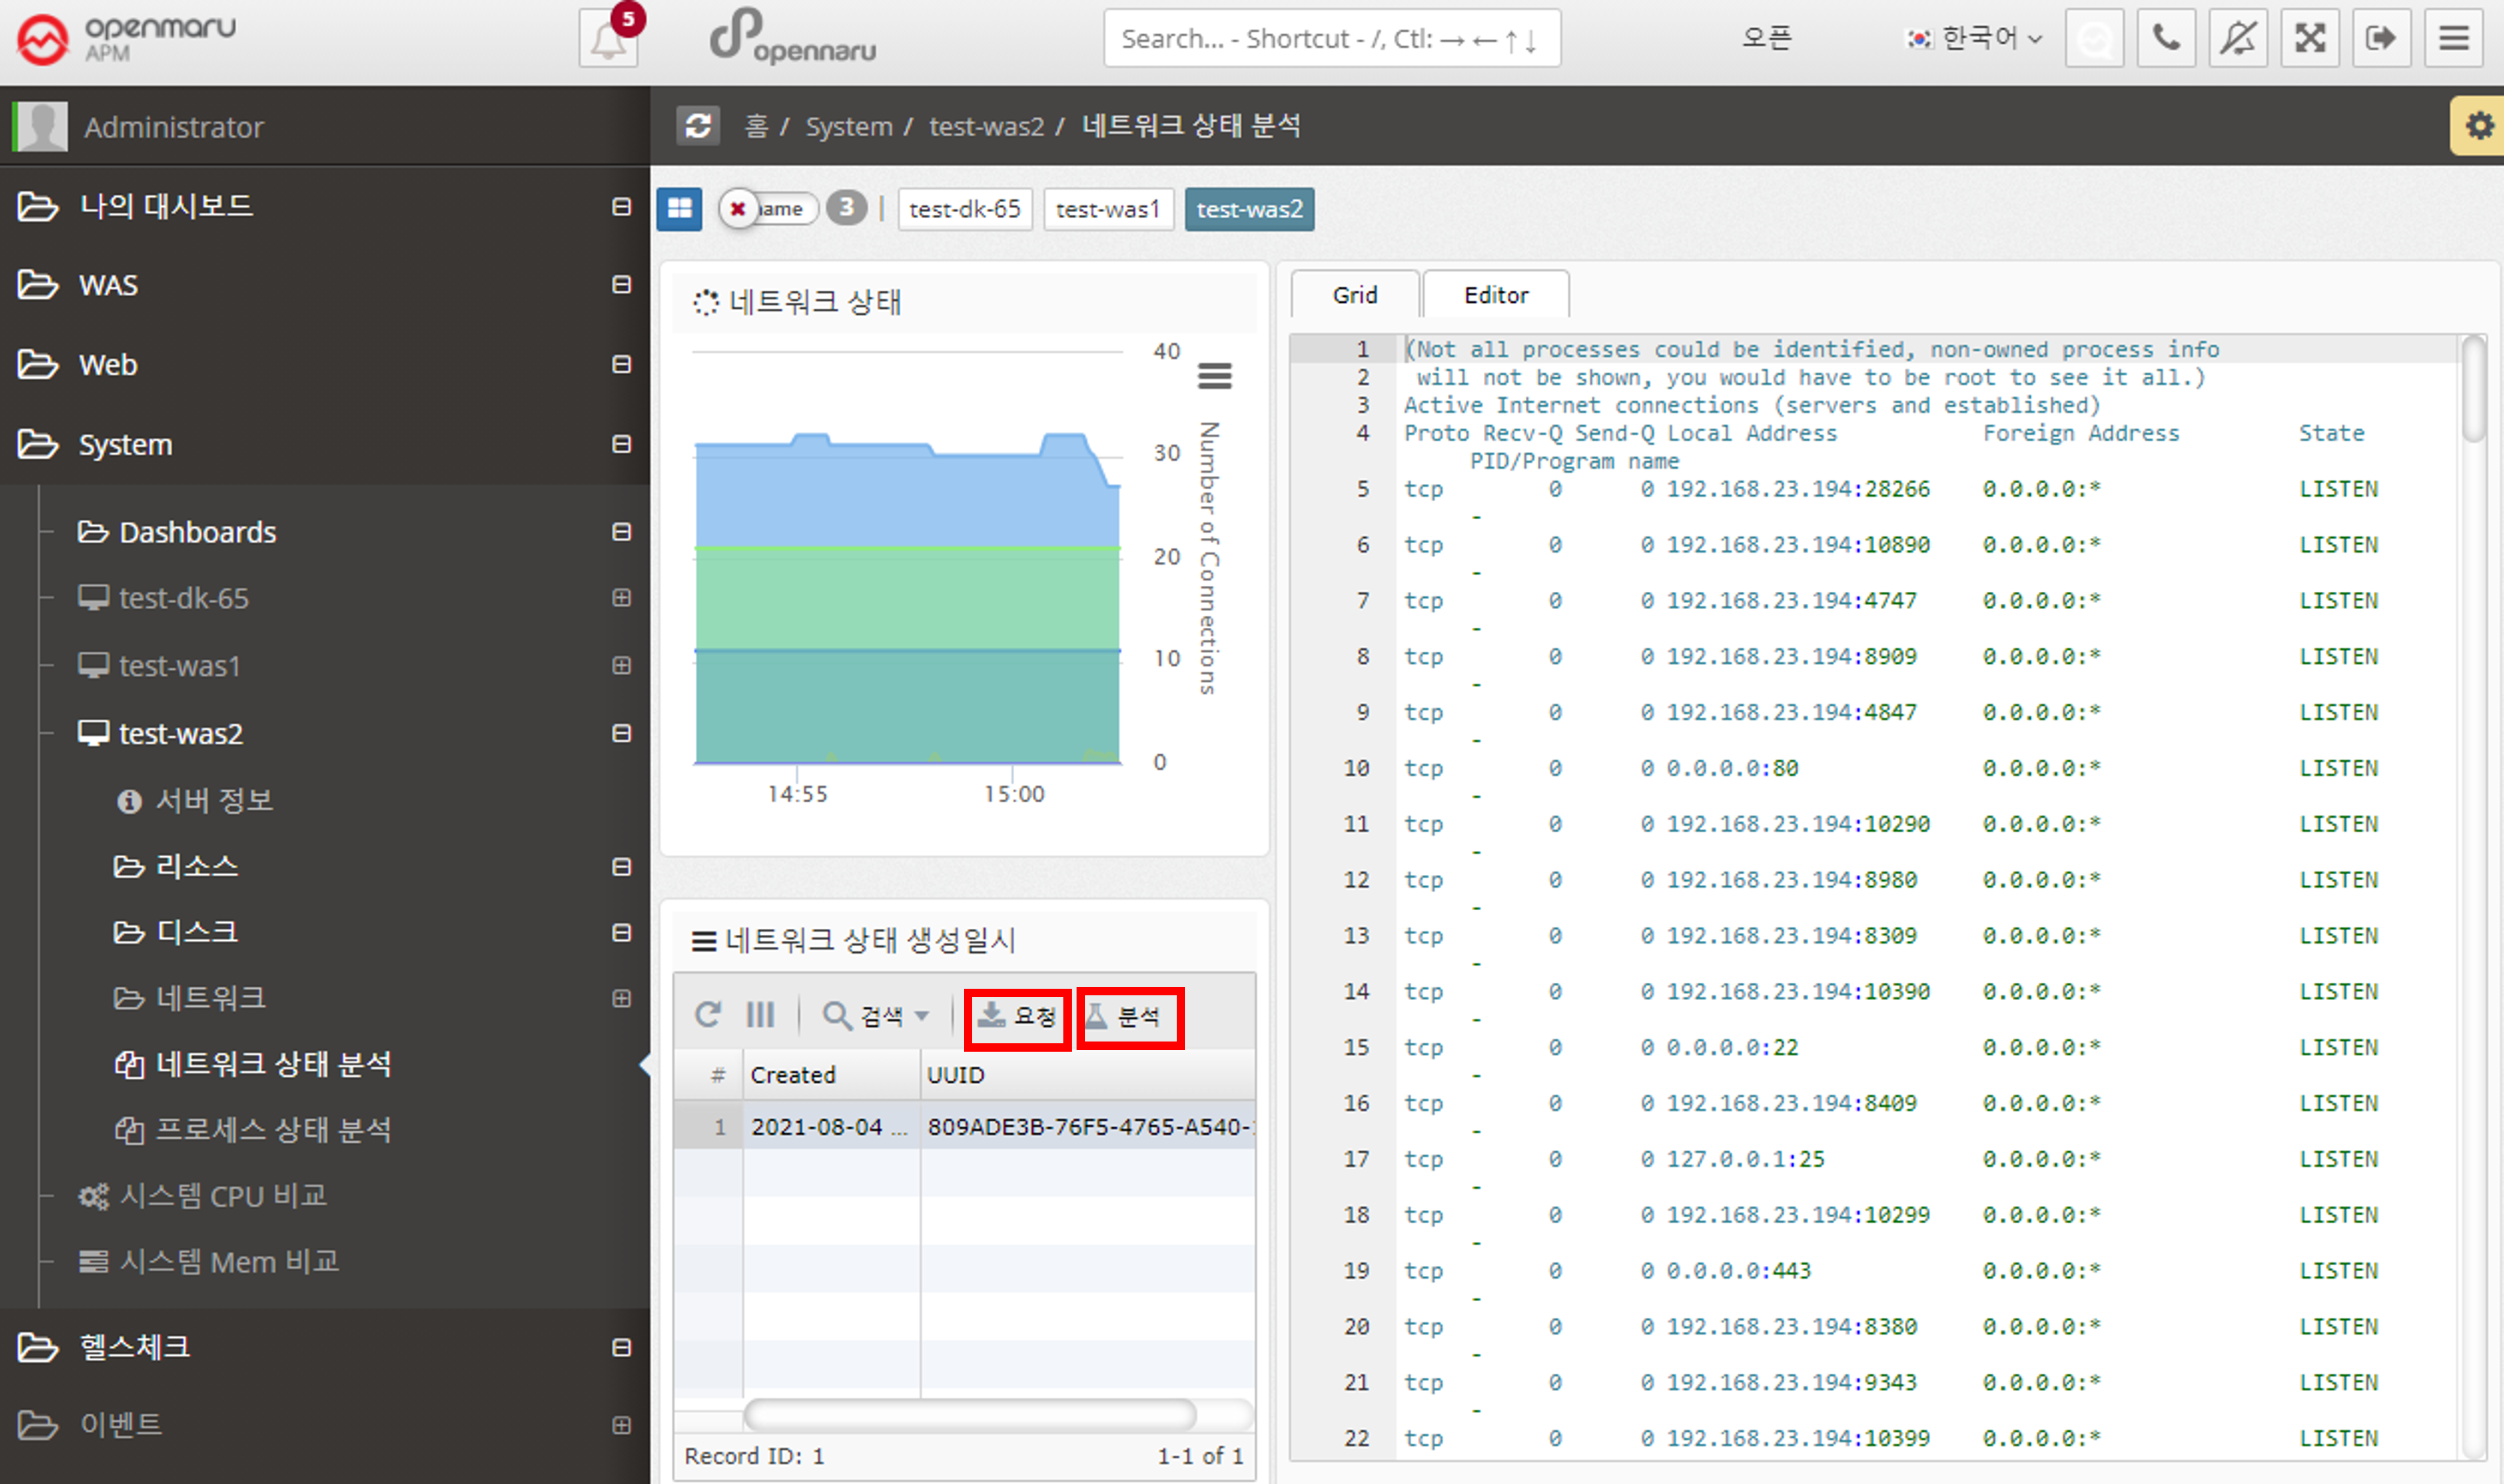
2.5.6 System - Network Status Analysis
In 'System > Network > TCP Connection Status', you can only check the status of TCP connections by counting them. If a certain item becomes excessively large, it is necessary to check which port or IP address is causing this situation. You can analyze the status of individual TCP connections at the current time by clicking the 'Request' button on the left side of the network status analysis.
Each time you click the 'Request' button, the server stores the data at the current time, and when you click the 'Analyze' button, the information is displayed on the right.
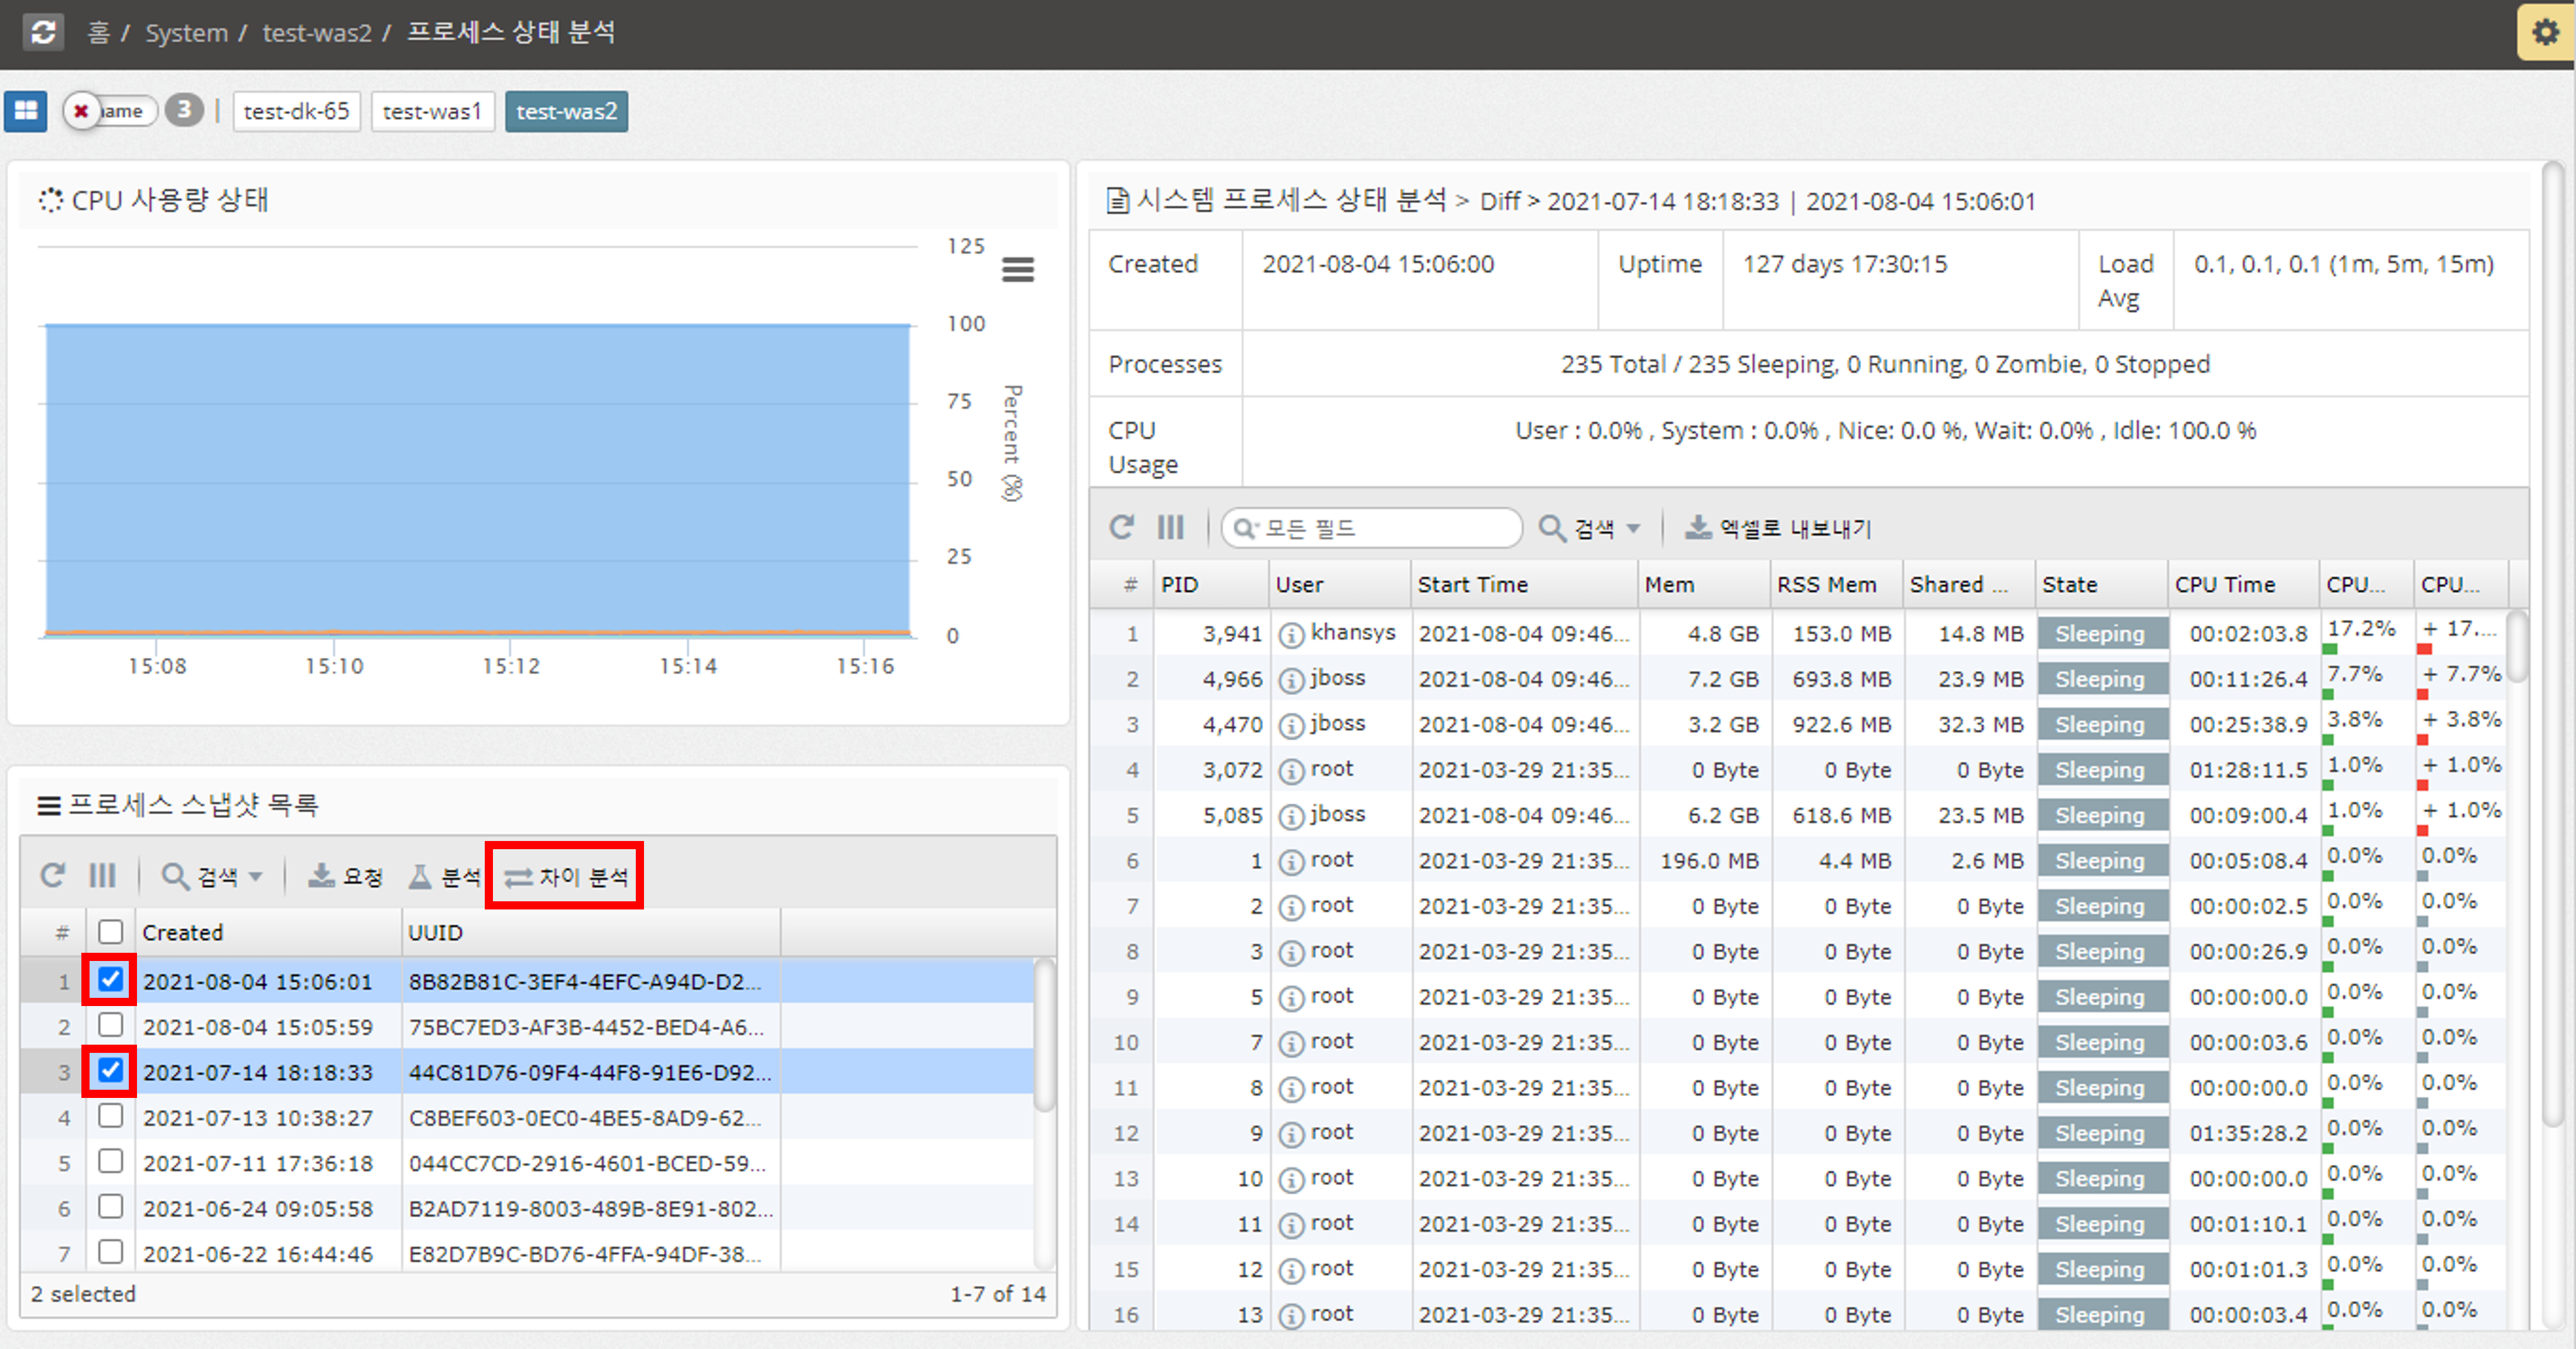
2.5.7 System - Analyze process status
You can analyze the status of processes in the system.

You can check the percentage change in CPU/MEMORY usage of a process before and after using 'Difference Analysis'.
2.6.1 SLA Monitoring
Author |
Version |
Date |
Yugunmo |
v1.1 |
2021-09-06 |
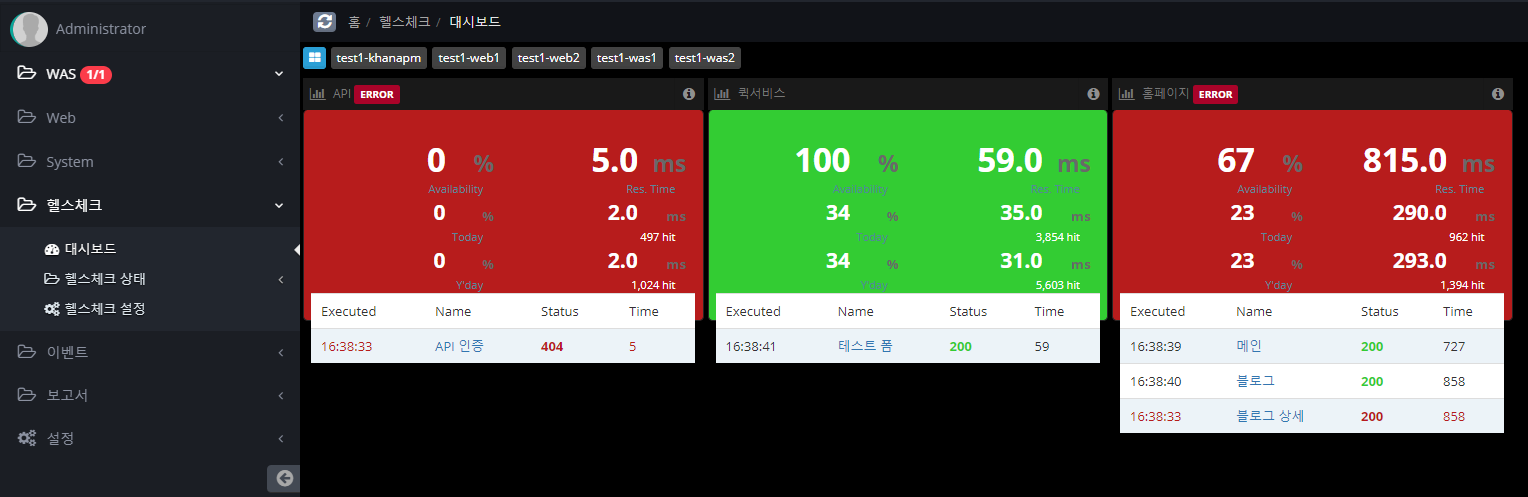
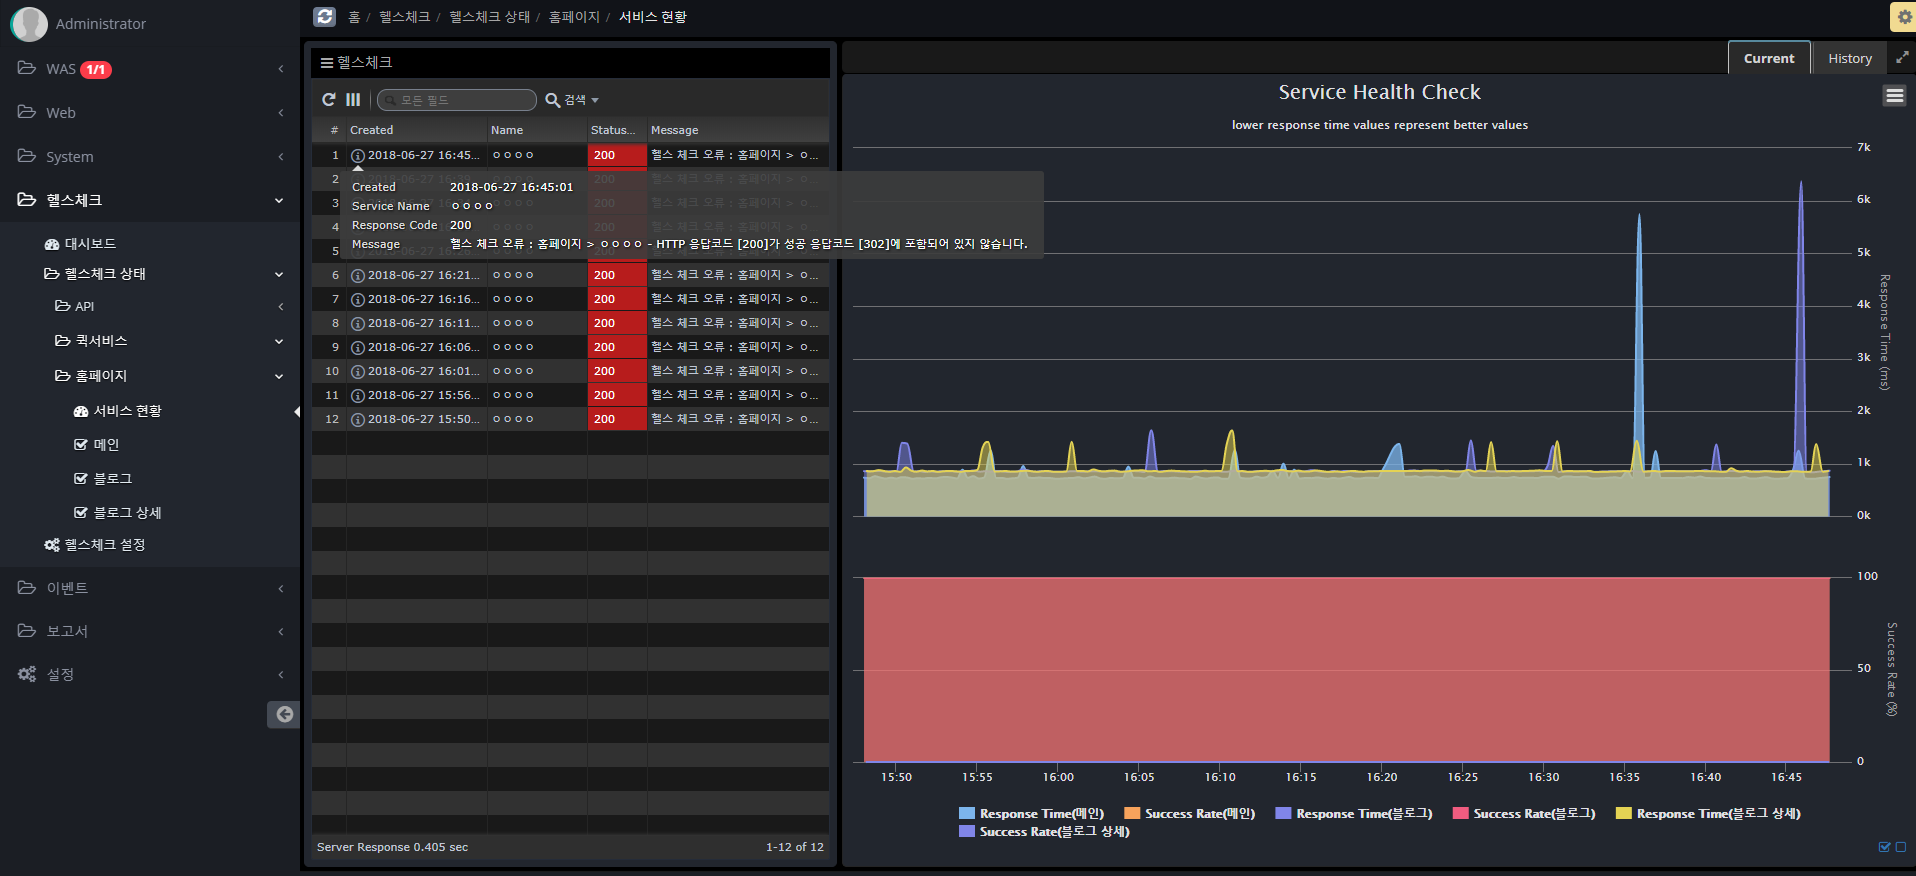
Health Check is a feature that monitors HTTP-based applications.
It runs in the system agent and works with JDK 1.8 or later.
Dashboards
The dashboard displays information about real-time success rate, average response time, current day and previous day data.
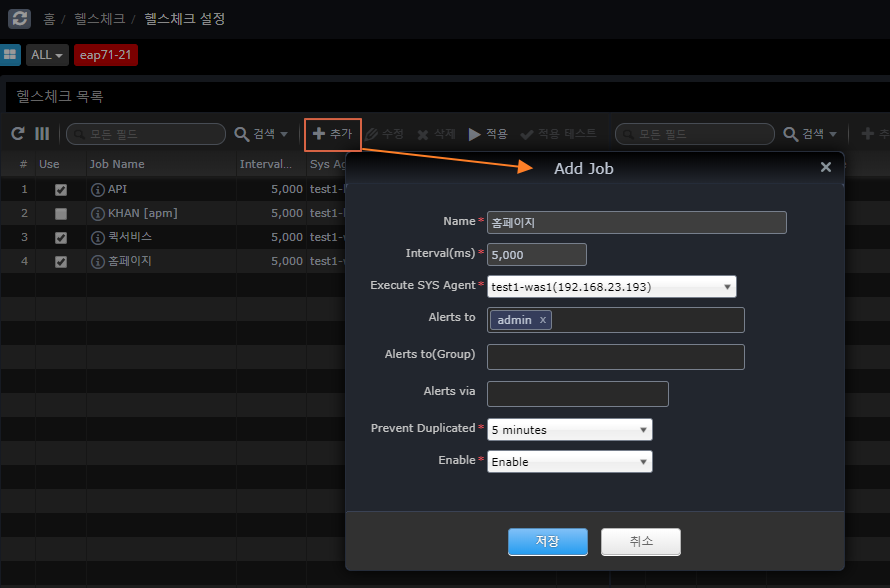
Health check settings
Follow the steps below to register a Health Check item.
You can set it up similarly to Postman, a Rest API testing tool, or JMeter, a tool used for load testing.
-
Register a Job A Job is a group of services that share a cookie (Session). +]
Name |
Name for the Job |
Interval(ms) |
Repeat Cycle |
Execute SYS Agent |
SYS Agent to execute |
Alerts to |
Who to notify on failure |
Alters to(Group) |
Group of people to be notified on failure |
Alters via |
email, sms, slack (Slack will be sent even if you don’t specify it.) |
Prevent Duplicated |
Prevents repeated notifications after a failure notification. |
Enable |
Whether to monitor jobs |
Apply
After completing the settings and modifications, click the Apply button to send the contents of the entire Job to each Agent to be reflected.
Test
Runs a trial test for the selected Job and displays the result on the screen.
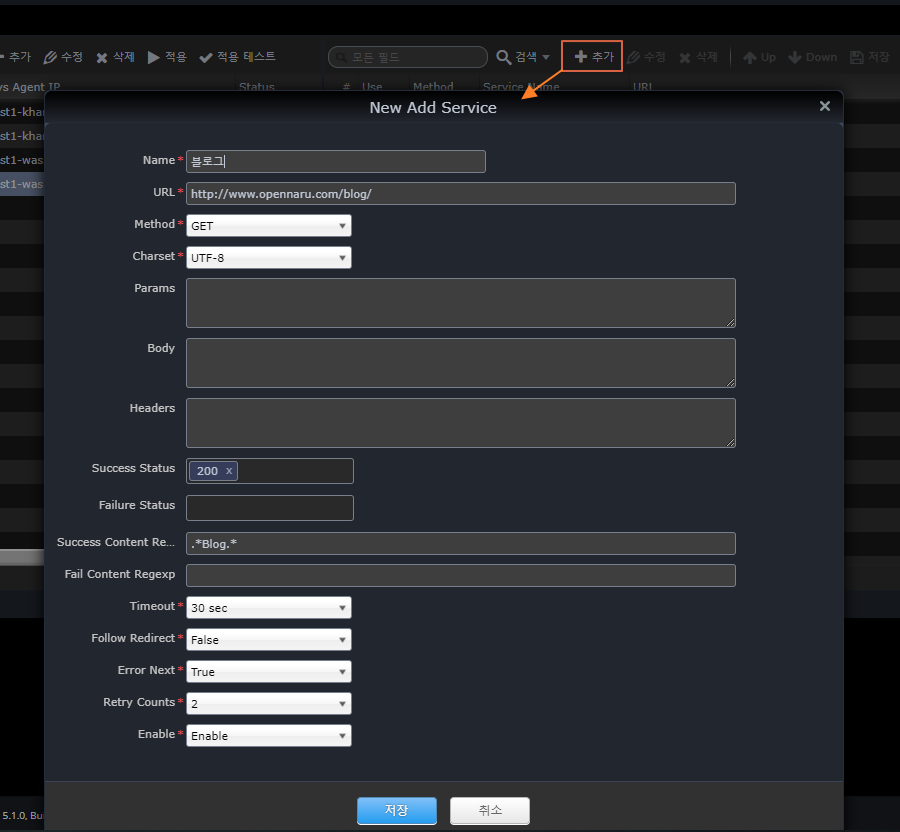
* Register Service
+]
Name |
Service name |
URL |
Call URL |
Method |
HTTP Method |
Charset |
Character encoding |
Params |
Parameters for POST, PUT, and DELETE + Parameters for POST, PUT, and DELETE.
Example) test1=1 |
Body |
Requested content body for POST, PUT, DELETE |
Headers |
HTTP Header |
Success Status |
HTTP status code to determine success |
Failure Status |
HTTP status code for failure |
Success Content Regexp |
Response content body content that is considered successful (regular expression) |
Failure Content Regexp |
Response content body content judged to be a failure (regular expression) |
Timeout |
Time to wait for a response after a request |
Follow Redirect |
Whether to continue if the HTTP status code is 302 |
Error Next |
Whether to proceed to the next service in case of failure |
Retry Counts |
Number of retries on failure |
Enable |
Whether to enable the service |
2.7.1 Warning Policy
This is a menu where you can check the policy settings and events that occurred to alert the operator based on the statistical information of the monitored WAS and system data.
If a warning event occurs for every item, it is likely that too many events will occur, so it is recommended that the warning event is triggered based on real-time statistics so that the warning event is triggered only when there is a real possibility of a problem.
Setting up alerting policies
You can set the alert policy for each WAS instance, Web server, and system.
WAS instance warning items
| Item | Description |
|---|---|
User Satisfaction Index (APDEX) |
You can set the warning level to Warning or Critical based on the user satisfaction index (APDEX). |
Pending Transactions |
Set alert policy based on the number of pending transactions. |
Error Transactions |
Set a warning policy based on the number of transaction error states. |
JVM Heap Utilization |
Set the heap utilization of the JVM |
GC Time Percentage |
Set to the percentage of time spent in GC out of the total time. |
Error rate |
Set to the error rate determined by the application’s status code. |
Database query average response time |
Set based on the average response time of database queries. |
Database Connection Pool Utilization |
Set based on the utilization of the database connection pool. |
JVM Perm Utilization |
Set to the utilization of the JVM’s perm area. |
WEB Server Instance Warning Items
| Item | Description |
|---|---|
Worker Utilization |
Set alert policy based on web server resource utilization |
Web Server Traffic |
Set based on the amount of bytes of traffic handled by the web server |
System warning items
| Item | Description |
|---|---|
CPU Utilization |
Set based on your system’s CPU utilization |
Memory Utilization |
Set based on the system’s memory utilization. |
Swap Memory Utilization |
Set based on the system’s swap memory utilization. |
Disk Utilization |
Set based on system disk utilization |
Network Packet Error Rate |
Set based on the error rate of network packets. |
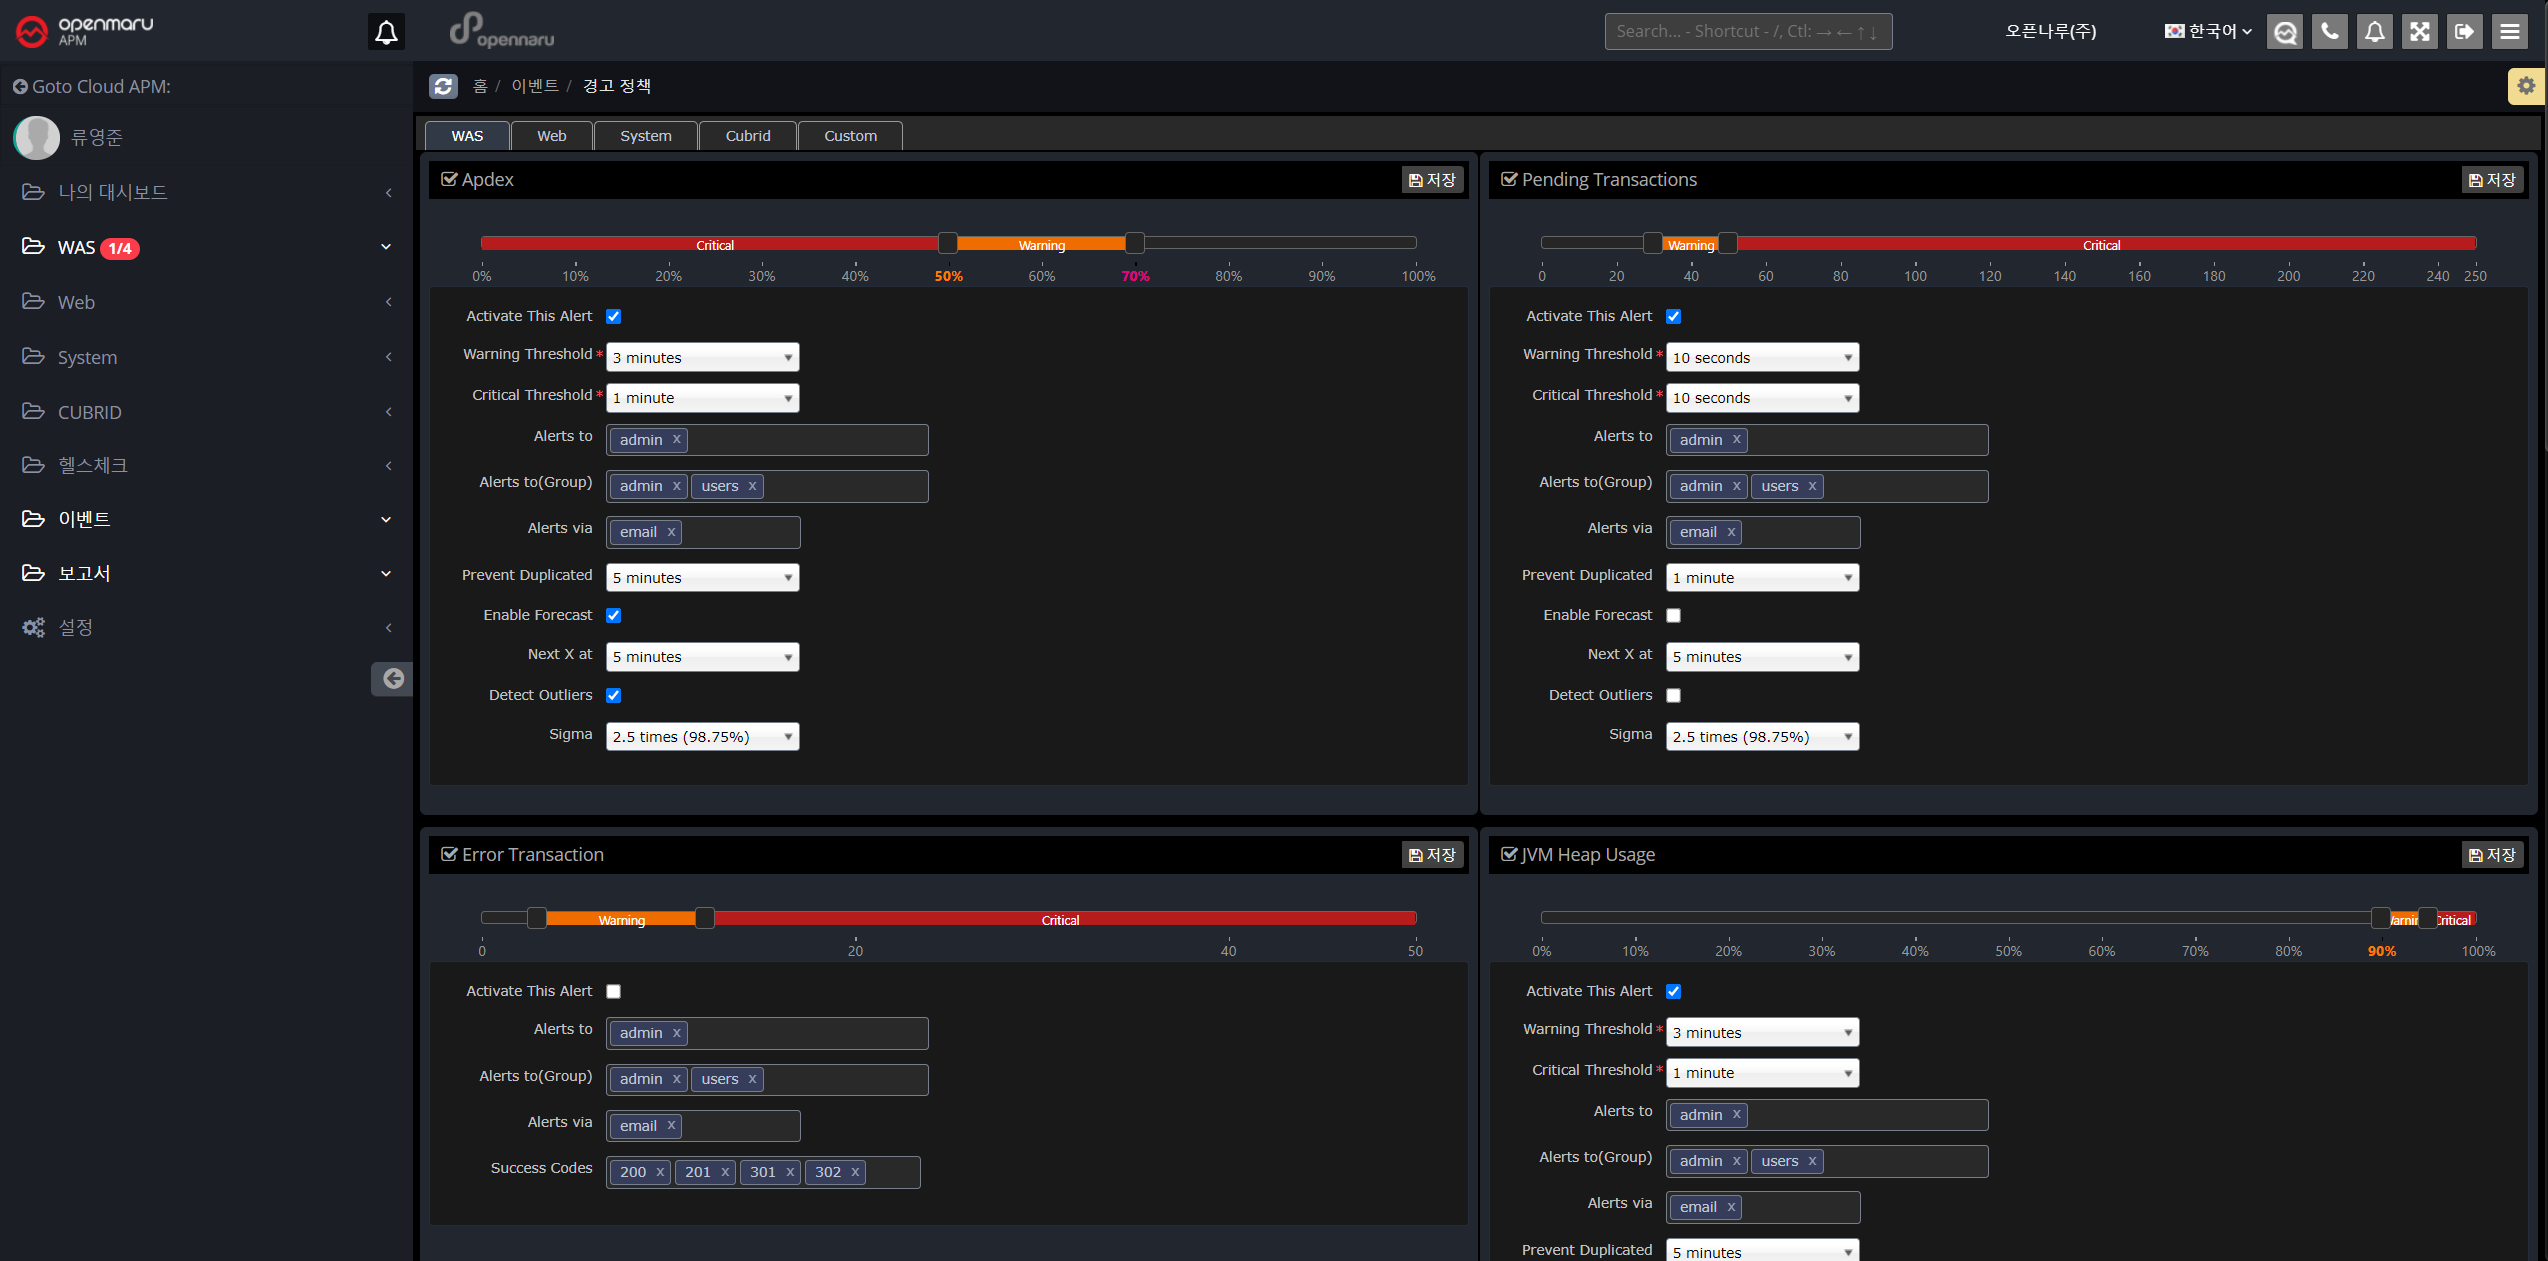
Warning setting items
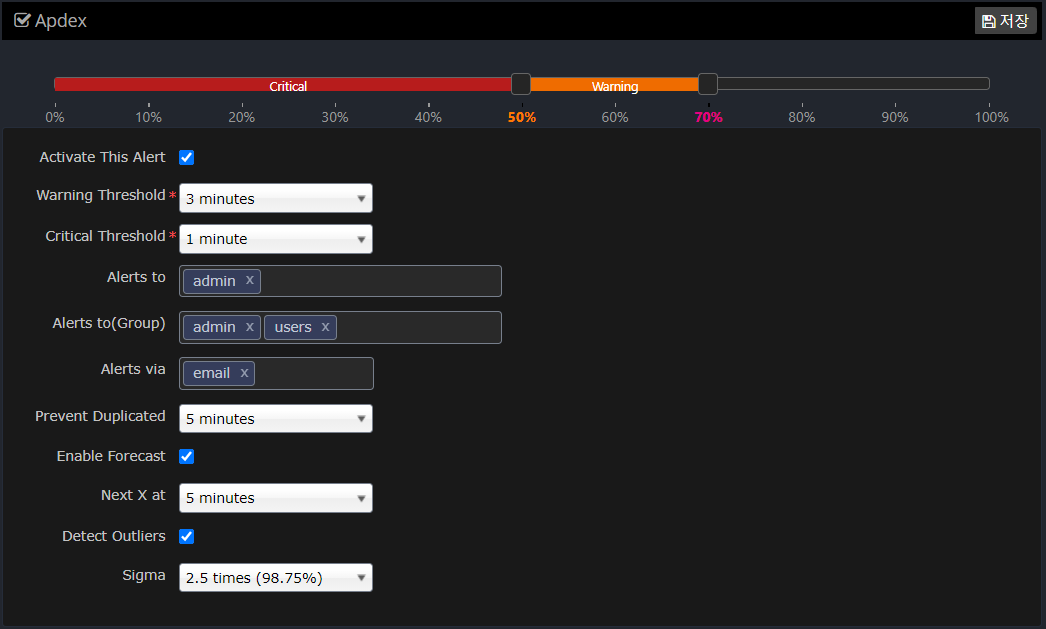
Set each item in the following way.
| Item | Description |
|---|---|
Slider to set the Warn, Critical value |
Set the Warning, Critical value for this item. |
Activate This Alert |
Determines whether to enable this alert item. |
Warning Threshold |
When the average value of the data over a set period of time exceeds the set Warning value, an alert event occurs. |
Critical Threshold |
Fires an alert event when the average value of the data over the set time period exceeds the set Critical value. Generally, the time to determine Critical is set to a smaller value than Warning. |
Alerts to |
Specifies which users to raise the event to. |
Alerts to(Group) |
Specifies which groups to raise the event to. |
Alerts via |
Sets whether the event is notified via email. |
Prevent Duplicated |
Prevent the same event from occurring for a specified amount of time to prevent the same alert event from occurring over and over again. |
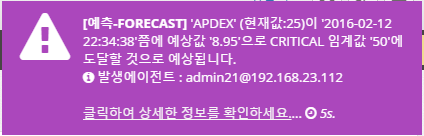
Enable Forecast |
Sets whether to enable the Forecast feature. |
Next X at |
Sets the time to forecast. If you set Next X to 5 minutes, the forecast will predict the value in 5 minutes based on statistics and notify you with a forecast alert event. |
Detect Outliers |
Set whether to notify you of outlier values based on real-time statistics. |
Sigma |
Specifies a standard deviation (Sigma) value to alert you when a value outside the range is detected. |
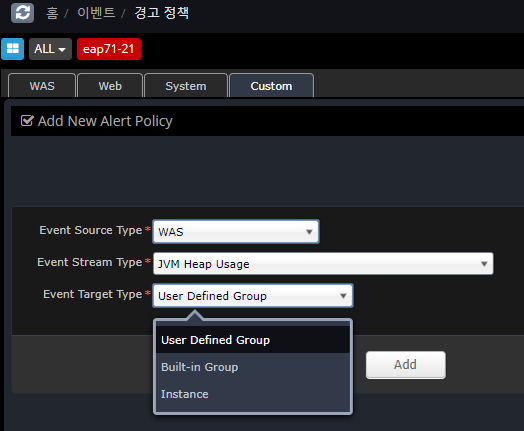
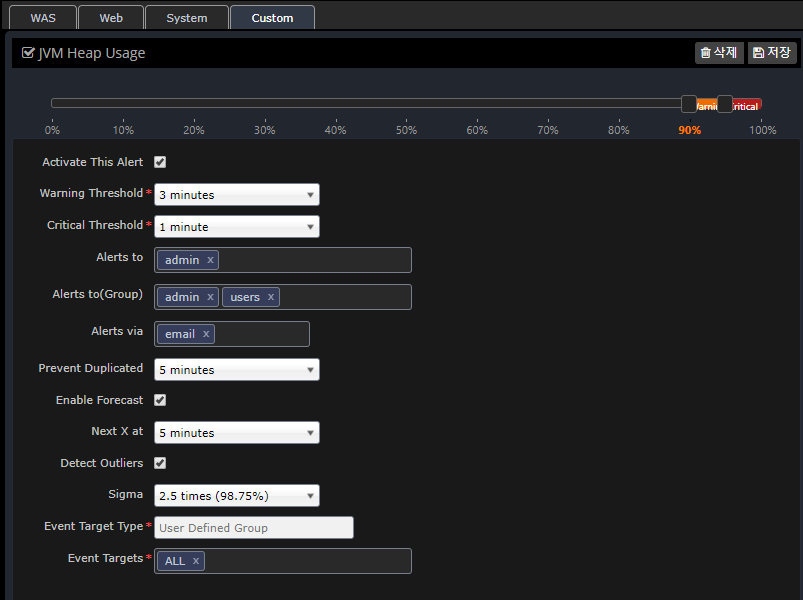
Setting up custom alerts
Alert messages can be customized to be sent to different people for each SYS, WEB, and WAS instance and group.
You can register using the Custom tab as shown below, and if you do not register additional information, it will default to the information registered in the WAS, Web, and System tabs.
In the case of duplicate registration in User Defined Group, Built-in Group, and Instance, the priority is as follows.
-
Instance > User Defined Group > Built-in Group > Preferences (WAS, Web, System)
What is Standard Deviation?
In statistics, the standard deviation is a value that expresses how far apart values are scattered. In statistics, standard deviation is represented by Sigma. For the purposes of setting up warnings, Sigma is the standard deviation.
If the data values are normally distributed, the standard deviation (Sigma) value is represented by the following graph.
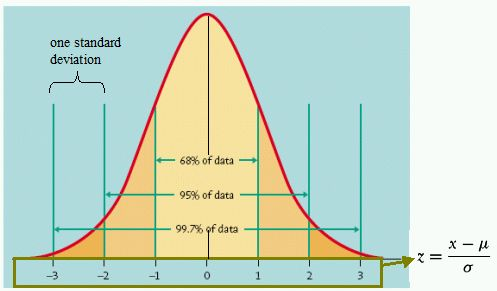
In general, data values will be mostly distributed around the mean. Within 2 standard deviations (Sigma), 95% of the data will be distributed, and within 3 Sigma, 99.7% of the data will be distributed. In other words, most of the data will be within this range.
When applied to monitoring data that changes over time, if you see values outside of these ranges, say 5% at 2 Sigma and 0.3% at 3 Sigma, you know that you’re monitoring data that is statistically out of the ordinary. In statistics, this is known as an outlier.
In OPENMARU APM, we use an algorithm that uses real-time statistics to determine and notify you of outliers for alert settings. This allows you to be alerted as soon as unusual values are collected.
The real-time forecast also uses an algorithm based on these statistics to predict data for the next few minutes and notify you as a warning event.
Types of event messages
Event messages are displayed in the upper right corner of the screen when they occur. The types are as follows
Information - INFO
Displays the following events when the agent is connected and when user-requested commands such as thread dump, open file, and network status analysis are executed.

Warnings - WARN
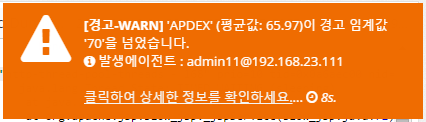
Displays the following event message when an item in the warning policy exceeds the WARN setting. "The current average value XX has crossed the warning threshold 'XX'" and displays the location of the agent where the event occurred.
Clicking on the link will take you to the graph where the event occurred to understand the current state.
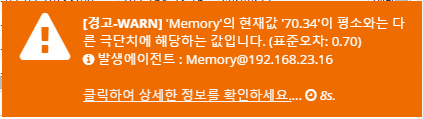
WARN - Extremes
If a value is collected that is an extreme value based on the standard deviation, the following event message will be displayed.
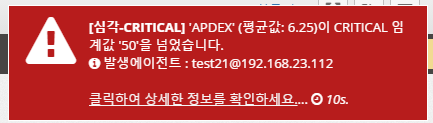
Severe - CRITICAL
Displays the following event message when an item in the alert policy exceeds the CRITICAL setting. "The current average value XX has crossed the warning threshold 'XX'" and displays the location of the agent where the event occurred.
Clicking on the link will take you to the graph where the event occurred to understand the current state.
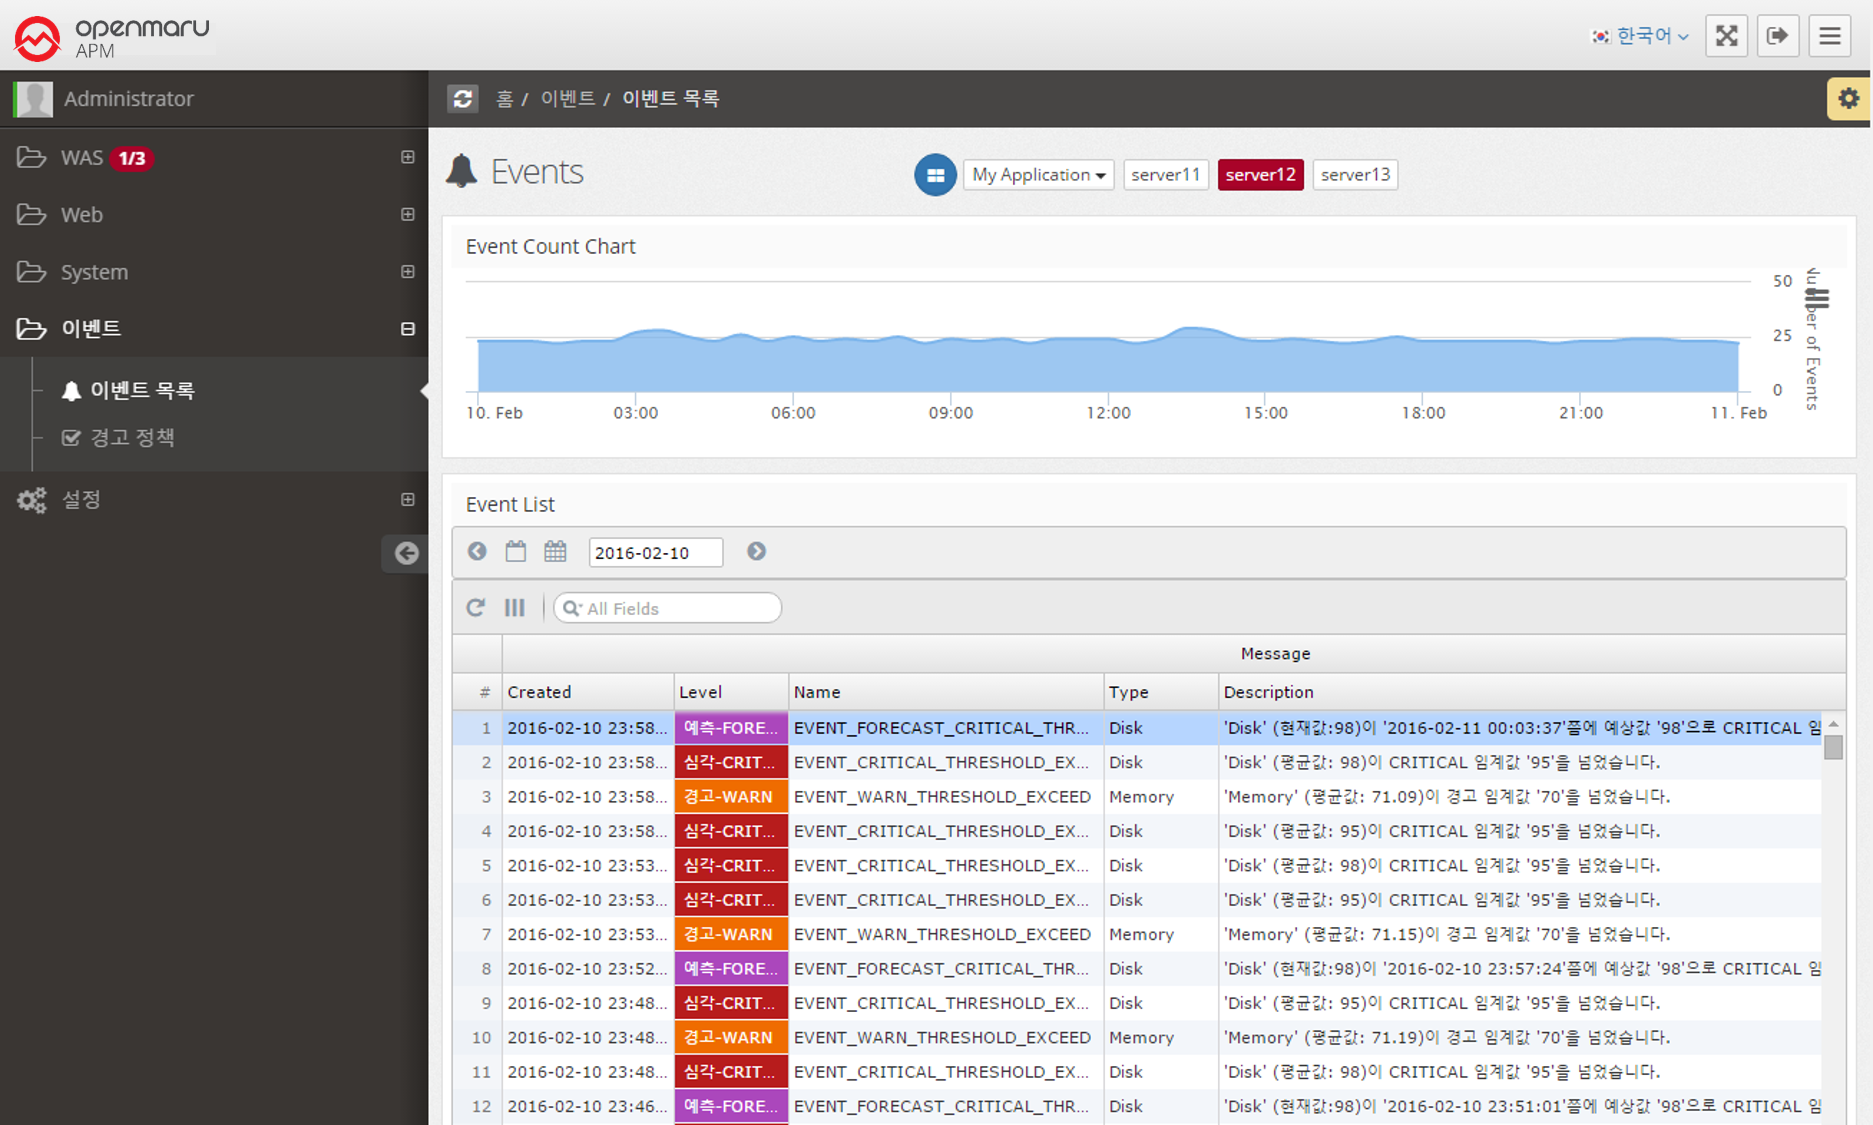
Event list
Provides the ability to search for events that have occurred on a daily basis.
It displays a graph of the number of events over time at the top and a list of events at the bottom.
You can change the date to search for events that occurred on that date, or you can search for events. You can click on a column name in the table to sort by that column to analyze the event data.
How to integrate events
Refer to Event Setup Guide to set up event notifications.
2.8.1 How to use reports
You can download daily and weekly reports from the 'Reports' menu.
The daily report and the weekly report at 13:00 midnight every day will automatically generate an Excel file at 33:00 midnight on the day the weekly report is generated.
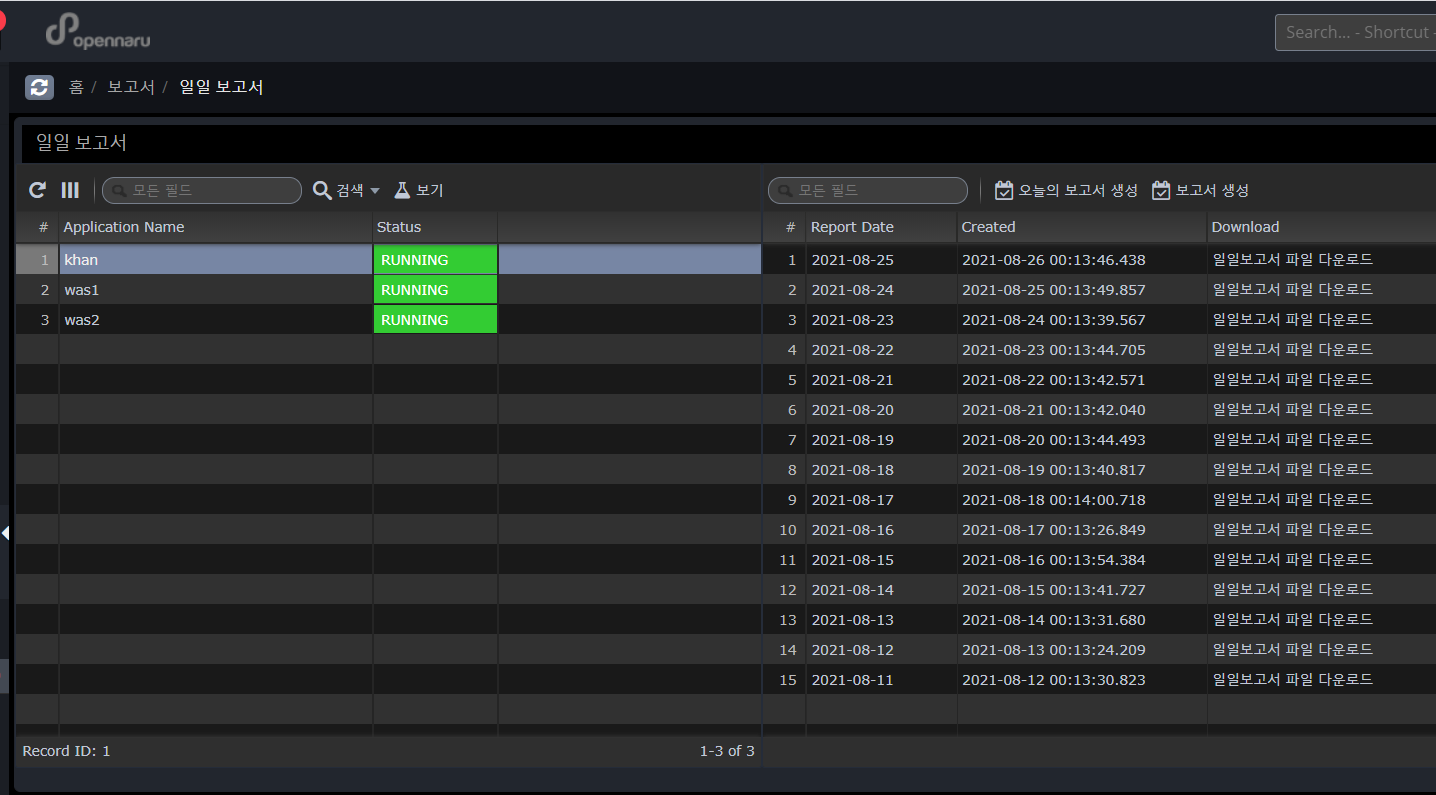
Daily report
The daily report is generated for each application group, and 'Report Date' means the date of the report contents, and 'Created' shows the date and time when the report excel file was created. Click the 'Download daily report' link to download the excel file.
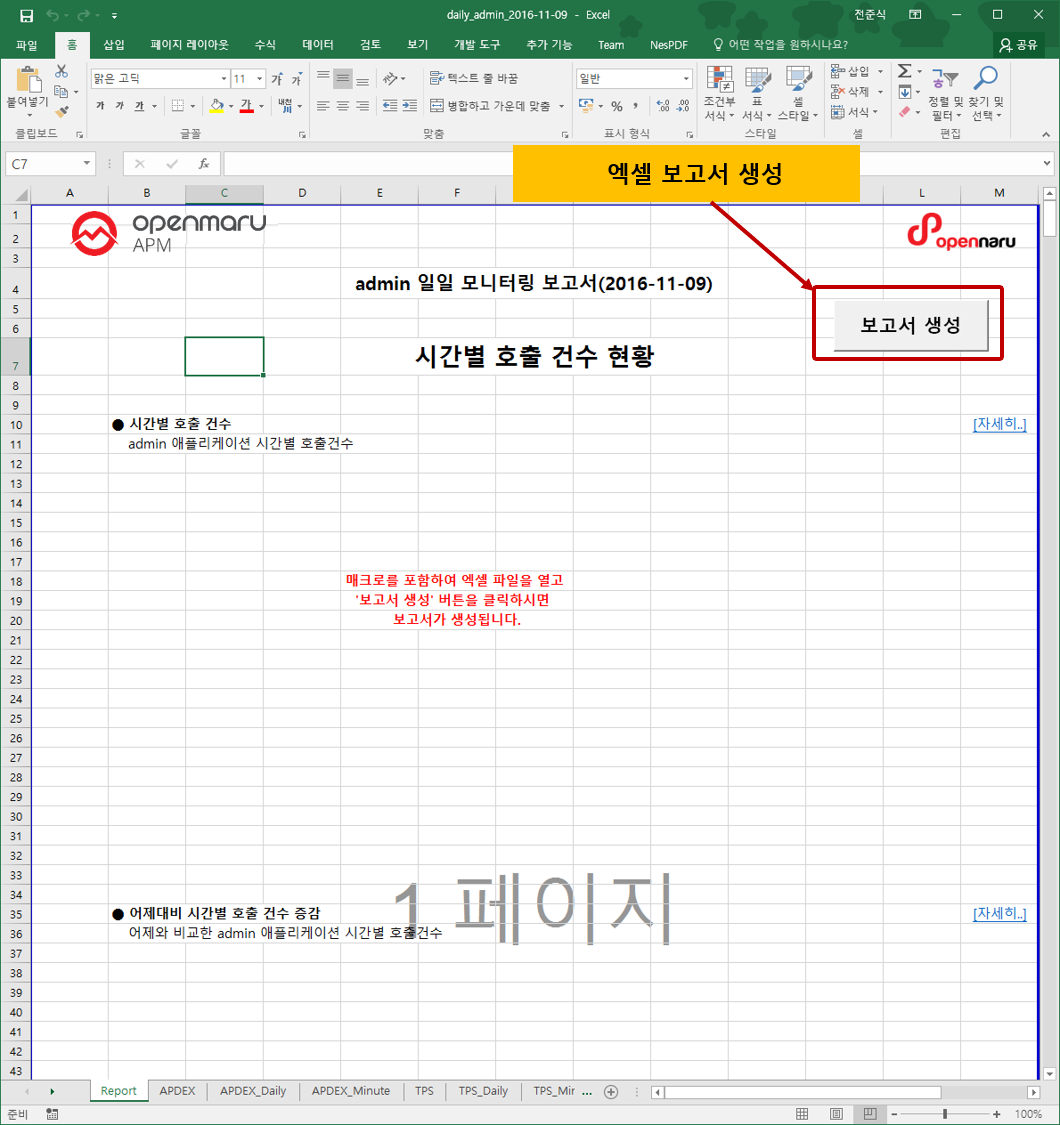
Generated report
The report generates hourly call count, hourly average response time, hourly APDEX, hourly TPS, hourly active users, hourly error rate, hourly JVM Heap utilization status, hourly system CPU utilization, hourly system memory utilization, top 50 slow URLs, and top 50 slow queries for each item.
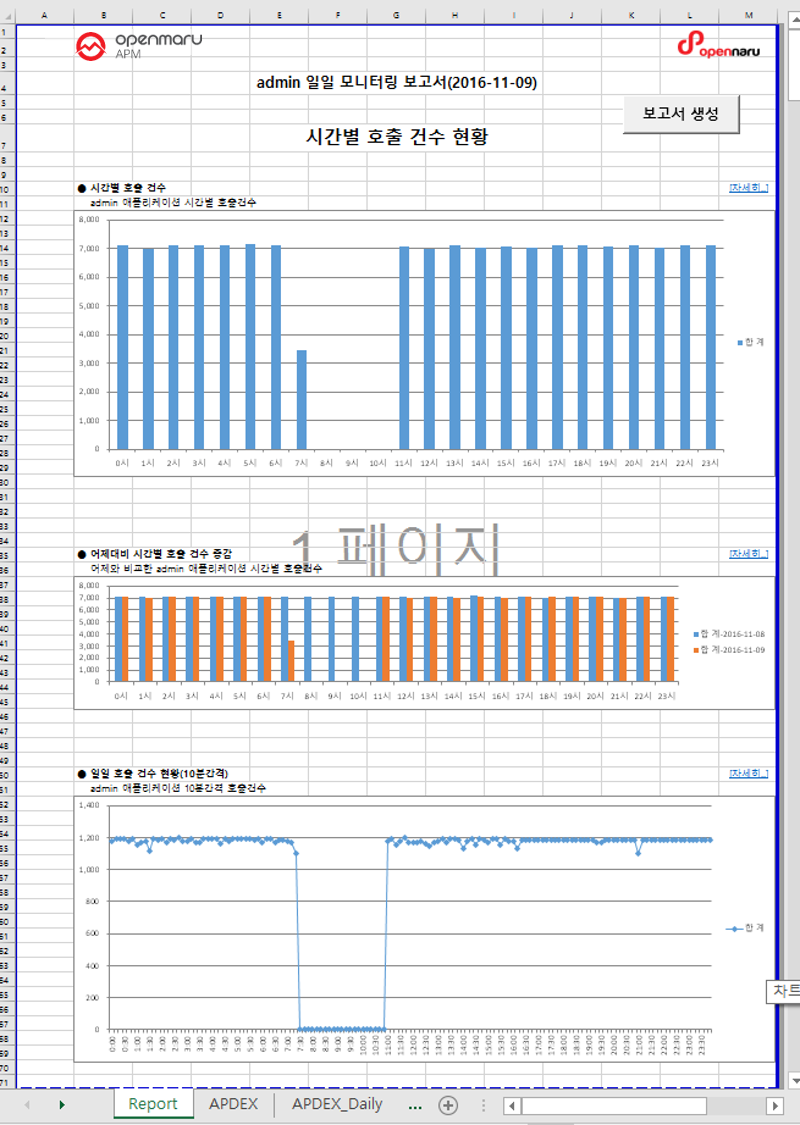
The first tab, 'Report', displays a summary report for each item, and each tab shows hourly data items, hourly data items compared to yesterday, and 10-minute data items.
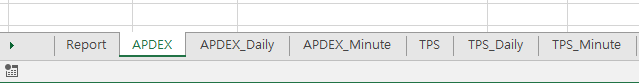
Each Tab item displays tabular data and a graph.
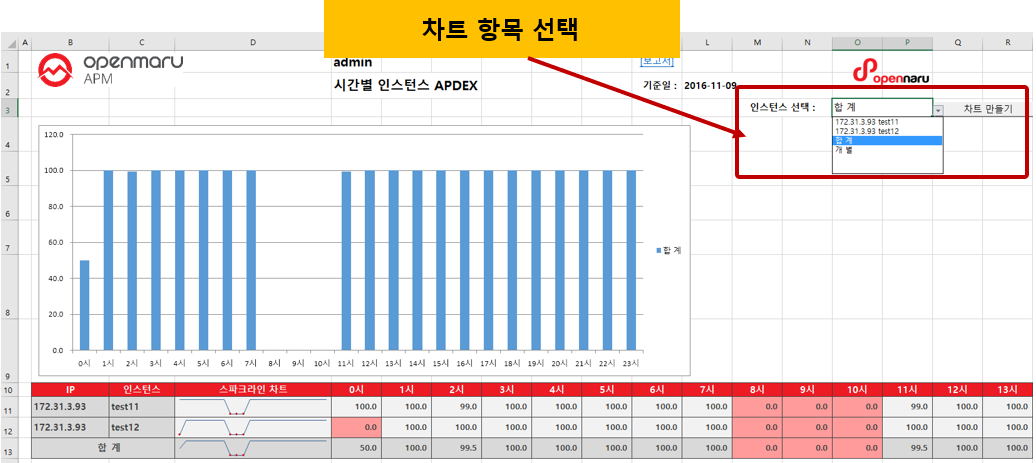
To change the automatically generated graph, select the item you want to graph from the "Select Instance: menu, select the item you want to graph, and click the 'Create Chart' button to create a graph with that item.
Weekly Report
The weekly report is generated for each application group, and the 'Report Date' means the date of the report content, and 'Created' shows the date and time when the report excel file was created. Click the 'Download Weekly Report' link to download the excel file.
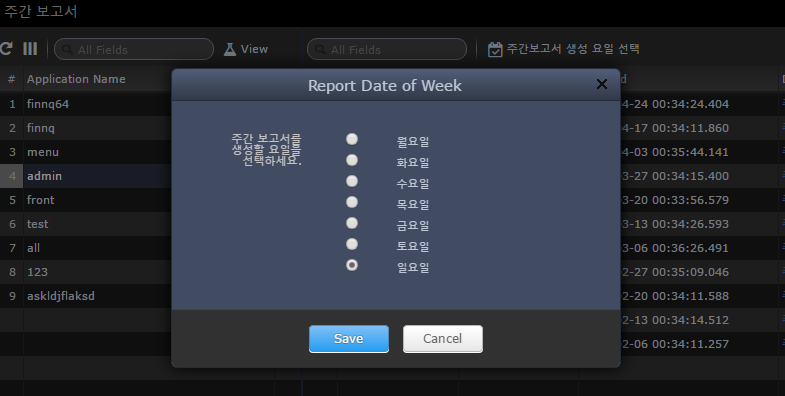
By clicking the 'Select Weekly Report Generation Day' button, you can select the day of the week you want to generate the weekly report. For example, if you select 'Sunday', the statistics from last Monday to midnight Sunday will be generated at 33:00 on Monday morning.
To generate the Excel file for the weekly report, download the Excel file and click the 'Generate Report' button, just like the daily report.
2.9.1 Settings
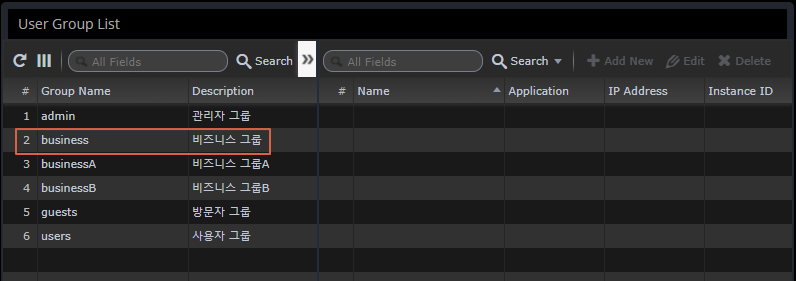
Manage User Groups
User Groups is a menu to manage the groups to which a user belongs.
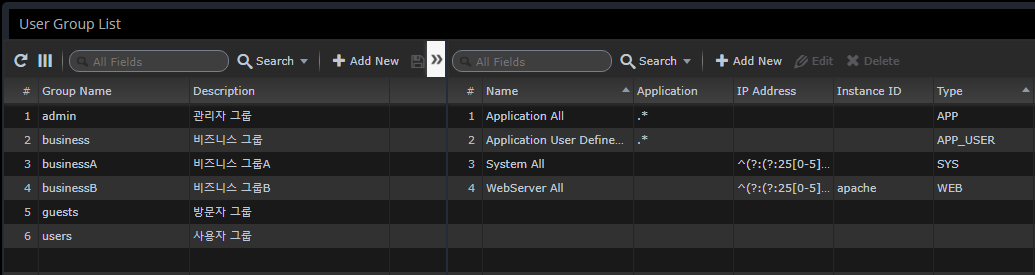
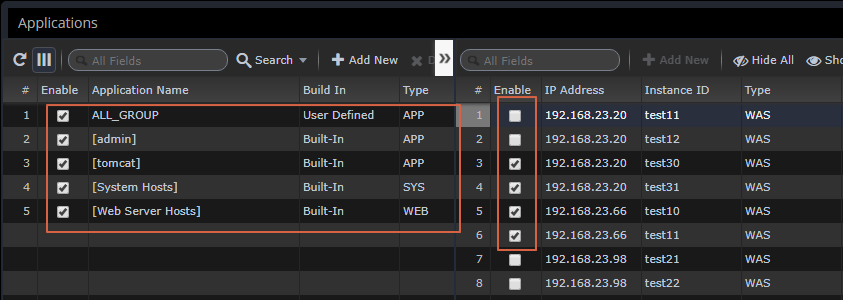
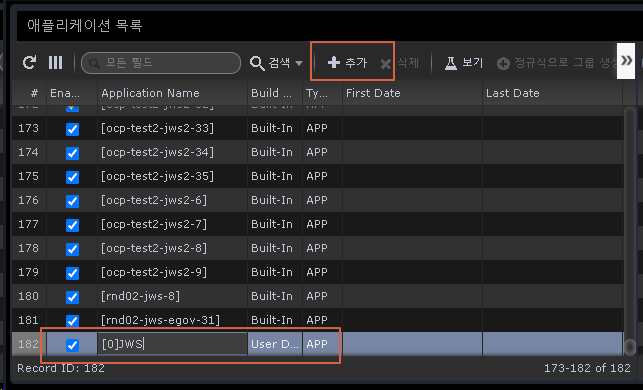
Assign administrative resources to groups
This is used to selectively control the monitored application by department/team.
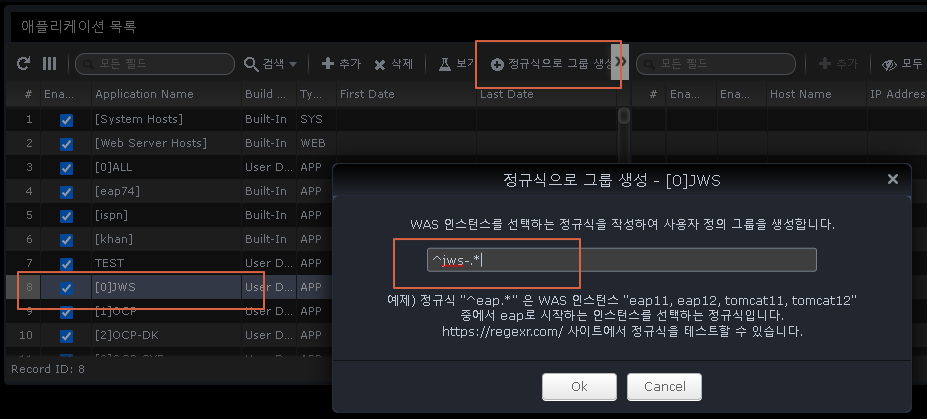
You can selectively assign them through regular expressions.
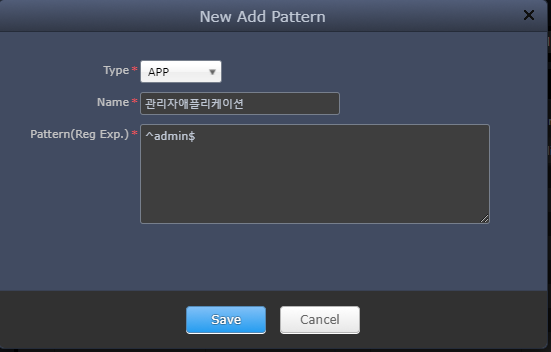
-
Type
-
APP - Monitor WAS default application group
-
APP_USER - "Application Group" management book default group specified as user-defined
-
WEB - Web Server monitoring
-
SYS - System monitoring
-
As a result of the assignment with the regular expression "^admin$", only information about that application can be monitored by that account.
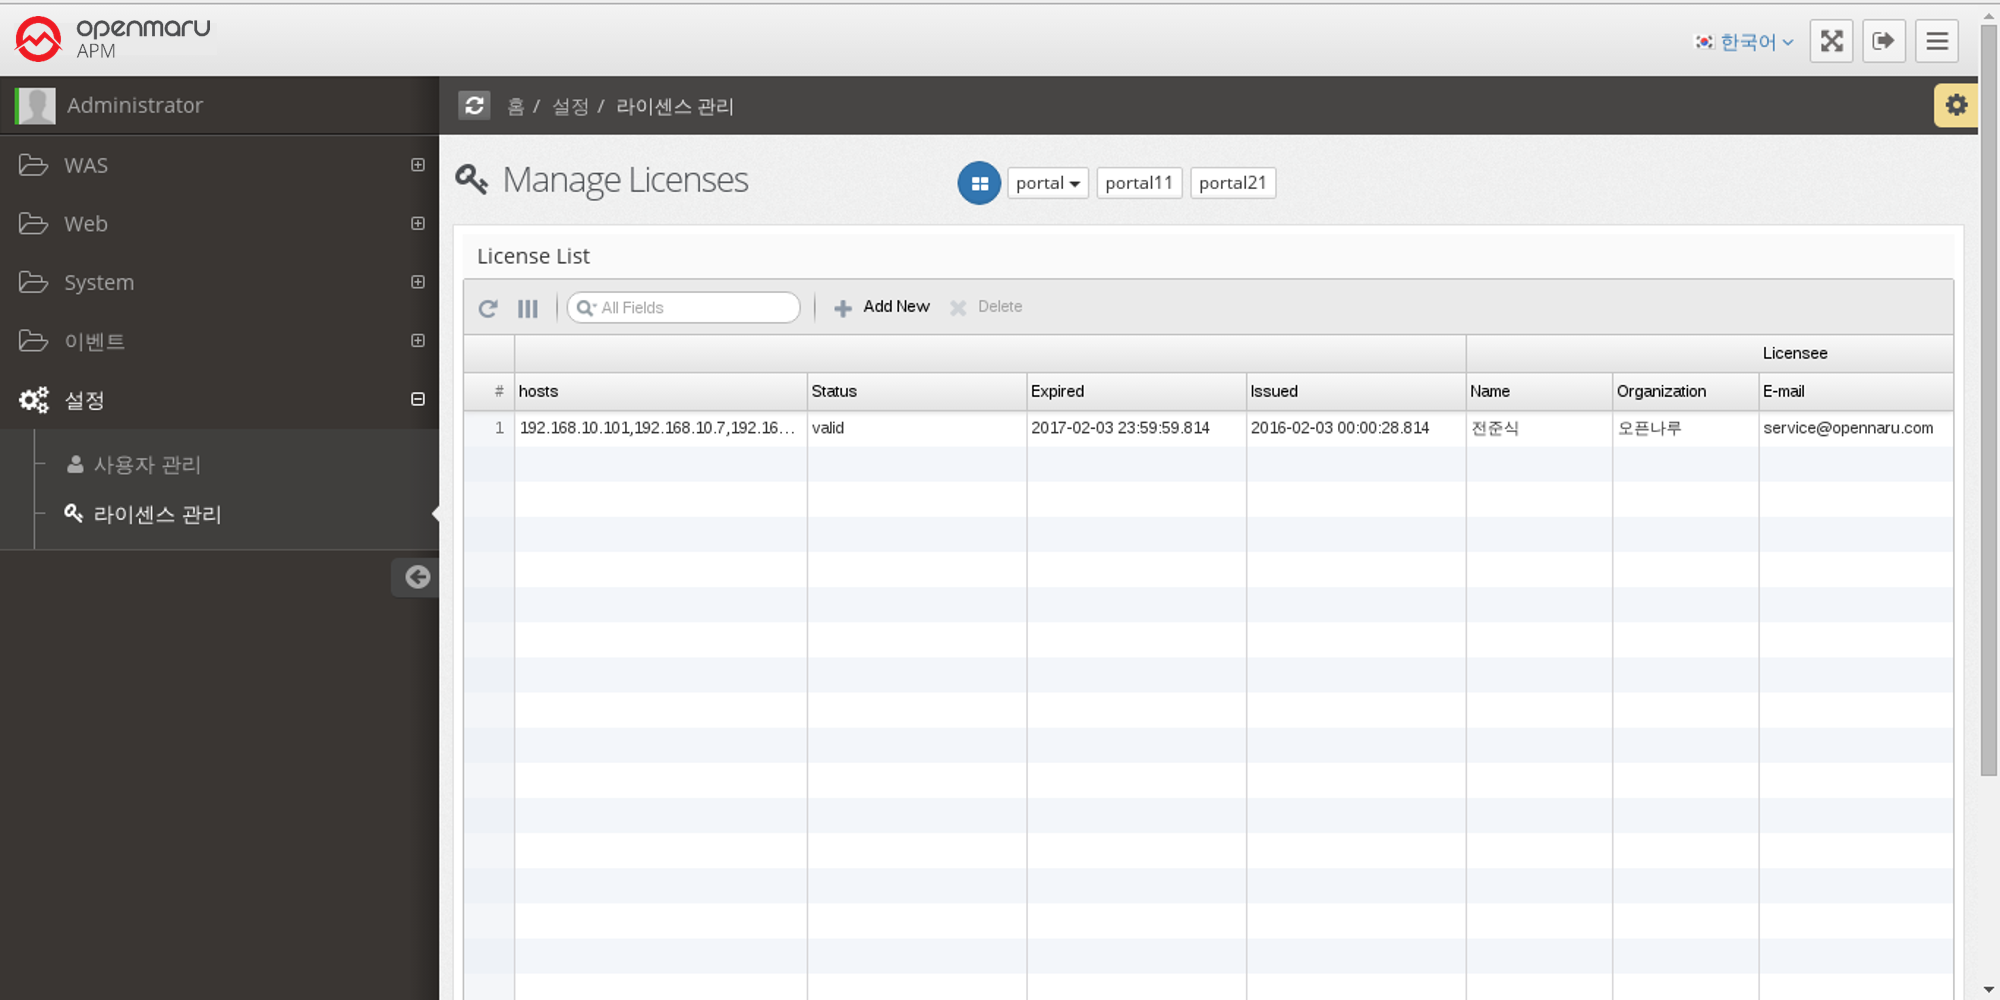
2.9.2 License Management
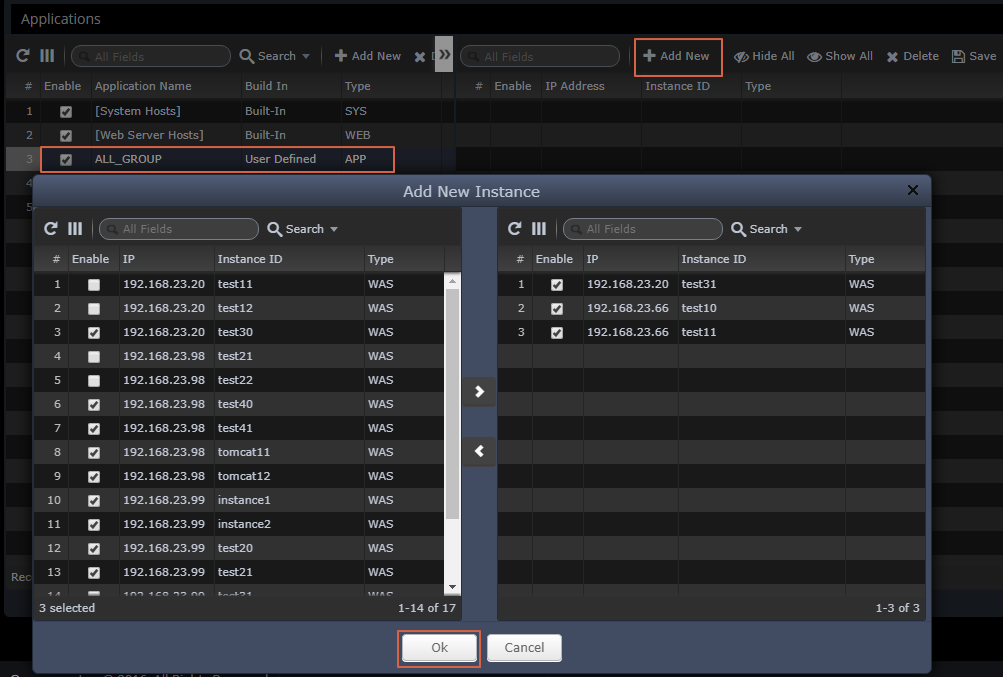
Enter OPENMARU Cloud APM license
You can manage the license of OPENMARU APM as follows by selecting 'Settings' 'License Management' from the left menu. To enter the issued license, click the 'Add New' button.
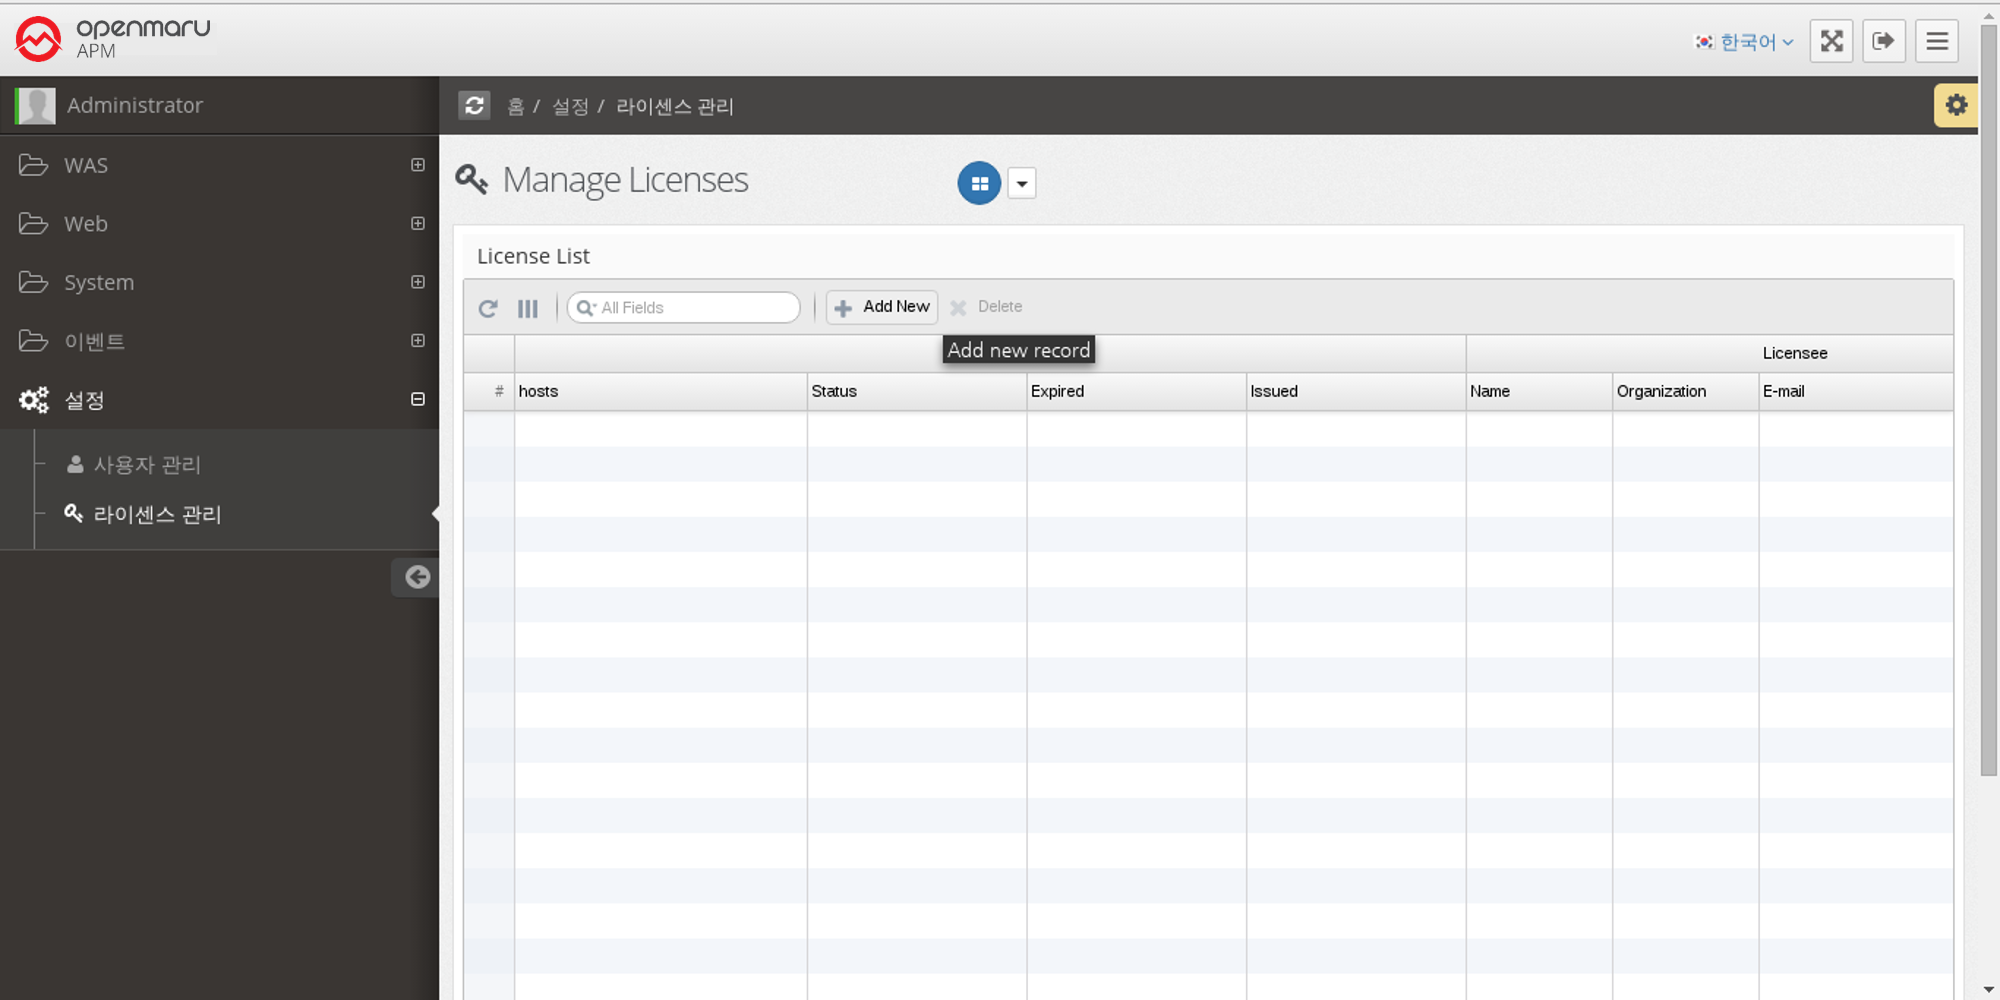
Enter the issued license in the license field and click the 'Save' button.
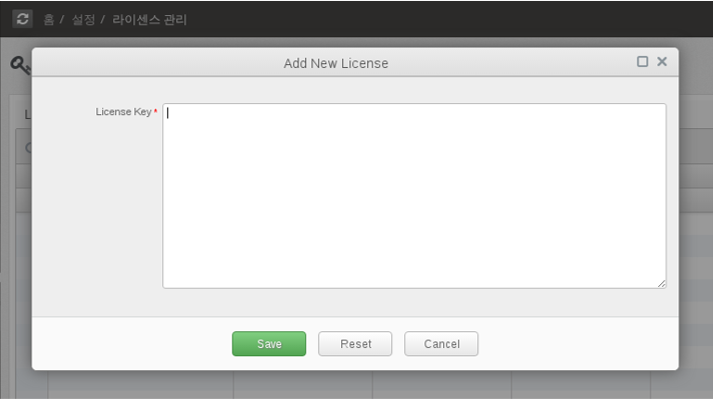
The license has been entered into the server as shown below.
2.10.1 How to respond to server failures with APM
How to analyze when a service is slow
When a service is slow, a thread dump can help you determine the cause. When a service is slowing down, you can use APM’s metrics to understand what’s going on.
-
The user satisfaction index (APDEX) is getting lower and lower.
-
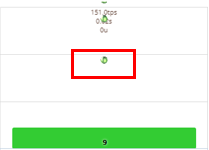
The TPS value decreases and the Average Response Time value increases.
-
TPS value decreases and Average Response Time increases. Request Velocity’s Pending Requests pile up.
-
Pending Requests Dots appear at the top of the Transaction Heatmap (T-Map).
How to analyze a thread dump
At this point, getting a thread dump and analyzing it will help you determine the cause of the failure.
Since thread dumps are snapshots of the JVM, it is recommended that you take 5 thread dumps at 3-5 second intervals.
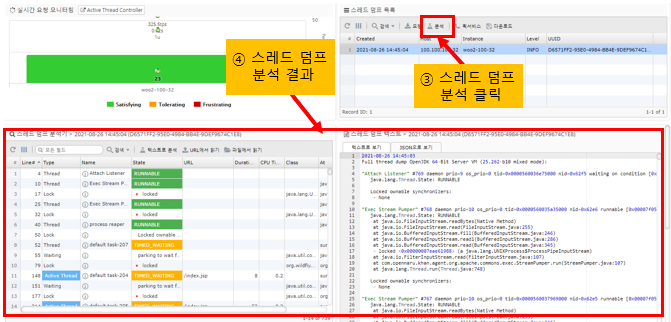
If you see an instance in your dashboard that is accumulating pending requests, click the pending request bar for that instance to be taken directly to the page where you can analyze the thread dump.
-
How to request a thread dump
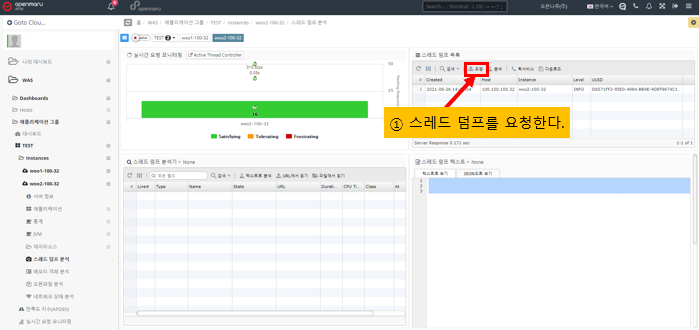
-
Selecting a thread dump
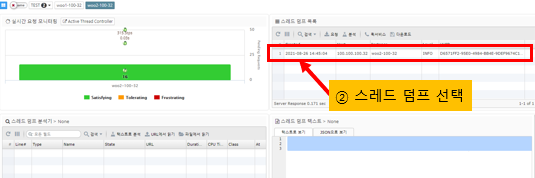
-
Click the Analyze Thread Dump button
-
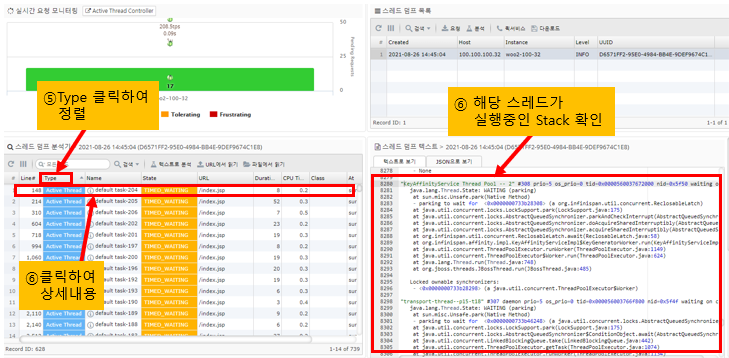
Active Thread is the thread that is currently processing the Request
The Active Thread is the Request that is currently being processed at the time the thread dump is run in APM, as an additional piece of information in the thread dump.
By sorting threads by Active Thread, you can see the URL information that is currently being served, the CPU usage of the application up to the time of the thread dump, and the execution time.
Clicking on a row in the thread dump table on the bottom left will take you to the corresponding line in the thread dump on the bottom right, where you can see the stack information for the application that the thread is currently running.
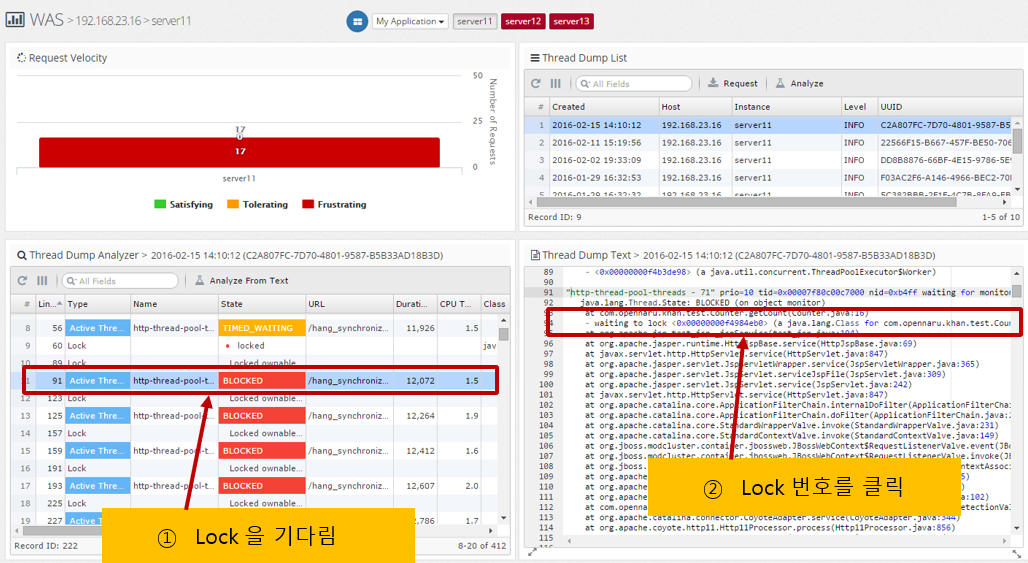
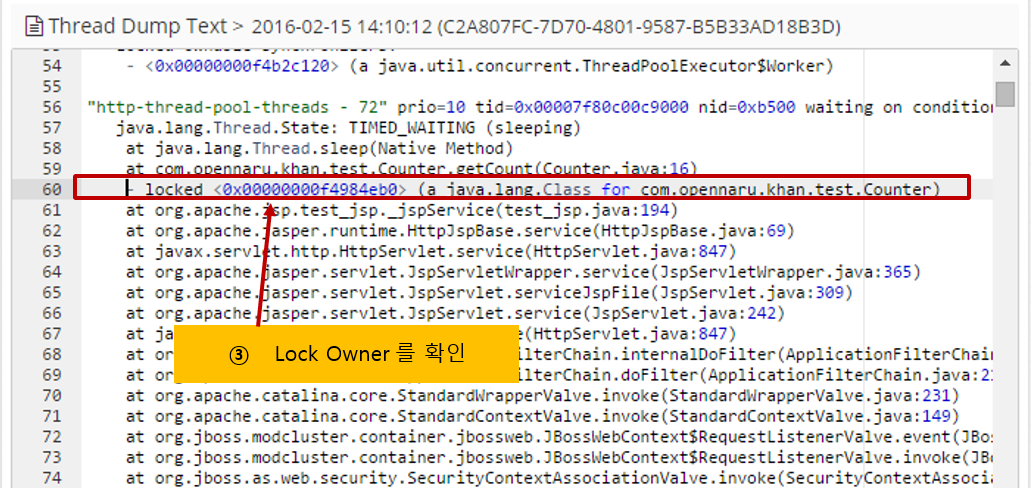
Analyzing Lock Relationships
When multiple threads share a single variable or method, Java’s syntax uses synchronized to prevent them from accessing it at the same time. If you see BLOCKED in a thread dump, it means that the thread that holds the lock has to wait for the other thread to release the lock, potentially slowing down the system.
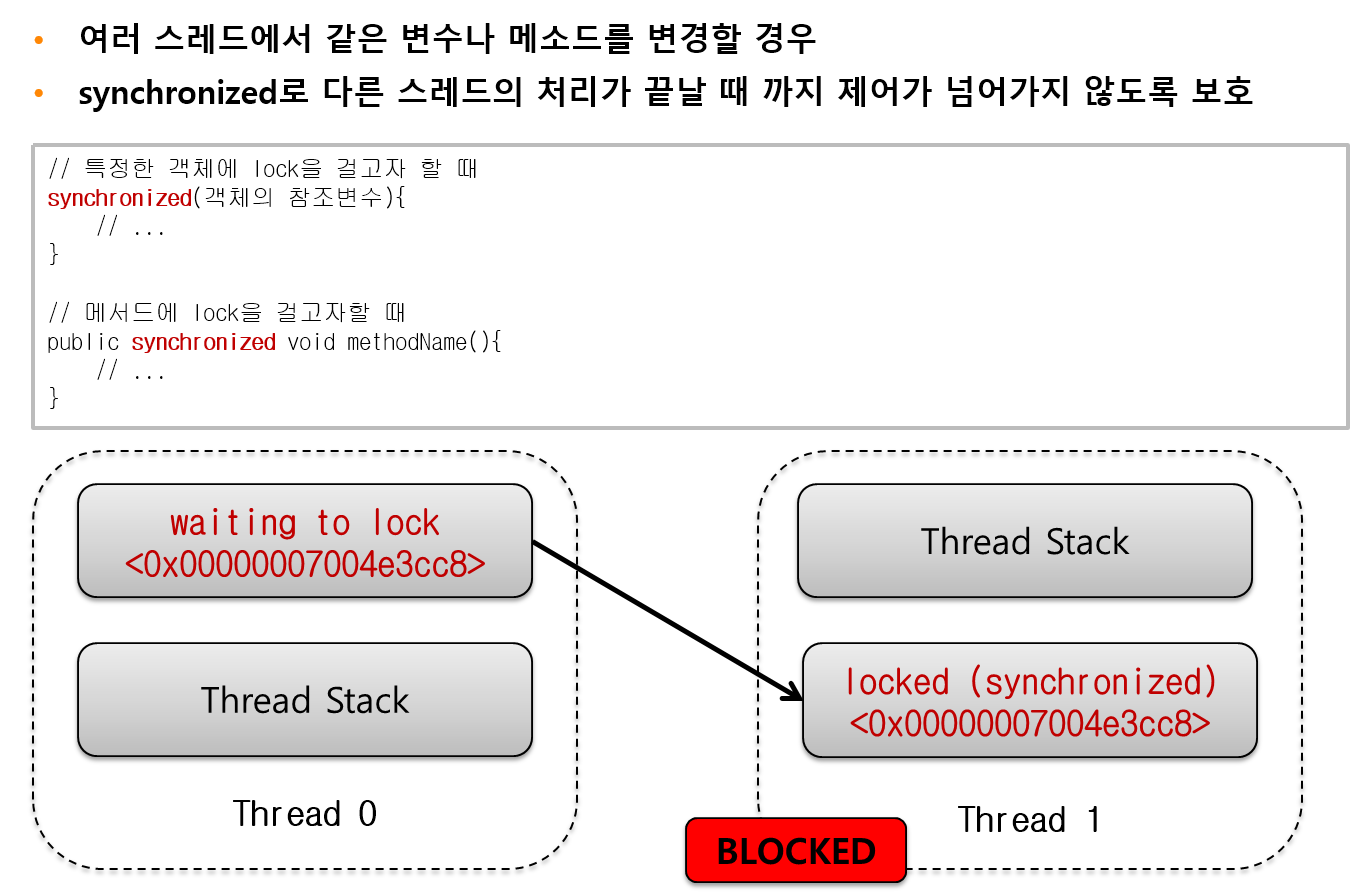
In APM’s thread dump analysis, it is labeled BLOCKED as shown below, and if you click on the column, the waiting lock information is displayed, such as waiting to lock <0x0000….>.
Here, you can click the lock number to go to the thread that holds the lock.
You can analyze it with the following procedure.
How to display methods in the trace that you are curious about the execution speed of the application you are developing?
If you are curious about the execution speed of the application you are developing in production, simply add the @TraceMethod annotation to your code and it will be added to the Transaction Trace item in APM to check the execution time of the method.
-
Download and compile the APM API.
$ mvn install
Alternatively, you can download the compiled JAR from the following URL.
-
Add a dependency to your pom.xml file.
Add the dependency as follows
<dependency>

	<groupId>com.opennaru.khan</groupId>

	<artifactId>khan-monitoring-api</artifactId>

	<version>1.3.0</version>

</dependency>-
Using the @TraceMethod annotation.
Call a class named Test in the JAX-RS method like below.
package com.opennaru.rest;

import javax.ws.rs.GET;

import javax.ws.rs.Path;

import javax.ws.rs.PathParam;

import javax.ws.rs.core.Response;

@Path("/users")
public class UserRestService {

	@GET
	public Response getUser() throws Exception {

		Thread.sleep(1000);

		Test test = new Test();

		test.test();

		Thread.sleep(1000);

		Test2 test2 = new Test2();

		test2.test();

		Thread.sleep(1000);

		return Response.status(200).entity("getUser is called").build();

	}

}-
Add the @TraceMethod annotation to the test() method of the Test class.
package com.opennaru.rest;

*import com.opennaru.khan.agent.instrument.TraceMethod;*

public class Test {

	public Test() {

	}

	*@TraceMethod*

	public void test() {

		try {

			System.out.println("start test");

			Thread.sleep(1000);

			new Test2().test();

			System.out.println("end test");

		} catch(Exception e) {

			e.printStackTrace();

		}

	}

}-
The Transaction Trace item shows the execution time of the Test.test() method with the @TraceMethod annotation as follows.
===========================================================================

[Num.][ Start Time |Elapsed| % | B-Gab|Exclusi| A-Gab| CPUTime] Method Call

---------------------------------------------------------------------------

[ 1][18:25:09.342| 6,327| 100| 0| 5| 0| 0.0]+ org.apache.catalina.connector.CoyoteAdapter.service()

[ 2][18:25:09.346| 6,322| 100| 0| 237| 6,085| 0.0] + org.jboss.resteasy.plugins.server.servlet.HttpServletDispatcher.service()

*[ 3][18:25:09.557| 6,085| 96| 0| 3,080| 3,005| 0.0] + @GET com.opennaru.rest.UserRestService.getUser() *

*[ 4][18:25:10.634| 2,004| 32| 0| 1,003| 1,001| 0.0] + @TraceMethod com.opennaru.rest.Test.test() *

[ 5][18:25:11.636| 1,001| 16| 0| 1,001| 0| 0.0] + @TraceMethod com.opennaru.rest.Test2.test()

[ 6][18:25:13.638| 1,001| 16| 0| 1,001| 0| 0.0] + @TraceMethod com.opennaru.rest.Test2.test()